Open Access is an initiative that aims to make scientific research freely available to all. To date our community has made over 100 million downloads. It’s based on principles of collaboration, unobstructed discovery, and, most importantly, scientific progression. As PhD students, we found it difficult to access the research we needed, so we decided to create a new Open Access publisher that levels the playing field for scientists across the world. How? By making research easy to access, and puts the academic needs of the researchers before the business interests of publishers.
We are a community of more than 103,000 authors and editors from 3,291 institutions spanning 160 countries, including Nobel Prize winners and some of the world’s most-cited researchers. Publishing on IntechOpen allows authors to earn citations and find new collaborators, meaning more people see your work not only from your own field of study, but from other related fields too.
Subsistence fisheries for Michipicoten First Nation (MFN) in habitats across an area north of Lake Superior in Ontario, Canada were assessed. This assessment used reports by Ontario, private entities (e.g., mines), and MFN to evaluate contaminant concentrations in fishes from the 1980s to 2021; methylmercury was determined to be the contaminant of primary concern in fish tissues. Methylmercury tissue concentrations for varied fish species from four lakes and one river were used to establish contaminant-fish length relationships. Observed methylmercury tissue concentrations for these fishes allowed for the creation of updated consumption recommendations in MFN’s subsistence fisheries. This study recommended updated consumption rates for fish species including Northern Pike (Esox lucius), Walleye (Sander vitreus), Lake Trout (Salvelinus namaycush), Burbot (Lota lota), Lake Whitefish (Coregonus clupeaformis), White Sucker (Catostomus commersoni), Longnose Sucker (Catostomus catostomus), and introduced Smallmouth Bass (Micropterus dolomieu). Elevated methylmercury concentrations followed increased eutrophication in these naturally oligotrophic watersheds from loading of plant nutrients, from both diffuse and defined regional sources. Nutrient mitigation measures to control in situ methylmercury production cannot be implemented as neither the nature or extent of past or current nutrient loading from various sources has been identified or estimated in the region.
L.S. McCarty Scientific Research and Consulting, Ontario, Canada
*Address all correspondence to: deanfishy@hotmail.com
1. Introduction
There has been a worldwide increase in the levels of a variety of chemical substances in the natural environment, largely since the early 1900s [1, 2, 3, 4, 5, 6]. These increases can be attributed to human activities, including agriculture, road building, dams, natural floods, forest harvest, forest fires, mining, burning of coal and wood, urbanization, exhaust from combustion engines, etc. Such activities have contributed to the widespread dispersal of chemical substances across ecosystems. When ecosystem components are disturbed, the scale and duration of the activity influence how chemical substances are distributed [6]. Disturbances can also result in immediate or delayed environmental effects on organisms ranging in magnitude from small to large and varying across organisms and life stages [6].
Some substances associated with ecosystem disturbances can bioconcentrate in the tissues of both plants and animals over time. Bioconcentration through direct exposure, as well as bioaccumulation via dietary uptake, can result in net bioconcentration/bioaccumulation within food webs, a process formally termed biomagnification. This process transfers substance(s) from water and soil to plants and then to wildlife in terrestrial ecosystems or from water and sediment to plants to fish to predators in aquatic ecosystems [6]. Due to differences across ecosystems habitats and species, and variability in the rate of transfer of substances, monitoring studies are required to manage this risk for humans and wildlife [3, 7, 8].
Such bioaccumulation/biomagnification across species and ecosystems justifies biomonitoring of traditionally harvested items such as berries, plants, fish, and wildlife. A key component is estimating typical consumption patterns for various foodstuffs that may contain substances considered hazardous at elevated concentrations. The most effective process is to measure concentrations in monitoring data for the food, along with samples from air, water, sediment, plants, fish, and wildlife [6].
The nature and degree of risks to human health vary with circumstances such as age, sex, and diet [6]. Although consumers of fish are exposed to increased concentrations of chemicals, Indigenous consumers are a particular concern as they may consume a higher proportion of wild-caught local fish, for cultural or subsistence reasons [6, 9, 10]. Thus, it is important to study the consumption of country foods separately from foods used in urban areas, to ensure consumption risks are understood, prevented, or mitigated.
Canada in general, and Ontario in particular, has been a leader in monitoring domestic freshwater fish contamination and recommending safe consumption rates for habitats ranging from rivers to lakes to reservoirs [3, 5, 6, 11]. The first Guide to Eating Ontario Sport Fish (GEOSF) was published in 1978 [12]. This public information program, with recommended human fish consumption by waterbody and species, continues to this day [13].
The main contaminants of concern (COCs) reported in GEOSF are mercury (bioavailable organic methylmercury in tissue, not inorganic mercury), dioxins, polychlorinated biphenyls (PCBs), and several pesticides (e.g., mirex, DDT, toxaphene). The standard GEOSF approach measures the concentration of chemical substances in a skinless, boneless sample of dorsal fish muscle. This measurement of chemical substances in muscle flesh represents a surrogate for other tissues within the fish and provides a consistent strategy to quantify consumption [6].
The inclusion of the chemical substances of concern within GEOSF reflects findings from studies linking dietary exposure to health impacts in humans and wildlife. The linkage between exposure to methylmercury with a range of health impacts has been documented within various settings across North America (reviewed in [6, 9]). A suite of studies [3, 5, 6, 11] have quantified the linkage between methylmercury in water or sediments of aquatic habitats and corresponding concentrations in different components of the food web (e.g., plants, invertebrates, fish, wildlife). These studies have linked concentrations of methylmercury in sediment with other components of the food web, and demonstrate how the concentration of methylmercury in fish and wildlife tissue reflects existing environmental conditions, especially total phosphorus (TP) [6].
1.1 Observation of eutrophication in northern Ontario forested watersheds
Studies in northern Ontario have quantified the relationship between disturbance within primarily forested watersheds leading to greater eutrophication of lakes and rivers. When these forested watersheds are disturbed, this can trigger episodic algal blooms and elevated growth of macrophytes with increasing frequency [1, 6, 14, 15, 16]. It is now understood such disturbance in forested watersheds leading to observation of eutrophication is linked to increases in TP loading to surface waters, particularly from high rates of atmospheric dust along with wood ash deposition [14, 15, 16, 17]. Hence, disturbance of forested watersheds, starting with road building, forest harvest, or other anthropogenic activities, leads to the secondary effect of an increase in dust and ash, concomitant with elevated TP deposition to surface waters causing eutrophication. With this understanding, the general pattern of increased TP loading into lakes and rivers results in the unexpected effect of enhanced rates of biotransformation of inorganic mercury to methylmercury [3, 18, 19, 20]. However, in the nutrient-poor (i.e., oligotrophic) watersheds common on the Canadian Shield of northern Ontario, even modest increases in TP leads to eutrophication-enhanced increases in the rate of biotransformation of inorganic mercury already present in the watershed to methylmercury. This poses a problem for recreational and subsistence fishers, as the methylmercury in fish tissue has been observed to increase rapidly over time within forested watersheds.
Confirmation of the link between concentration of COCs, such as inorganic mercury and TP in the environment, with eutrophication-enhanced biomethylation and associated food web biomagnification of organic methylmercury into tissues of fishes and wildlife, is both the justification for monitoring ecosystem components and the means to manage risks related to consumption of contaminated fish and wildlife [3, 6, 9, 19].
Such monitoring allows for the identification of risk thresholds for varying consumption rates among species under differing scenarios across ecosystems [3, 6, 18, 21]. For example, how many portions of fish or wildlife can be safely consumed during a period by a person in a country setting compared with periodic consumption by an urban resident? Or, how many portions of fish or wildlife can be consumed by a predator such as Bald Eagle (Haliateetus leucocephalus) that consumes fish and wildlife or American Marten (Martes americana) that also consumes fish and wildlife from the same habitat as humans.
As circumstances can change over decades, monitoring of time trends in fish tissue methylmercury levels is vital for ongoing risk assessment. Monitoring fish populations provides the basis to update the status of regional fish tissue methylmercury concentrations and ensure that human and wildlife consumption guidance is sufficiently protective.
Unlike typical environmental monitoring programs, that focus on air, soil, water, and sediment concentrations, organism-based dose metrics (i.e., body- or tissue-based concentrations), such as those employed in the GEOSF program, largely bypass complex bioavailability, phase partitioning, and organism toxicokinetics issues and allow more direct residue-based risk assessment approaches of human food consumption pattern [22]. Thus, not only are data less confounded by extraneous modifying factors, the information and measurements are more readily interpretable and thereby easily communicated to non-technical parties. This process also simplifies the calculation of risk to human consumers and adds objectivity to the risk decision-making process [22, 23].
1.2 Management of nutrients that cause eutrophication in northern Ontario
In Ontario, the PWQO for TP addresses the aesthetic, algal bloom issue with 10, 20, 30 μg/l objectives for lakes and rivers, also noting that for all lakes naturally below 10 μg/l, the TP objective should be to remain below 10 μg/l.
Referring to these provisional objectives formulated in 1979, Ontario ([24], pp. 13–14) notes: “Current scientific evidence is insufficient to develop a firm objective at this time. Accordingly, the following phosphorus concentrations should be considered as general guidelines which should be supplemented by site-specific studies ”. The current site-specific Ontario PWQO for phosphorus is provided in the Lakeshore Capacity Assessment Handbook with both the rationale and application methodology, Ontario ([25], pp. 13–14) stating: “The revised PWQO for lakes on the Precambrian Shield allows a 50 per cent increase in phosphorus concentration from a modelled baseline of water quality in the absence of human influence.”
Thus, it is clear that the regulatory PWQO for TP in water bodies on the Precambrian Shield according to current Ontario regulations, is not the aesthetic-based objects of 10, 20, or 30 μg/l since the eutrophication problem is mercury methylation not aesthetic. Rather, site-specific objectives for lakes and rivers must be developed using the methods presented in Ontario [25]. Additionally, a key policy objective of the PWQO process stated by Ontario ([24], p. 6) is: “Policy 2 states, “Water quality which presently does not meet the Provincial Water Quality Objectives shall not be degraded further and all practical measures shall be taken to upgrade the water quality to the Objectives.”
1.3 Problem identification
Studies in northwestern Ontario suggest when lakes are subjected to increased nutrient stress, the eutrophication process appears to be amplifying existing mercury cycling. This multi-trophic level process is evident across lake and river ecosystems, as supported by studies that indicated increased macrophyte and algal production stimulated by elevated nutrient levels. Such increases in plant production contributes to enhanced microbial production of methylmercury over relatively short periods [3, 20, 21]. Hence, with increased TP leading to eutrophication, concentrations of elemental mercury measured within ecosystems are not a key metric for mercury content in freshwater lake and rivers. Rather, the key driver of the rate of methylation of mercury is nutrient loading [18, 19, 20]. In this process, modest increases in annual plant nutrient loadings, particularly TP, are adequate to drive increases of in situ methylation with existing low inorganic mercury concentrations in water or sediment to produce sufficient amounts of very bioaccumulative methylmercury. A key diagnostic parameter for eutrophication stress in such situations is elevated mercury levels in sport fish.
Hence, an important first step for ecosystem assessment is to assess fish tissue concentrations for chemicals such as methylmercury, to quantify local patterns of risk to consumers of fish within traditional fisheries. The next important step is to reduce local anthropogenic sources of increased nutrient loading into watersheds. This approach is justified, as diets with a focus on country foods such as subsistence fisheries can have high proportions of food types with elevated mercury residues compared with consumers that do not regularly consume country foods.
1.4 Study design
Due to the paucity of recent fish contaminant monitoring information available within Michipicoten First Nation (MFN) territory, a study was recently completed [26]. The report documented verified observations from fish monitoring studies in MFN traditional territory. The habitats studied included primarily forested watersheds with seasonal cottages, roads, and/or campgrounds, a watershed with established large-scale metal mine, and a large river with upstream dams, as:
Traditional fisheries in Dog Lake, Missinaibi Lake, Wawa Lake, and Michipicoten River; and
Limited traditional fisheries in Nemegosenda Lake, downstream of Borden Gold Mine (mine opened in 2018, within Borden Lake/River watershed).
Fish species sampled for monitoring from these five habitats include Walleye (Sander vitreus), Northern Pike (Esox lucius), Lake Trout (Salvelinus namaycush), Burbot (Lota lota), Lake Whitefish (Coregonus clupeaformis), White Sucker (Catostomus commersoni), Longnose Sucker (Catostomus catostomus), and introduced Smallmouth Bass (Micropterus dolomieu). This suite of fish species represents predators that primarily consume fish, like Walleye, Northern Pike, and Burbot, species that consume fish and invertebrates, such as Lake Trout and Smallmouth Bass, and species that primarily consume plants and detritus, such as Lake Whitefish, White Sucker, and Longnose Sucker. Analysis of different fish species in lakes and rivers should identify any habitat-specific and/or species-specific patterns in fish methylmercury tissue concentrations.
1.5 Contaminants of concern
During 2019 and 2020, Staff from the Ontario Ministry of Environment, Conservation, and Parks (MECP) confirmed with MFN that routine fish tissue monitoring includes the following COCs: the metalloids arsenic and selenium, along with the metals: aluminum, cadmium, chromium, cobalt, copper, iron, lead, magnesium, manganese, molybdenum, nickel, tin, and zinc. Of this suite of COCs, mercury was identified as the primary COC for human health stemming from fish tissue consumption in recreational and subsistence fisheries. Thus, the focus of the analyses in this chapter concerns methylmercury. In northern Ontario, both metallic mercury (Hg) and organic methylmercury were historically low in oligotrophic waters across the Lake Superior watershed until the early 1980s [3, 4, 5]. During this historic period before the early 1980s, fish tissue concentrations across species and habitats were usually ≤0.06 μg/g WW. However, concentrations of methylmercury were observed to increase during recent decades, representing an identified risk to regular consumers of fish tissue at >0.06 μg/g WW [4, 5].
This study proposed to collect fish specimens from areas across MFN traditional territories and carry out fish tissue methylmercury analyses. In addition, the study proposed to search for other studies with verifiable fish tissue methylmercury analyses, completed since 2009, from other private and public sources. This cut-off date was used due to recent advances in analytical measurement of contaminants such as Hg in fish tissues. The private sources included the proponents at mines as well as selected MECP monitoring datasets. The study objectives were as follows:
to document past studies of fish in MFN territory, to better establish baseline records for COCs, such as methylmercury in fish tissues;
to compare the concentrations of COCs from these fish species to available recent data sets (last 10–15 years) from private and public sources;
to update the consumption guidelines for fishes in these habitats, and to share these findings with MFN residents and other stakeholders.
These biomonitoring study objectives were intended to achieve enhanced environmental management of fishes of importance to MFN within their traditional territory.
The study was conducted from 2019 to 2022. It involved members of MFN as well as representatives from government departments of Canada and Ontario, along with representatives from private companies. From 2019 until late 2020, the MFN effort was led by Aaron Bumstead, Director of Lands and Economic Development. For 2021 and 2022, the MFN effort was led by Steven Murphy, Manager of Lands and Environmental Stewardship.
During this effort, traditional knowledge on fishing from MFN residents was collected by Mr. Bumstead, Mr. Murphy, and Dr. Fitzgerald. Information on fish harvest, fishing locations, and other details were also collated.
In addition, various MFN residents participated in fish collections for Northern Pike with this effort led by MFN Elder Paul Jaques. During the summer of 2020, only a small number of specimens were collected due to disruptions associated with the COVID-19 pandemic. Specimens were processed in the field, placed on ice and in bags, and then transported to secure freezers at MFN, awaiting analysis. In 2021, fishing was more extensive across select habitats, with specimens again processed in the field, placed on ice and in bags, and then transported to freezers at MFN. Habitats considered in this study are listed in Table 1 and include Dog Lake, Michipicoten River, Missinaibi Lake, Nemegosenda Lake, and Wawa Lake. The types of known disturbance for each habitat is also listed in Table 1. Fish species considered in this study across the habitats are listed in Table 2 and Figure 1.
Habitat name
Source of samples
Description of types of disturbance
Dog Lake
MFN, Ontario
Traditional MFN fishery, campground, cottages, roads
Michipicoten River
Ontario
Traditional MFN fishery, cottages, upstream dams, roads
Missinaibi Lake
Ontario
Traditional MFN fishery, campground, cottages, roads
Nemegosenda Lake
Ontario, private
Cottages, roads, upstream dam, receives water via Borden River, downstream of Borden Mine
Wawa Lake
Ontario
Traditional MFN fishery, cottages, Town of Wawa, roads
Table 1.
Habitats where fish samples were assessed for this study.
Source of samples as either MFN, Ontario, or private company.
Habitat name
Fish species assessed in monitoring studies
Northern Pike
Walleye
Lake Trout
Smallmouth Bass
Burbot
Lake Whitefish
Longnose Sucker
Dog Lake
X
X
X
X
X
X
X
Michipicoten River
X
X
X
X
X
Missinaibi Lake
X
X
X
X
Nemegosenda Lake
X
X
X
X
Wawa Lake
X
X
Table 2.
Summary of habitats and resident fish species assessed in this study.
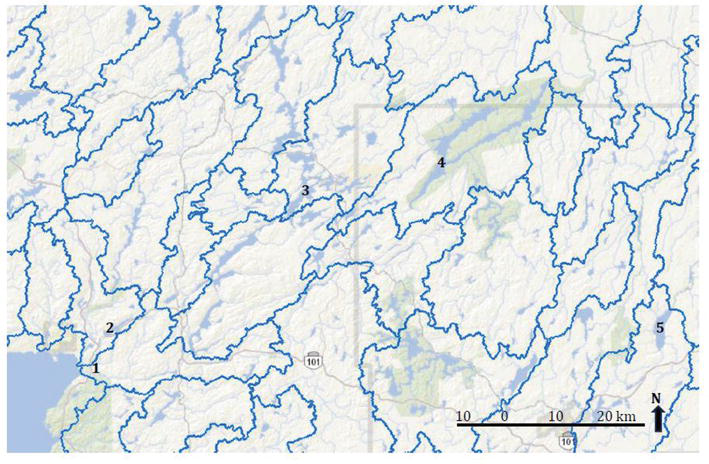
Figure 1.
Map of northern Ontario watershed boundaries (blue lines) with habitats under study identified. These habitats include: 1. Michipicoten River, 2. Wawa Lake, 3. Dog Lake, 4. Missinaibi Lake, and 5. Nemegosenda Lake. (Source of base map polygon: Ontario Watershed Boundaries).
2.2 Fish sample processing
In the autumn 2021, Dr. Mary-Claire Buell of Collective Environmental Consulting (CEC) trained MFN residents for fish processing, and then supervised fish processing of frozen specimens by community members in Wawa, ON. She also arranged delivery of the processed fish samples to an accredited laboratory (SGS Laboratories, Lakefield, ON, Canada, KOL 2HO) for measurement of COCs in fish tissues. Fish processing options were limited at this time due to the disruptions caused by the COVID-19 pandemic.
All fish muscle tissue samples were processed by SGS Laboratories for a number of COCs: total mercury, arsenic, lead, aluminum, cadmium, chromium, cobalt, copper, iron, magnesium, manganese, molybdenum, nickel, selenium, tin, and zinc. The raw data, along with initial data processing (i.e., conversion to wet weight), were provided to MFN by CEC in February, 2022.
2.3 Statistical analyses
Concentrations of chemical substances in fish muscle tissues were provided to MFN by CEC, or obtained directly from the Ontario monitoring database, or from technical reports provided by private sources (e.g., mines). For these studies, the analytical results were verified as valid before analysis. Following verification, these results were transcribed to spreadsheets followed by statistical analysis including mean, standard deviation, and range. As most sample sizes for the fishes under study were small (<30 specimens), simple Model-1 linear regression was selected to quantify the relationships of mercury in fish tissues and fish length. Such small sample sizes for fish in the habitats under study were common across the Ontario and private data sets, as a goal of routine monitoring is for this effort to not modify the population under study and to avoid over-fishing over the monitoring period.
Availability of at least three sample years for Northern Pike within Dog Lake and Missinaibi Lake with reasonable sample sizes (often ≥10) allows for the opportunity to compare mercury tissue concentration relationship with fish length over time. The Analysis of Covariance (ANCOVA) was used to quantify how mercury tissue concentration changed over time with fish length as a covariate. The significance of the ANCOVA was interpreted at the probability value of α = 0.05. In contrast, the analyses of regressions were considered significant if the R2 (explanation of fit of regression to the data) was equal to or exceeded 0.5. This use of R2 to assess the significance of the regression is due to the small sample sizes under study that do not justify detailed statistical analyses [27, 28].
At meetings completed between 2018 and 2021, MFN residents identified general fishing preferences for habitats around Wawa, Chapleau, and White River including preferred fish target species, typical fishing methods, and seasonal considerations. MFN residents also communicated that they fish for different species across habitats coinciding with seasonal movement of fishes noting safe periods to complete these activities. Fishing activities include ice fishing in winter with hook and line as well as with gillnets under the ice, and hook and line and gillnets during spring, summer, and autumn. Some fishing also uses fish traps in large lakes and rivers, to allow for undesirable fishes to be released alive.
The residents readily identified Northern Pike and Walleye as the two primary species harvested and captured across the entire calendar year. Other residents identified Lake Trout and Lake Whitefish as the species they usually target in autumn. Other species fished and generally regarded as less popular included: White Sucker, Longnose Sucker, Yellow Perch (Perca flavescens), Smallmouth Bass, and Burbot. Some MFN residents noted that Smallmouth Bass were stocked across MFN territory by Ontario during the early 1900s. Stocking of Smallmouth Bass was often in habitats with limited or no sport fishing opportunities while sometimes included lakes with Lake Trout and/or Walleye populations. A summary of fish captured across habitats, fishing gear, and seasons is presented in Table 3.
Fish species
Habitat fishes
Preferred season
Northern Pike
Lakes, rivers, creeks
All seasons
Walleye
Lake, rivers
All seasons
Lake Trout
Lakes
Spring, autumn, winter
Burbot
Lakes
Autumn, winter
Lake Whitefish
Lakes
Spring, autumn, winter
White Sucker
Lakes, rivers
Spring, autumn
Longnose Sucker
Lakes, rivers
Spring, autumn
Smallmouth Bass
Lakes, rivers, creeks
Summer, autumn
Table 3.
Overview of fish species harvested by MFN residents across habitats and the preferred season of harvest.
The common fishing methods by habitat and species as reported.
3.2 Available information from fish monitoring studies
3.2.1 Northern Pike
3.2.1.1 Morphology of Northern Pike samples collected by MFN in Dog Lake
Northern Pike samples were assessed for tissue body residues collected by MFN during 2021 from Dog Lake had a mean total length of 49.8 cm (range: 34.7–77.1 cm; SD = 10.97; n = 22) and mean total weight of 851 g (255–3121; 726; 22). Sex of the specimens was not recorded. A number of specimens were observed to have external sores, external parasites, fin damage, and other evidence of stress. All fish had small external sores with approximately 10–15% with the presence of external parasites and fin damage. Some specimens had healed sores suggesting past encounters with fish-eating birds or fish-eating wildlife; some had evidence of open sores and healed sores with some likely caused during capture. However, no specimens demonstrated major skeletal deformities such as scoliosis or external tumors. This information from MFN for Northern Pike was combined with data sets identified from other sources (Ontario, private companies), to examine patterns across habitats.
3.3 Comparison of fish species across habitats
3.3.1 Northern Pike
Estimates of mercury tissue concentrations in Northern Pike are reported for Dog Lake, Missinaibi Lake, Nemegosenda Lake, and Michipicoten River (Table 4). For Northern Pike sampled in Dog Lake, the 2011 mean mercury tissue concentration was 0.62 μg/g WW with a range of 0.12 μg/g WW for a 33.3 cm specimen to 1.70 μg/g WW for a 74.5 cm specimen. For the 2016 sample from Dog Lake, the mean mercury tissue concentration was 0.44 μg/g WW with a range of 0.11 μg/g WW for a 39.7 cm specimen to 0.81 μg/g WW for a 68.5 cm specimen. For the 2021 sample from Dog Lake, the mean mercury tissue concentration was 0.30 μg/g WW with a range of 0.11 μg/g WW for a 36.8 cm specimen to 0.98 μg/g WW for a 77.1 cm specimen.
Habitat
Northern Pike year of sample: mean mercury tissue Concentrations (μg/g WW) for male and female fish or range
Comparison of the mercury tissue concentrations for Northern Pike dorsal muscle flesh in male and female fish, available across years in Dog Lake, Missinaibi Lake, Nemegosenda Lake, and Michipicoten River.
NF: no male fish captured.
For Missinaibi Lake, the 2009 mean mercury tissue concentration was 1.14 μg/g WW with a range of 0.25 μg/g WW for a 41.5 cm specimen to 2.5 μg/g WW for an 87.3 cm specimen. For the 2011 sample from Missinaibi Lake, the mean mercury concentration was 0.89 μg/g WW with a range of 0.24 μg/g WW for a 46.8 cm specimen to 2.2 μg/g WW for a 71.4 cm specimen. For the 2016 sample from Missinaibi Lake, the mean mercury concentration was 0.94 μg/g WW with a range of 0.39 μg/g WW for a 55.6 cm specimen to 1.7 μg/g WW for an 84.9 cm specimen.
For the 2015 sample from Nemegosenda Lake, the mean mercury concentration was 1.14 μg/g WW with a range of 0.88 μg/g WW for a 52.6 cm specimen to 1.6 μg/g WW for a 94.2 cm specimen. For the Michipicoten River, the 2018 mean mercury tissue concentration was 0.26 μg/g WW with a range of 0.24 μg/g WW for a 56.5 cm specimen to 0.3 μg/g WW for a 60.5 cm specimen.
These observations for Northern Pike indicated the mercury tissue concentration in male and female specimens were similar within Michipicoten River and variable between sexes for Dog Lake, Missinaibi Lake, and Nemegosenda Lake.
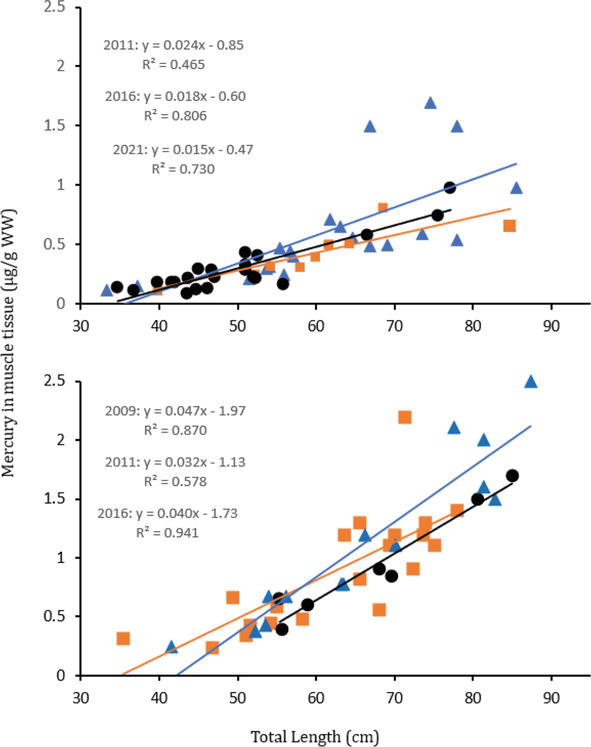
The relationship between mercury tissue concentration and length for Northern Pike based on the observations for specimens from the Dog Lake and Missinaibi Lake are presented in Figure 2. These Northern Pike show linear relationships between mercury muscle tissue concentration and total length:
Dog Lake 2009: Y = 0.24–0.85; R2 = 0.465;
Dog Lake, 2016: Y = 0.018x − 0.60, R2 = 0.806;
Dog Lake 2021: Y = 0.015–0.47, R2 = 0.730;
Missinaibi Lake 2009: Y = 0.047x − 1.97, R2 = 0.870;
Missinaibi Lake 2011: Y = 0.032x – 1.13, R2 = 0.578; and
Missinaibi Lake 2016: Y = 0.040x – 1.73, R2 = 0.941.
Figure 2.
Upper panel: the relationship between total length and mercury in muscle tissue for Northern Pike sampled within Dog Lake during 2011 (), 2018 () and 2021 (). The lower panel is similar except for the Northern Pike sampled from Missinaibi Lake in 2009 (), 2011 (), and 2016 (). For the Northern Pike in Dog Lake, the methylmercury fish tissue concentration in muscle equals ∼0.06 μg/g WW (Ontario recommendation for sensitive population wishing to consume 32–16 meals per month) is near 30 cm and 0.5 μg/g (Ontario “do not eat” recommendation for sensitive populations) occurs with fish lengths near 50 cm. For Northern Pike in Missinaibi Lake, fish tissue concentration in muscle equals ∼0.06 μg/g WW (Ontario recommendation for sensitive population wishing to consume 32–16 meals per month) near 35 cm and 0.5 μg/g (Ontario “do not eat” recommendation for sensitive populations) occurs with fish lengths near 55 cm.
The exception to the observation of linear relationships was in the 2009 Northern Pike sample from Dog Lake (i.e., Y = 0.24–0.85; R2 = 0.465). Two fish with a total length of 66.8 cm had mercury tissue concentrations of 0.49 and 1.5 μg/g WW whereas two other fish with a total length of 77.9 cm had mercury tissue concentrations of 0.54 and 1.5 μg/g WW. The disparity in the observed mercury tissue concentrations in these four specimens represents natural variability in the samples and is why the relationship does not appear to be linear. For the other five samples from Dog Lake and Missinaibi Lake, the observations for Northern Pike mercury tissue concentrations support the hypothesis that the tissue concentration increases with age, as represented by the length of the specimen. Thus, the Northern Pike total length represents a reasonable surrogate for expected mercury tissue concentration.
The Dog Lake samples from 2011, 2016, and 2021 (Figure 2) compared by ANCOVA, included homogeneous slopes and confirmed the comparison was valid. Then the ANCOVA was identified as non-significant (F2,48 = 1.602, P = 0.212). This comparison indicates the mean mercury tissue concentrations did not differ significantly over the 3 years. For the Missinaibi Lake samples from 2009, 2011, and 2016 compared by ANCOVA, the slopes were homogeneous and confirmed the comparison was valid. Then the ANCOVA was found to be non-significant (F2,37 = 1.619, P = 0.212). These results indicate the methylmercury: total length relationship remained similar across the 3 sample years for both lakes during the study period.
3.3.2 Walleye
Estimates of mercury tissue concentrations in Walleye are reported for Dog Lake, Missinaibi Lake, Michipicoten River, Nemegosenda Lake, and Wawa Lake (Table 5). For Walleye sampled in Dog Lake, the 2011 mean mercury tissue concentration was 0.56 μg/g WW with a range of 0.24 μg/g WW for a 38.8 cm specimen to 1.80 μg/g WW for a 71.4 cm specimen. For the 2016 sample from Dog Lake, the mean mercury tissue concentration was 0.70 μg/g WW with a range of 0.23 μg/g WW for a 36 cm specimen to 1.7 μg/g WW for a 60.5 cm specimen.
Habitat
Walleye year of sample: mean mercury tissue concentrations from muscle flesh (μg/g WW) for male and female fish
Dog Lake
2011: 0.56 (0.47, 0.67)
2016: 0.70 (0.98, 0.65)
Missinaibi Lake
2011: 1.24 (0.65, 1.62)
2016: 1.41 (1.37, 1.44)
Michipicoten River
2017: 0.98 (0.97, 1.0)
Nemegosenda Lake
2010: 0.79 (0.69, 0.94)
2015: 1.96 (1.3, 2.18)
Wawa Lake
2012: 0.36 (0.18, 0.44)
2017: 0.70 (0.64, 0.84)
Table 5.
Comparison of the mercury tissue concentrations for Walleye dorsal muscle flesh in male and female fish, available across years in Dog Lake, Missinaibi Lake, Nemegosenda Lake, Wawa Lake, and Michipicoten River.
For Missinaibi Lake, the 2011 mean mercury tissue concentration was 1.24 μg/g WW with a range of 0.35 μg/g WW for a 30 cm specimen to 5.1 μg/g WW for a 75 cm specimen. For the 2016 sample from Missinaibi Lake, the mean mercury concentration was 1.41 μg/g WW with a range of 1.0 μg/g WW for a 31.6 cm specimen to 2.1 μg/g WW for a 71.6 cm specimen. For the Michipicoten River, the 2017 mean mercury tissue concentration was 0.98 μg/g WW with a range of 0.27 μg/g WW for a 35.3 cm specimen to 1.40 μg/g WW for a 44.8 cm specimen.
Nemegosenda Lake, the 2010 mean mercury tissue concentration was 0.79 μg/g WW with a range of 0.45 μg/g WW for a 32.2 cm specimen to 1.40 μg/g WW for a 45.4 cm specimen. For the 2015 sample from Nemegosenda Lake, the 2012 mean mercury tissue concentration was 1.96 μg/g WW with a range of 0.89 μg/g WW for a 36.6 cm specimen to 2.90 μg/g WW for a 55.8 cm specimen. For Wawa Lake, the 2012 mean mercury tissue concentration was 0.36 μg/g WW with a range of 0.10 μg/g WW for a 20.9 cm specimen to 0.99 μg/g WW for a 66.3 cm specimen. For the 2017 sample from Wawa Lake, the mean mercury tissue concentration was 0.70 μg/g WW with a range of 0.45 μg/g WW for a 53 cm specimen to 0.89 μg/g WW for a 63.4 cm specimen.
The above observations for Walleye indicate that mercury tissue concentrations in male and female specimens were generally similar within Michipicoten River and variable for Dog Lake, Missinaibi Lake, Nemegosenda Lake, and Wawa Lake.
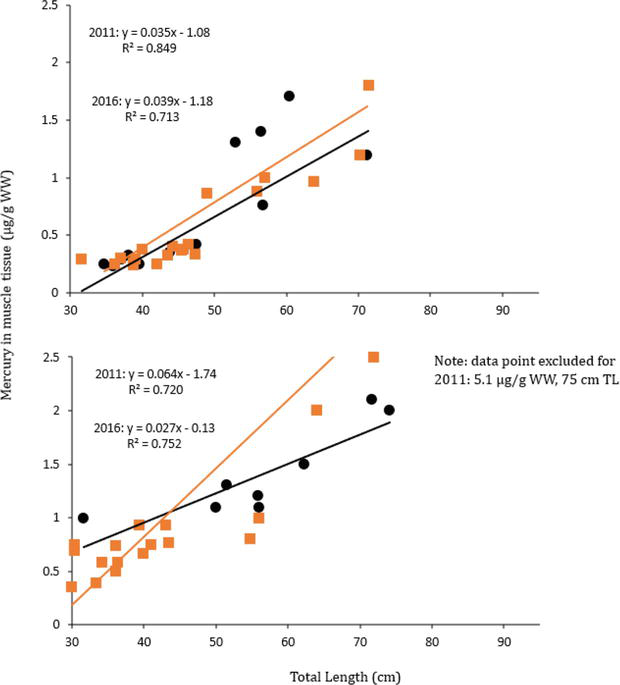
The relationship between mercury tissue concentration and length for Walleye, for specimens from 2011 and 2016 samples from Dog Lake and Missinaibi Lake are presented in Figure 3. These Walleye all show linear relationships between mercury muscle tissue concentration and total length for Dog Lake (2011: Y = 0.035x − 1.08, R2 = 0.849; 2016: Y = 0.039–1.18, R2 = 0.713) and Missinaibi Lake (2011: Y = 0.064x − 1.74, R2 = 0.720; 2016: Y = 0.027x − 0.13, R2 = 0.752).
Figure 3.
Upper panel: the relationship between total length and mercury in muscle tissue for Walleye sampled within Dog Lake during 2011 () and 2016 (). The lower panel is similar except for Walleye sampled from Missinaibi Lake during 2011 (), and 2016 (). One data point was excluded from the Missinaibi Lake sample from 2011 for a 75 cm specimen with 5.1 μg/g WW mercury in tissue. For the Walleye in Dog Lake, the methylmercury fish tissue concentration in muscle equals ∼0.06 μg/g WW (Ontario recommendation for sensitive population wishing to consume 32–16 meals per month) is near 35 cm and 0.5 μg/g (Ontario “do not eat” recommendation for sensitive populations) occurs with fish lengths near 55 cm. For Walleye in Missinaibi Lake, fish tissue concentration in muscle equals ∼0.06 μg/g WW (Ontario recommendation for sensitive population wishing to consume 32–16 meals per month) near 25 cm and 0.5 μg/g (Ontario “do not eat” recommendation for sensitive populations) occurs with fish lengths near 35 cm.
These observations for Walleye indicate mercury tissue concentration follows the hypothesis that the tissue concentration increases with age, as represented by the length of the specimen. Thus, Walleye total length is a reasonable surrogate for expected mercury tissue concentration.
3.3.3 Lake Trout
Estimates of mercury tissue concentrations in Lake Trout are reported for Dog Lake, Missinaibi Lake, Nemegosenda Lake, and Wawa Lake (Table 6). For Lake Trout sampled in Dog Lake, the 2011 mean mercury tissue concentration was 0.49 μg/g WW with a range of 0.16 μg/g WW for a 34 cm specimen to 1.50 μg/g WW for a 92 cm specimen. For the 2016 sample from Dog Lake, the mean mercury tissue concentration was 0.88 μg/g WW with a range of 0.43 μg/g WW for a 56.6 cm specimen to 1.8 μg/g WW for an 83.6 cm specimen.
Habitat
Lake trout year of sample: mean mercury tissue concentrations from muscle flesh (μg/g WW) for male and female fish or range
Dog Lake
2011: 0.49 (0.59, 0.43)
2016: 0.88 (1.11, 0.75)
Missinaibi Lake
2011: 0.63 (0.55, 0.69)
2016: 0.94 (0.60, 1.02)
Nemegosenda Lake
2010: 1.23 (1.13, 1.3)
2015: 1.62 (1.47, 1.62)
Wawa Lake
2012: 0.40 (0.39, 0.41)
2017: 0.42 (0.42, 0.43)
Table 6.
Comparison of the mercury tissue concentrations for Lake Trout dorsal muscle flesh in male and female fish, available across years in Dog Lake, Missinaibi Lake, Nemegosenda Lake, and Wawa Lake.
For Missinaibi Lake, the 2011 mean mercury tissue concentration was 0.63 μg/g WW with a range of 0.32 μg/g WW for a 33.8 cm specimen to 1.4 μg/g WW for a 90.4 cm specimen. For the 2016 sample from Missinaibi Lake, the mean mercury concentration was 0.94 μg/g WW with a range of 0.60 μg/g WW for a 64.9 cm specimen to 1.7 μg/g WW for a 75.8 cm specimen.
For Nemegosenda Lake, the 2010 mean mercury tissue concentration was 1.23 μg/g WW with a range of 0.96 μg/g WW for a 53 cm specimen to 1.60 μg/g WW for a 63.5 cm specimen. For the 2015 sample from Nemegosenda Lake, the mean mercury tissue concentration was 1.62 μg/g WW with a range of 1.20 μg/g WW for a 63.6 cm specimen to 2.10 μg/g WW for a 72.6 cm specimen. For Wawa Lake, the 2012 mean mercury tissue concentration was 0.40 μg/g WW with a range of 0.19 μg/g WW for a 21.5 cm specimen to 0.91 μg/g WW for a 78.1 cm specimen. For the 2017 sample from Wawa Lake, the mean mercury tissue concentration was 0.42 μg/g WW with a range of 0.18 μg/g WW for a 32.7 cm specimen to 0.87 μg/g WW for a 76.5 cm specimen.
The above observations for Lake Trout indicate the mercury tissue concentration in male and female specimens was generally similar in Nemegosenda Lake and Wawa Lake and sometimes different for Dog Lake and Missinaibi Lake.
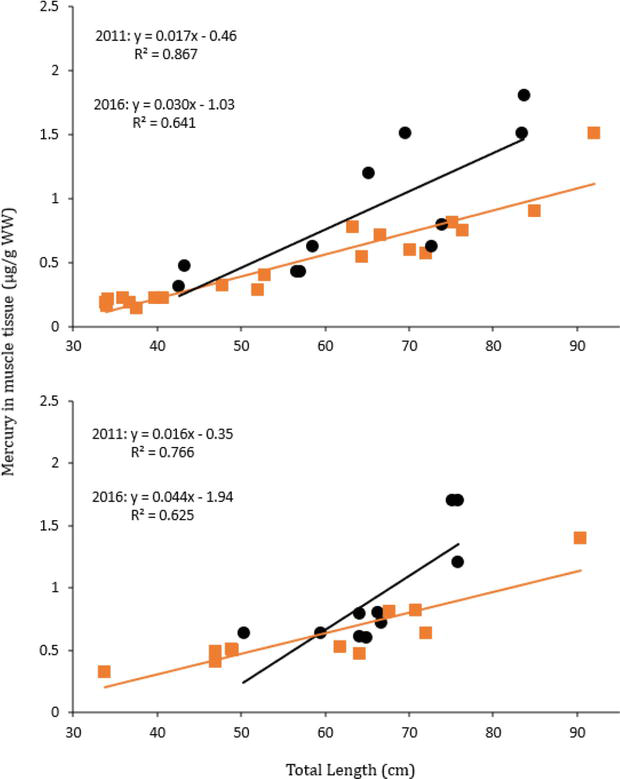
The relationship between mercury tissue concentration and length of Lake Trout for specimens from 2011 and 2016 samples from Dog Lake and Missinaibi Lake are presented in Figure 4. These Lake Trout all show linear relationships between mercury muscle tissue concentration and total length for Dog Lake (2011: Y = 0.017x − 0.046, R2 = 0.867; 2016: Y = 0.030–1.03, R2 = 0.641) and Missinaibi Lake (2011: Y = 0.16x − 0.35, R2 = 0.767; 2016: Y = 0.044x − 1.94, R2 = 0.625).
Figure 4.
Upper panel: relationship between total length and mercury in muscle tissue for Lake Trout sampled within Dog Lake during 2011 () and 2016 (). Lower panel is similar except for Lake Trout sampled from Missinaibi Lake during 2011 (), and 2016 (). For the Lake Trout in Dog Lake, the methylmercury fish tissue concentration in muscle equals ∼0.06 μg/g WW (Ontario recommendation for sensitive population wishing to consume 32–16 meals per month) is near 35 cm and 0.5 μg/g (Ontario “do not eat” recommendation for sensitive populations) occurs with fish lengths near 60 cm. For the Lake Trout in Missinaibi Lake, fish tissue concentration in muscle equals ∼0.06 μg/g WW (Ontario recommendation for sensitive population wishing to consume 32–16 meals per month) near 30 cm and 0.5 μg/g (Ontario “do not eat” recommendation for sensitive populations) occurs with fish lengths near 55 cm.
The above observations for Lake Trout indicated mercury tissue concentration follows the hypothesis that the tissue concentration increases with age, as represented by the length of the specimen. Thus, Lake Trout total length is a reasonable surrogate for expected mercury tissue concentration.
3.3.4 Smallmouth Bass
Estimates of mercury tissue concentrations in Smallmouth Bass are reported for Dog Lake, Missinaibi Lake, Nemegosenda Lake, and Michipicoten River (Table 7). For Smallmouth Bass sampled in 2016 in Dog Lake, the mean mercury tissue concentration was 0.40 μg/g WW with a range of 0.25 μg/g WW for a 37.6 cm specimen to 0.7 μg/g WW for a 43.6 cm specimen.
Habitat
Smallmouth Bass year of sample: mean mercury tissue concentrations from muscle flesh (μg/g WW) for male and female fish or range
Comparison of the mercury tissue concentrations for Smallmouth Bass dorsal muscle flesh in male and female fish, available across years in Dog Lake, Missinaibi Lake, Nemegosenda Lake, and Michipicoten River.
A total of three specimens for these habitats.
For the 2016 sample from Missinaibi Lake, the mean mercury tissue concentration was 0.57 μg/g WW with a range of 0.43 μg/g WW for a 36.2 cm specimen to 0.65 μg/g WW for a 39 cm specimen representing three females.
For the 2015 sample from Nemegosenda Lake, the mean mercury tissue concentration was 0.60 μg/g WW with a range of 0.55 μg/g WW for a 48.1 cm specimen to 0.63 μg/g WW for a 34.5 cm specimen representing three females.
For the 2017 sample from the Michipicoten River, the mean mercury tissue concentration was 0.29 μg/g WW with a range of 0.17 μg/g WW for a 28.7 cm specimen to 0.48 μg/g WW for a 36.9 cm.
These observations for Smallmouth Bass indicate mercury tissue concentrations follow the hypothesis that the tissue concentration increases with age, as represented by the length of the specimen. Thus, Smallmouth Bass total length is a reasonable surrogate for expected mercury tissue concentration.
3.3.5 Burbot
Estimates of mercury tissue concentrations in Burbot are reported for Dog Lake and Missinaibi Lake (Table 8). For Dog Lake, Burbot sampled during 2016 had a mean mercury tissue concentration of 0.43 μg/g WW with a range of 0.32 μg/g WW for a 40 cm specimen to 0.52 μg/g WW for a 58.5 cm specimen.
Habitat
Burbot mean mercury tissue concentrations from muscle flesh (μg/g WW) for male and female fish
Dog Lake
2016: 0.43 (0.51, 0.40)
Missinaibi Lake
2009: 0.78 (0.70, 0.82)
Table 8.
Comparison of the mercury tissue concentrations for Burbot dorsal muscle flesh in male and female fish, available across years in Dog Lake and Missinaibi Lake.
For the 2009 sample from Missinaibi Lake, the mean mercury tissue concentration was 0.78 μg/g WW with a range of 0.37 μg/g WW for a 40.8 cm specimen to 1.2 μg/g WW for a 73 cm specimen. These observations indicate the mercury tissue concentration in male and female specimens was generally similar in Dog Lake and Missinaibi Lake.
These observations for Burbot indicate the mercury tissue concentration follows the hypothesis that the tissue concentration increases with age, as represented by the length of the specimen. Thus, Burbot total length represents a reasonable surrogate for expected mercury tissue concentration.
3.3.6 Lake Whitefish, Common Sucker, and Longnose Sucker
Estimates of mercury muscle tissue concentrations for Lake Whitefish, White Sucker, and Longnose Sucker are reported for Dog Lake and Michipicoten River (Table 9). For Lake Whitefish sampled in 2016 from Dog Lake, the mean mercury muscle concentration was 0.15 μg/g WW with a range of 0.1 μg/g for a 38 cm specimen to 0.19 μg/g WW for a 50.4 cm specimen. For White Sucker in 2016 from Dog Lake, the mean mercury concentration was 0.18 μg/g WW with a range of 0.07 μg/g WW for a 49.4 cm specimen to 0.34 μg/g WW for a 46.2 cm specimen.
Habitat
Mean mercury tissue concentrations from muscle flesh (μg/g WW) for male and female fish
Comparison of the mercury tissue concentrations for Lake Whitefish, White Sucker, and Longnose Sucker dorsal muscle flesh in male and female fish, available across years in Dog Lake and Michipicoten River.
Sample based on two specimens; NF: no female fish sampled.
The 2017 White Sucker from Michipicoten River had a mean of 0.22 μg/g WW with a range of 0.22 μg/g WW for a 45.6 cm specimen to 0.23 μg/g WW using a sample of n = 2 males. For Longnose Sucker sampled in 2016 from Dog Lake, the mean mercury tissue concentration was 0.26 μg/g WW with a range of 0.11 μg/g WW for a 53.4 cm specimen to 0.39 μg/g WW for a 55.4 cm specimen.
The 2018 Longnose Sucker from Michipicoten River had a mean mercury tissue concentration of 0.18 μg/g WW with a range of 0.06 μg/g WW for a 38.4 cm specimen to 0.36 μg/g WW for a 41.8 cm specimen. For all three benthic species, the male and female mercury tissue concentrations were generally similar (Table 9).
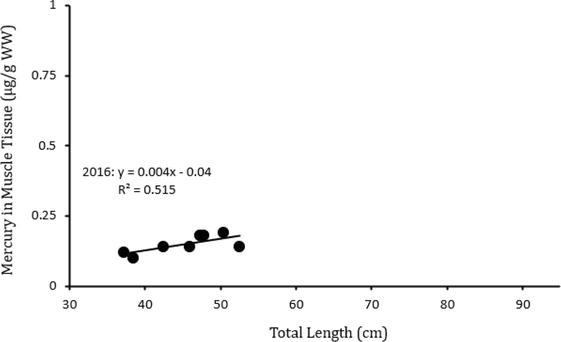
For these three fish species, the Dog Lake mean mercury muscle concentrations were consistently higher than samples sampled from the Michipicoten River. In addition, for Lake Whitefish, White Sucker, and Longnose Sucker, these observations indicate the mercury tissue concentration follows the hypothesis that the tissue concentration increases with age, as represented by larger lengths of the specimens. For all three species, total length appears to be an adequate surrogate for expected mercury tissue concentration. Also, for these three species, the mercury concentrations increased with length but more gradually compared with piscivores like Northern Pike, Walleye, and Burbot. This more gradual increase in mercury muscle tissue concentrations in the benthic species is attributed to their diet with greater proportions of plant material and invertebrates with lower mercury concentrations compared with diets composed of other fishes containing higher mercury concentrations. As can be seen in Figure 5, with for Lake Whitefish from Dog Lake exhibits a linear relationship between mercury muscle tissue concentration and total length (Y = 0.004x − 0.04, R2 = 0.515).
Figure 5.
Relationship between total length and mercury in muscle tissue for Lake Whitefish sampled within Dog Lake during 2016 (). For these Lake Whitefish in Dog Lake, the methylmercury fish tissue concentration in muscle equals ∼0.06 μg/g WW (Ontario recommendation for sensitive population wishing to consume 32–16 meals per month) is near 35 cm and 0.5 μg/g (Ontario “do not eat” recommendation for sensitive populations) occurs with fish lengths beyond 90 cm (i.e., beyond length distribution in sample).
3.4 Comparison of findings for recent fish monitoring with current Ontario online consumption guidelines
Inspection of fish length:mercury relationships in MFN territory reported herein led to the observation that the Ontario online consumption guide generally reflects fish length when ∼0.06 μg/g WW is first evident in the tissue monitoring data. For this analysis, the length (+5 cm) at ∼0.06 μg/g WW was estimated from the Model-1 length:mercury regression relationships for fish from the habitats under study. Also, the length for initial consumption restriction from the Ontario online guide for each species was identified and both sets of information were compared. This comparison revealed that, for most species, when mercury tissue residue observations are available, the online consumption guidelines frequently started near or at the length where mercury tissue monitoring data concentrations were ∼0.06 μg/g WW.
Available historical public and private studies of fish in MFN territory were assessed. For each study, the data was verified as validated before this assessment. This verification and validation process resulted in the identification of data sets often not readily available in the public domain. As a complement to this survey of past studies, fish sample collections were also completed by MFN in 2021, and resulted in the independent estimate of current concentrations of COCs including mercury in Northern Pike from Dog Lake and other habitats.
The 2021 data collected by MFN also confirmed that only mercury consistently exceeded human health consumption guides while other chemicals such as metals and metalloids were usually present at concentrations in tissue considered to be of low risk to fish consumers; these findings were consistent with information reported in 2020 by MECP. Before these studies, the information available to MFN residents via public sources was considered out-of-date with the community’s perception that these consumption guidelines were not useful.
The analyses herein also identified a spatial pattern of increased mercury concentrations in all habitats across watersheds with larger and older fishes across seven species, and this suggests a regional process is shaping increases in mercury concentrations. These results collectively indicate the older (and larger) the fish, the higher mercury tissue concentration.
The identification of higher concentrations over time can be partially interpreted for this study to also represent the presence of smaller and younger fish in the more recent samples for some habitats compared with larger and older specimens assessed in the earlier samples. This time series pattern of smaller fish captured during the most recent sample collections may reflect the presence of over-fishing in some habitats as well as the confounding effect of excessive sample collections in monitoring programs.
Where monitoring data is available, larger and older fish in a habitat consistently have higher mercury concentrations compared with smaller specimens. This pattern was consistent for fish species that primarily eat other fish, such as Northern Pike, Walleye, Burbot, and Lake Trout. Species with mixed diets like Smallmouth Bass also demonstrated elevated mercury tissue content, likely reflecting the pattern of larger bass showing a diet preference for other fish while small bass often consume predominantly invertebrates; an interesting facet for Smallmouth Bass is they do not appear to have achieved large population sizes since introductions in the early 1900s in these northern habitats [29]. In contrast, species that consume mud, plants, and invertebrates such as Lake Whitefish, Common White Sucker, and Longnose sucker demonstrated lower mercury tissue concentrations.
This assessment, for the last 15 or so years, identified that mercury concentrations were reported as higher during past years compared with more recent years. Similar results were reported previously for species such as Northern Pike, Walleye, and Lake Trout mercury concentrations with increased mercury concentrations of >20% from 1985 to 2005 [4, 5].
With these general findings, no matter the cause of the smaller fish lengths during recent years, a regional pattern is evident represented by the presence of a mercury: body length relationship where mercury consistently increases over time in lakes and rivers. This study generated evidence of this pattern from seven species where monitoring information was available. Hence, mercury accumulation is largely a species-independent pattern across MFN territory with higher concentrations in predatory fishes such as Northern Pike, Walleye, Burbot, and Lake Trout with lower concentrations in benthic species such as Lake Whitefish, White Sucker, and Longnose Sucker. The observations also revealed intermediate mercury levels for smaller Smallmouth Bass with elevated concentrations in larger Smallmouth Bass that likely consume other fish. Thus, local sources of disturbances in combination with regional processes are likely acting together, leading to the observed increase in mercury in all fish, with implications for human and wildlife consumption of fish.
Water mercury concentrations are not a key metric to track changes in mercury content in freshwater lakes and rivers, as the key driver of the rate of methylation of mercury is increased plant nutrient loading [3, 18, 19, 20]. In aquatic ecosystems, modest increases in annual plant nutrient loadings, particularly TP, are sufficient to drive increases with in situ methylation of existing low inorganic mercury concentrations in water or sediment to produce the necessary amounts of very bioaccumulative methylmercury. A key diagnostic parameter for eutrophication stress in such situations is elevated mercury levels in fish.
Hence, an important first step for ecosystem assessment is to assess fish tissue concentrations involving species representing different feeding guilds for chemicals such as mercury, to quantify local patterns of risk to consumers of fish within sport or subsistence fisheries. The next important step is to minimize local anthropogenic sources of increased nutrient loading into sensitive watersheds. This approach is justified, as subsistence fisheries include individuals who often rely on other country foods, and can have high proportions of food types with elevated mercury residues compared with consumers who do not regularly consume country foods.
4.1 Management of nutrients that cause eutrophication in Ontario
In Ontario, the PWQO for TP addresses the aesthetic, algal bloom issue with the 10, 20, and 30 μg/l objectives for lakes and rivers. Although these concentrations for TP are referred to as water quality objectives, they represent interim guidelines developed in 1979 as a strategy to control eutrophication. Referring to these objectives, Ontario ([24], pp. 13–14) states: “Current scientific evidence is insufficient to develop a firm Objective at this time. Accordingly, the following phosphorus concentrations should be considered as general guidelines which should be supplemented by site-specific studies…”.
Thus, the current site-specific Ontario PWQO for TP is provided in the Lakeshore Capacity Assessment Handbook with both the rationale and application methodology. Specifically, Ontario ([25], pp. 13–14) states: “The revised PWQO for lakes on the Precambrian Shield allows a 50 percent increase in phosphorus concentration from a modeled baseline of water quality in the absence of human influence.” It is clear that the PWQO for TP in water bodies on the Precambrian Shield according to current Ontario regulations, is not the aesthetic-based objectives of 10, 20, or 30 μg/l. Rather, site-specific objectives for lakes and rivers must be developed using the methods presented in Ontario [25].
An additional key policy objective in the PWQO process is included in Ontario ([24], p. 6): Policy 2 states, “Water quality which presently does not meet the Provincial Water Quality Objectives shall not be degraded further and all practical measures shall be taken to upgrade the water quality to the Objectives.”
The fish tissue methylmercury data presented herein confirms that various water bodies in MFN’s traditional territories are currently subject to significant eutrophication stress. The confirmation of eutrophication extends from elevated methylmercury in fish tissue to observations reported by MFN residents of periodic algal blooms and more extensive submerged aquatic vegetation during recent years compared to the past for these habitats and is consistent with other technical studies that have also reported the presence of eutrophication in these different areas [1, 14, 15, 18, 19].
Thus, site-specific TP PWQOs are required to be developed to limit TP loadings to local watersheds due to the regional pattern of evidence of eutrophication [17]. As eutrophication is also caused/enhanced by nitrogenous substances, [ammonia, nitrate, nitrate, Total Kjeldahl nitrogen (TKN)], which are also plant nutrients, loadings of these substances should also be limited. As well, total organic carbon (TOC) is a parameter reflecting general aquatic nutrient status. This data suggests a safe rule of thumb is most surface waters are suffering from excessive nutrient loads, consistent with observations for the Lake Superior watershed [30, 31], and from other parts of Ontario [21, 32, 33, 34].
Studies since 2018 led by MFN for proposed and current large-scale activities (e.g., mines) within MFN traditional territory identified evidence that demonstrates the release of nutrients such as phosphorus and nitrogen above government guidelines. Evidence of eutrophication has also been documented or reported by others for habitats across Ontario that receive this effluent with elevated phosphorus and nitrogen [3, 4, 16, 17, 18, 19, 20]. These examples where large-scale activity is associated with increased nutrient loads followed by eutrophication are also now associated with elevated concentrations of mercury in fish tissue [2, 3, 6, 11, 20]. Such observations of linkages involving nutrient management, eutrophication, and mercury tissue concentrations confirm the importance and need to carefully manage nutrients as well as fish consumption in these habitats.
Considerations such as land use, nutrient management, vegetation replanting, and gravel road construction are topics of concern to MFN and are identified within the current land use planning document under preparation. In the future, MFN plans to manage environmental settings with a science-based approach intended to retain and protect existing natural heritage and cultural values. With this long-term view, it is hoped that enhanced environmental management will be achieved, and result in lower nutrient loadings to surface waters, including wetlands, creeks, rivers, and lakes. The completion of land-use planning within MFN’s traditional territory is expected to result in the achievement of more balanced environmental management and benefit MFN residents as well as terrestrial and aquatic habitats.
4.2 Comparison of findings for recent fish monitoring with current Ontario online consumption guidelines
Available information from verified historical studies indicates that mercury fish tissue concentrations for fish species in lakes and rivers within MFN territory were largely below ∼0.06 μg/g WW prior to 1982. Studies completed after the mid-1980s indicate increased mercury concentration in fishes and the need for fish consumption guidelines. Such increases in methylmercury over time identifies the need for comparison with Ontario’s fish consumption guidelines within this extended study period as a strategy to place the current guidelines in context. This approach is justified, given observed increases in methylmercury over the study period, across lakes and rivers in MFN territory.
Observed fish length:mercury relationships in MFN territory reported herein identified the Ontario online consumption guide generally follows fish length when ∼0.06 μg/g WW is first evident in the tissue monitoring data. However, there was some variability in the comparisons among fish species. Specifically, Lake Whitefish, White Sucker, and Longnose Suckere that consume detritus, plants, mud, and invertebrates demonstrated very good concordance between the initial length in Ontario's consumption guide for fish length with mercury at ∼0.06 μg/g WW. For species that are predators on other fishes like Northern Pike, the initial length for consumption restriction was larger, suggesting the Ontario online consumption guide was less restrictive than suggested from available monitoring data. For other predatory fishes, such as Walleye, Lake Trout, Burbot, and Smallmouth Bass, initial lenght for consumption restriction at ∼0.06 μg/g WW was smaller, suggesting the Ontario consumption guide was more conservative.
These modest differences for initial length of consumption restriction for a species are likely related to differing mercury accumulation in the various habitats, small or size-limited fish sample sizes, and/or skewed population distributions related to local factors such as high fish harvest rates in fisheries. Such uncertainty and variability represent some of the challenges in developing of fish consumption guidance for highly mobile fishes. Nevertheless, the general pattern is consistent with the understanding increasingly elevated mercury concentrations within older/longer fish compared with smaller/younger fish for a species and mercury tissue concentration of ∼0.06 μg/g WW is the threshold that identifies when consumption should be reduced, to reduce risk for consumers.
As previously noted, MFN residents are considered sensitive consumers of fish resources, due to a relatively high frequency for consumption of wild fish. Hence, when any interested person consults this Ontario online resource, it is readily feasible to ascertain what the risk of consumption of a particular fish species exists through simply knowing the length for the fish species where the consumption restrictions start. In addition, this approach also does not require the sex of the fish species to be known, as the general accumulation pattern of mercury in fishes is often comparable between male and female fishes, as reported previously [6, 12], and a pattern also observed across species in this study. Therefore, understanding the basis of the consumption guidelines for fish provides a strategy to inform all individuals that harvest fish concerning the appropriate quantities across fish species and fish lengths.
4.3 Recommendations for fish consumption guidance for study lakes
With the available monitoring information from public and private sources, all habitats assessed within this study included fish specimens that exceeded the generic MOECC and Health Canada threshold for consumption of 0.06 μg/g and 0.5 μg/g mercury, respectively. Those fish specimens with the highest mean concentrations of tissue mercury were predators that consumed other fishes such as Northern Pike, Walleye, Burbot, and Lake Trout.
In contrast, omnivore species that consume mud, detritus, plants, and invertebrates such as Lake Whitefish, White Sucker, and Longnose Sucker had consistently lower mean concentrations of tissue mercury. Also, species such as Smallmouth Bass that consume invertebrates at small lengths and fish at larger lengths demonstrated tissue residues that were often intermediate of the predators and omnivores.
To review, the mean tissue residues ranked from highest to lowest were as follows: Northern Pike, Walleye, Lake Trout, Burbot, Smallmouth Bass, Lake Whitefish, White Sucker, and Longnose Sucker. From this group, Northern Pike, Walleye, Lake Trout, Burbot, and Smallmouth Bass all had specimens where tissue concentrations ≥0.5 μg/g and also frequently with specimens with concentrations ≥1.0 μg/g.
Given that MFN residents are classified as a sensitive population, due to frequent consumption of fish, the consumption guideline to lower risk is set at 0.2 μg/g mercury within tissue. Considering MFN residents as a sensitive population and using a threshold consumption guide of 0.2 μg/g, the recommended consumption rates of Northern Pike are:
For fish with a length of 15–35 cm: child: one meal per week; all adults: two meals per week;
For fish 35–50 cm: child: zero meals per week; all adults: one meal per week;
For fish with length >50 cm: child: 0 meals per week; most adults: zero meals per week; adults with weight equal to or greater than 250 lbs. or 113.6 kg: one meal per week.
For the general population, the recommended consumption of Northern Pike are:
For fish with a length of 15–35 cm: child: two meals per week; all adults: three meals per week;
For fish with length of 35–50 cm: children are allowed one meal per week; for most adults: two to three meals per week, and for adults with weight equal to or greater than 250 lbs. or 113.6 kg: four meals per week;
For fish with length >50 cm: children allowed zero meals per week; most adults: one to two meals per week; adults with weight equal to or greater than 250 lbs or 113.6 kg: two meals per week.
These recommendations for consumption guidelines, based on available fish monitoring information, indicate all members of the sensitive MFN population need to be cautious with consumption of Northern Pike, Walleye, Lake Trout, Burbot, and Smallmouth Bass across habitats. The consumption recommendations for Lake Whitefish, Common White Sucker, and Longnose Sucker are less restrictive due to the consistently lower mercury tissue concentrations in these latter species due to diets of detritus, plants, and invertebrates.
This recommended consumption approach for wild fish in subsistence fisheries uses the precautionary principle. Specifically, the study recommends consumption rates that are expected to avoid health consequences, if they are followed. It is not feasible to forecast possible health outcomes for individuals who do not follow the recommendations provided from the guide and/or the online recommendations from Ontario. It is well-established science that excessive consumption of wild fish can lead to undesirable human health outcomes and this predicate justifies the need for a guide involving the consumption of wild fishes.
This study has allowed for an update on the COCs in fishes harvested within MFN territory. The study approach also included the allowance for the analysis of past public and private studies to represent a wider set of observations across lake and river habitats. Time trends in mercury in fish tissue suggest that eutrophication is evident across the four lakes and rivers and these locations extend west to east across MFN territory. These forested watersheds appear to have been experiencing the effects of eutrophication since at least 2009, from an unknown combination of diffuse and defined nutrient sources.
An initial finding is that mercury is the primary contaminant of concern evident in fish tissue. The analyses included herein also identified that sport fish consumption guidelines in Ontario are first initiated for a fish species in a habitat when mercury concentrations in muscle tissue at a given length exceed about 0.06 μg/g. Then for this species, consumption recommendations are severely limited at 0.5 μg/g in tissue at a given length, with no consumption recommended for fish specimens with lengths associated with ≥1.0 μg/g.
Analysis of available historical and recent information indicates the larger specimens in many fish populations show the highest concentrations of mercury and should be generally avoided for consumption. Comparisons across habitats suggest consistent concentrations of methylmercury above 0.06 μg/g since at least 2009 with the likely cause of widespread eutrophication.
This study also confirmed that consumption guidance is required for nearly all habitats across MFN’s traditional territory confirming this is a regional pattern due to pervasive contamination by mercury. A topic of concern that requires further study that was not addressed concerns the possible consequences on wildlife (e.g., birds, small mammals) that also consume fish with elevated mercury. Similarly, other wildlife (e.g., Moose Alces alces) may be at risk from exposure through the consumption of sediment and aquatic plants with elevated mercury. Exploration of consequences on birds, small mammals, and large mammals is a warranted study.
This study was supported through all phases by Chief Patricia Tangie of MFN. Chief Tangie embraced the need for careful environmental management and a greater understanding of the lakes, rivers, and traditional foods used by MFN residents across their territory. During the completion of the study, Aaron Bumstead and Stephen Murphy coordinated information collection during the challenges of the Covid-19 Pandemic. The fish sample team was led by Paul Jaques with assistance from Luc Jacques, Kim Rodrigue, Bob Elliot, Danny Couture, Bernard Debassige, Noodin Stone, Cassius Stone, Matthew Stone, and Ryan Lesage. In addition, Jessica Labranche, Christopher Buckle, and John Kim Bell also assisted with other aspects of this study.
References
1.Schindler DW. Carbon, nitrogen, and phosphorus and the eutrophication of freshwater lakes. Journal of Phycology. 1971;7(4):321-329. DOI: 10.1111/j.1529-8817.1971.tb01527.x
2.Rudd JW. Sources of methyl mercury to freshwater ecosystems: A review. Water, Air, & Soil Pollution. 1995;80:697-713. DOI: 10.1007/BF01189722
3.Lavoie RA, Jardine TD, Chumchal MM, Kidd KA, Campbell LM. Biomagnification of mercury in aquatic food webs: A worldwide meta-analysis. Environmental Science & Technology. 2013;47(23):13385-13394. DOI: 10.1021/es403103t
4.Gandhi N, Tang RW, Bhavsar SP, Arhonditsis GB. Fish mercury levels appear to be increasing lately: A report from 40 years of monitoring in the province of Ontario, Canada. Environmental Science & Technology. 2014;48:5404-5414. DOI: 10.1021/es403651x
5.Gandhi N, Bhavsar SP, Tang RWK, Arhonditsis GB. Projecting fish mercury levels in the province of Ontario, Canada and the implications for fish and human health. Environmental Science & Technology. 2015;40:14494-14502. DOI: 10.1021/acs.est.5b03943
6.Environment and Climate Change Canada (ECCC). Canadian Mercury Science Assessment Report. EN84-130/3-2016F-PDF. Gatineau PQ. Environment and Climate Change Canada; 2016. 793 p
7.Gentès S, Löhrer B, Legeay A, Mazel AF, Anschutz P, Charbonnier C, et al. Drivers of variability in mercury and methylmercury bioaccumulation and biomagnification in temperate freshwater lakes. Chemosphere. 2020;267:128890. DOI: 10.1016/j.chemosphere.2020.128890
8.Blanchfield PJ, Rudd JWM, Hrenchuk LE. Experimental evidence for recovery of mercury-contaminated fish populations. Nature. 2022;601:74-78. DOI: 10.1038/s41586-021-04222-7
9.Health Canada (HC). Human health risk assessment of mercury in fish and health benefits of fish consumption. Ottawa Ontario Health Canada; 2007. 37 p. plus appendices
10.Charette T, Kaminski G, Rosabal M, Amyot M. Effects of speciation, cooking and changes in bioaccessibility on methylmercury exposure assessment for contrasting diets of fish and marine mammals. International Journal of Environmental Research and Public Health. 2021;18:2565. DOI: 10.3390/ijerph18052565
11.Kidd KA, Muir DC, Evans MS, Wang X, Whittle M, Swanson HK, et al. Biomagnification of mercury through lake trout (Salvelinus namaycush) food webs of lakes with different physical, chemical and biological characteristics. Science of The Total Environment. 2012;438:35-143. DOI: 10.1016/j.scitotenv.2012.08.057
12.Ministry of Environment (MOE). Guide to Eating Ontario Sport Fish - 1985. Toronto, Ontario; Ontario Ministry of Environment, 1985. 254 p
13.Ontario Ministry of Environment, Climate Change, and Parks (Ontario). Guide to Eating Ontario Sport Fish. Toronto, Ontario. Ontario Ministry of Environment, Climate Change, and Parks. 2022
14.Winter JG, Dillon PJ, Futter MN, Nicholls KH, Scheider WA, Scott LD. Total phosphorus budgets and nitrogen loads: Lake Simcoe, Ontario (1990 to 1998). Journal of Great Lakes Research. 2002;28:301-314. DOI: 10.1016/S0380-1330(02)70586-8
15.Meyers PA. An overview of sediment organic matter records of human eutrophication in the Laurentian Great Lakes region. Water, Air, & Soil Pollution: Focus. 2006;6:453-463. DOI: 10.1007/s11267-006-9059-9
16.Winter JG, Desellas AM, Fletcher R, Heintsch MA, Nakamoto L, Utsumi K. 2011. Algal blooms in Ontario, Canada: Increases in reports since 1994. Lake and Reservoir Management. 2011;27(2):107-114. DOI: 10.1080/07438141.2011.557765
17.Paterson AM, Dillon PJ, Hutchinson NJ, Futter MN, Clark BJ, Mills RB, et al. A review of the components, coefficients and technical assumptions of Ontario's Lakeshore Capacity Model. Lake and Reservoir Management. 2006;22:7-18. DOI: 10.1080/07438140609353880
18.Schindler DW. Lakes as sentinels and integrators for the effects of climate change on watersheds, airsheds, and landscapes. Limnology and Oceanography. 2009;54(6part2):2349-2358. DOI: 10.4319/lo.2009.54.6_part_2.2349
19.Smith VH, Schindler DW. Eutrophication science: Where do we go from here? Trends in Ecology & Evolution. 2009;24(4):201-207. DOI: 10.1016/j.tree.2008.11.009
20.Clayden MG, Kidd KA, Wyn B, Kirk JL, Muir DC, O’Driscoll NJ. Mercury biomagnification through food webs is affected by physical and chemical characteristics of lakes. Environmental Science & Technology. 2013;47(21):12047-12053. DOI: 10.1021/es4022975
21.Schindler DW. The cumulative effects of climate warming and other human stresses on Canadian freshwaters in the new millennium. Canadian Journal of Fisheries and Aquatic Sciences. 2001;58:18-29. DOI: 10.1139/cjfas-58-1-18
22.Rand GM, Wells PG, McCarty LS. Chapter 1: Introduction to aquatic toxicology. In: Rand GM, editor. Fundamentals of Aquatic Toxicology II. Bristol PA: Taylor and Francis; 1995. pp. 3-67
23.McCarty LS, Borgert CJ, Posthuma L. The regulatory challenge of chemicals in the environment: Toxicity testing, risk assessment, and decision-making models. Regulatory Toxicology and Pharmacology. 2018;99:289-295. DOI: 10.1016/j.yrtph.2018.10.001
24.Ministry of Energy and Environment (Ontario). Water Management Policies. Guidelines: Provincial Water Quality Objectives. PIBS 3303e. Toronto, Ontario: Ontario Ministry of Environment and Energy. 1994. 67 p
25.Ministry of Environment (Ontario). 2010. Lakeshore Capacity Assessment Handbook. Protecting Water Quality in Inland Lakes on Ontario’s Precambrian Shield. PIBS 7642e. Toronto, Ontario: Ministry of the Environment, Ministry of Natural Resources, and Ministry of Municipal Affairs and Housing. 2010. 47 p plus appendices
26.Fitzgerald DG, and McCarty LS. Fish Biomonitoring Study by Michipicoten First Nation. Ottawa, ON: Submitted to Indigenous Services Canada. December 2022. 81 p
27.Peterman RM, Bradford MJ. Statistical power of trends in fish abundance. Canadian Journal of Fisheries and Aquatic Sciences. 1987;44(11):879-1889. DOI: 10.1139/f87-232
28.Sokal RR, Rohlf FJ. Biometry. 3rd ed. New York: W.H. Freeman and Co.; 1995. p. 885
29.Scott WJ, Crossman EB. Freshwater Fishes of Canada. Bulletin 184. Ottawa: Fisheries Research Board of Canada. 1973. 996 p
30.Dolan DM, Chapra SC. Great Lakes total phosphorus revisited: 1. Loading analysis and update (1994–2008). Journal of Great Lakes Research. 2012;38(4):730-740. DOI: 10.1016/J.JGLR.2012.10.001
31.Chapra SC, Dolan DM. Great Lakes total phosphorus revisited: 2. Mass balance modeling. Journal of Great Lakes Research. 2012;38:741-754. DOI: 10.1016/J.JGLR.2012.10.002
32.Winter JG, Eimers LMC, Dillon PJ, Scott LD, Scheider WA, and Willox CC. Phosphorus inputs to Lake Simcoe from 1990 to 2003: Declines in tributary loads and observations on lake water quality. Journal of Great Lakes Research 2007;33:381-396. DOI: 10.3394/0380-1330(2007)33[381,PITLSF]2.0.CO;2
33.Makarewicz JC, Booty WG, Bowen GS. Tributary phosphorus loading to Lake Ontario. Journal of Great Lakes Research. 2012;38:14-20. DOI: 10.1016/j.jglr.2012.08.001
34.Mills EL, Casselman JM, Dermott R, Fitzsimons JD, Gal G, Holeck KT, et al. Lake Ontario: Food web dynamics in a changing ecosystem (1970–2000). Canadian Journal of Fisheries and Aquatic Sciences. 2003;60:471-490. DOI: 10.1139/f03-033
Written By
Dean G. Fitzgerald and Lynn S. McCarty
Submitted: 15 September 2023Reviewed: 25 September 2023Published: 03 January 2024