Open Access is an initiative that aims to make scientific research freely available to all. To date our community has made over 100 million downloads. It’s based on principles of collaboration, unobstructed discovery, and, most importantly, scientific progression. As PhD students, we found it difficult to access the research we needed, so we decided to create a new Open Access publisher that levels the playing field for scientists across the world. How? By making research easy to access, and puts the academic needs of the researchers before the business interests of publishers.
We are a community of more than 103,000 authors and editors from 3,291 institutions spanning 160 countries, including Nobel Prize winners and some of the world’s most-cited researchers. Publishing on IntechOpen allows authors to earn citations and find new collaborators, meaning more people see your work not only from your own field of study, but from other related fields too.
Athletes require careful evaluation by specialized physicians to obtain eligibility for sport. In this context, electrocardiogram can be helpful to recognize patterns associated with heart disease that put the athletes at high risk of sudden cardiac death and may interdict participation in sports. On the other hand, adaptation to exercise may induce structural remodeling of the cardiac structures that results into electrocardiographic changes that are not associated with an increased risk of adverse events during exercise. Clearly, a correct interpretation of a resting 12-lead electrocardiogram is essential to differentiate athletes at risk of sudden cardiac death who must be prohibited from agonistic sports from those with physiologic changes who should be reassured and declared eligible for sport activities. Interpretation of the athlete’s ECG has evolved over the past 15 years, and in this chapter, we provide a brief review of current evidence regarding the electrocardiographic findings considered normal and abnormal in athletes based on the latest international recommendations.
Nazarbayev University School of Medicine, Astana, Kazakhstan
Bauyrzhan Toktarbay
Nazarbayev University School of Medicine, Astana, Kazakhstan
Zaukiya Khamitova
Nazarbayev University School of Medicine, Astana, Kazakhstan
Alessandro Salustri*
Nazarbayev University School of Medicine, Astana, Kazakhstan
*Address all correspondence to: alessandro.salustri@nu.edu.kz
1. Introduction
Physical training in athletes may induce changes in the cardiac structure that can be detected by electrocardiography. Due to the relevant clinical impact, it is crucial to interpret electrocardiogram (ECG) in athletes accurately and to differentiate between physiological and pathological changes. In fact, misinterpretation can lead to costly diagnostic procedures and wrong disqualification from sports, with severe psychological and economic implications. Conversely, erroneous reporting of pathological changes as normal can be falsely reassuring for athletes, leading to potentially fatal consequences [1, 2, 3, 4, 5, 6, 7, 8].
Interpretation of the athlete’s ECG has evolved over the past 15 years, from the 2005 European Society of Cardiology (ESC) consensus [9], progressing to the ESC recommendations (2010) [10], the Seattle criteria (2013) [11], and the “refined” criteria (2014) [12]. After the first consensus statement by the ESC, ECGs were found abnormal in up to 50% of athletes, resulting in an unacceptable low specificity. Accordingly, the revised ESC criteria in 2010 divided ECG changes into training-related and training-unrelated. However, still black athletes had a significantly high number of false positive ECGs, and the Seattle criteria aimed to address the issue of ethnicity that was not accounted for in the previous recommendations. The evidence that some ECG changes in isolation assigned to the training-unrelated group may not be representative of pathology has led to the publication of the refined criteria that were later validated in large studies. Finally, in 2018 international recommendations for electrocardiographic interpretation in athletes have been published with additional refinements of the ECG abnormal patterns, which has led to a significant reduction in false positive and screening-associated costs [13].
In this chapter, we will summarize the ECG interpretation standards that classify the ECG findings and provide a clear guide to the proper evaluation of ECG abnormalities in athletes.
We have reviewed the recommendations from the international societies, with an emphasis on the latest one [13] that has refined the previous [9, 10, 11, 12] and resulted in a decrease in false positive findings. Accordingly, the ECG findings in athletes were classified into normal, borderline, and abnormal (Table 1).
Normal ECG findings
Increased QRS voltage for left ventricular hypertrophy (LVH) or right ventricular hypertrophy (RVH)
Early repolarization
ST elevation followed by T-wave inversion V1-V4 in black athletes
Juvenile ECG pattern (T-wave inversion V1-V3 age <16 years old)
Sinus bradycardia or arrhythmia
Ectopic atrial or junctional rhythm
Incomplete right bundle branch block (RBBB)
First-degree A-V block (P-R <400 ms)
Second-degree A-V block Mobitz 1
Borderline ECG findings
Left axis deviation
Left atrial enlargement
Right axis deviation
Right atrial enlargement
Complete RBBB
Abnormal ECG findings
Abnormal T-wave inversion
ST segment depression
Pathologic Q waves
Complete left bundle branch block (LBBB)
Non-specific intraventricular conduction delay (QRS ≥140 ms duration)
Ventricular pre-excitation
Prolonged QT interval
Short QT interval
Brugada type 1 pattern
Profound sinus bradycardia (<30 bpm)
PR interval ≥400 ms
Second-degree A-V block Mobitz 2
Third-degree A-V block
≥2 premature ventricular contractions (PVC) per tracing
Left ventricular hypertrophy (LVH): SV1 + RV5 or RV6 >3.5 mV.
Right ventricular hypertrophy (RVH): RV1 + SV5 or SV6 >1.1 mV.
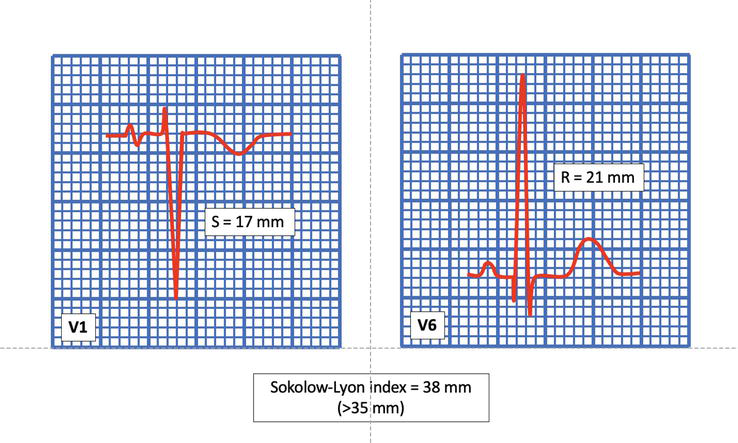
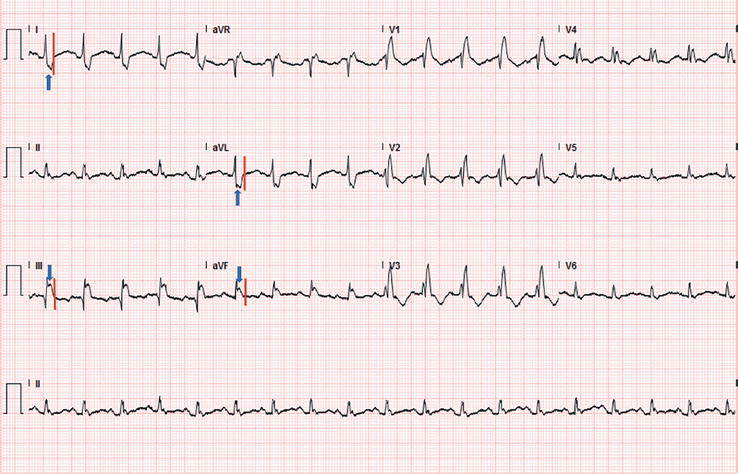
High-voltage QRS complexes are frequently found in ECG of athletes, and Sokolow–Lyon voltage criteria for LVH can be present in up to 50% of male athletes (Figure 1); however, without echocardiogram, this is not a reliable indicator of an increased thickness of the left ventricular wall. Signs of LVH are confirmed by echocardiogram only in 12% of the cases, and this prevalence is related to the type of sport activity, ranging from 29% in high cardiovascular demand sports (decathlon, cycling, and rowing), as compared to only 12.3% and 5.4% in sports with medium (swimming, rugby, and skating) or low (bowling and golf) cardiovascular demand, respectively.
Figure 1.
Increased QRS voltage for LVH. Sokolow-Lyon index is the sum of the amplitude of S wave in V1 and the highest R wave in V5 or V6. In this example, the sum is 38 mm, suggesting the presence of LVH.
The correlation between these ECG findings and echocardiographic measures of left ventricular wall thickness is low (10%-50% depending on the series), with the Sokolow–Lyon index being the best-correlated parameter in different publications [12]. Of note, in a study in 947 highly trained athletes, only 1.7% had wall thickness greater than or equal to 13 mm, compatible with the diagnosis of hypertrophic cardiomyopathy [14].
Evaluation
Isolated QRS voltage criteria for LVH do not necessarily indicate pathology in athletes. In fact, this pattern is quite common in athletes and is present in less than 2% of patients with hypertrophic cardiomyopathy (HCM) [15, 16, 17, 18, 19, 20, 21]. Furthermore, pathological LVH is usually accompanied by other ECG features such as T-wave inversion (TWI) in the inferior and lateral leads, pathological Q waves, and ST segment depression [12, 22]. In this regard, the high QRS voltages present alone, fulfilling the criteria for LVH in the absence of other ECG or clinical pathology, can be interpreted as normal and training-related changes in athletes, and there is no need for further evaluation.
Voltage criteria for RVH are also common in athletes, with up to 13% of them meeting the Sokolow–Lyon index. However, when present in isolation, QRS voltages for RVH do not correlate with any underlying medical condition in athletes. It is similar to the voltage criteria for LVH and is considered a normal ECG finding in athletes. Therefore, isolated QRS voltage criteria suggest RVH does not require further evaluation.
3.2 Early repolarization
Definition
Elevation of the QRS-ST junction (J-point) by at least 0.1 mV, which is often accompanied by a late QRS slurring or notching (J wave).
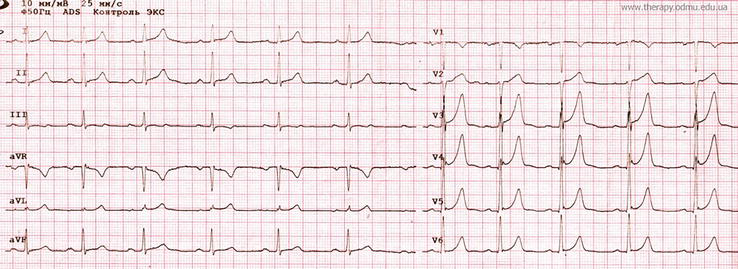
This condition is usually observed in the inferior and/or lateral leads and is commonly found in healthy populations, with a prevalence ranging from 2% to 44% (Figure 2).
Figure 2.
Early repolarization pattern.
It is more frequently observed in athletes, young individuals, males, and people of black ethnicity. Up to 45% of Caucasian athletes and 63%–91% of African-Caribbean descent athletes (“black athletes”) exhibit early repolarization [13].
Studies in patients who have suffered from cardiac arrest or have had primary ventricular fibrillation (VF) suggest that there might be a link between early repolarization and the risk of VF [23, 24]. A study on middle-aged individuals has shown that those with an early repolarization pattern in the inferior leads, horizontal or descending ST segment after the J-point, have a significant risk of arrhythmic death. Meanwhile, a rapidly ascending ST segment – the dominant ST pattern in healthy athletes has a better positive [25, 26]. In some athletes, early repolarization is a dynamic process that is directly influenced by exercise training. This results in an increase in frequency of early repolarization patterns during times of peak fitness [24, 27, 28].
Evaluation
While further research is necessary to understand the pathophysiology and prognosis of early repolarization in professional athletes, currently, there is no evidence of the relationship between inferior early repolarization and sudden cardiac death in athletes. Therefore, isolated early repolarization in athletes can be considered a benign variant [29].
3.2.1 Repolarization findings in black athletes
Definition
Elevation of the J-point and convex ST segment elevation in the anterior leads (V1-V4), followed by TWI.
In the last decade, ethnicity has been considered as a significant determinant of cardiac adaptation to exercise in black athletes, demonstrating a higher prevalence of ECG anomalies, including repolarization changes. In over two-thirds of black athletes, the presence of ST-segment elevation and T-wave inversion (TWI) (in one-fourth of athletes) were noticed [17, 30, 31, 32].
A study involving African descent of 904 black male athletes demonstrated that 13% of them, in leads V1-V4, had isolated TWI compared to 4% of black sedentary controls [30]. The most anterior TWI was shown by J-point elevation and convex ST segment rise. However, the athletes with anterior TWI did not exhibit symptoms or signs of cardiomyopathy after a comprehensive assessment and a 5-year follow-up period. Quite the same findings in female and adolescent black athletes were reported by other researchers [30].
Evaluation
Therefore, TWI in leads V1-V4, when followed by J-point elevation and convex ST segment rise, should be considered part of the “black athlete’s heart,” and in the absence of other clinical or ECG features of cardiomyopathy, there is no need for further investigation.
3.3 Juvenile ECG pattern
Definition
T-wave inversion (TWI) or biphasic T-wave in two contiguous anterior leads (V1–V3) in individuals <16 years of age.
TWI in the area of anterior precordial leads may be interpreted as a normal age-related changes in athletes up to the age of 16 years. Studies evidence that in 10%-15% of white athletes aged 12 years, the juvenile pattern was present, but only 2.5% of athletes aged 14–15 years had juvenile ECG pattern [33, 34, 35]. The occurrence of anterior TWI beyond lead V2 in white athletes aged 16 years or younger who have completed puberty is rare, with only 0.1% of athletes showing this pattern.
Evaluation
Based on current evidence, in the absence of symptoms, signs, or a family history of cardiac disease, TWI in the anterior leads (V1–V3) in adolescent athletes younger than 16 years of age or prepubertal athletes does not require further evaluation [13, 35].
3.4 Physiological arrhythmias
Sinus arrhythmia is considered to be a physiological pattern in heart rate due to breathing. This variation is a normal condition and should not be mistaken for sick sinus syndrome or sinus node dysfunction. The P wave axis remains normal in the frontal plane, and the fluctuation in heart rate should resolve with the onset of exercise in sinus arrhythmia. Criteria for the evaluation of sinus node dysfunction are important because it can be identified by several distinctive features, such as absence of rhythmic changes in heart rate; sudden and sustained decreases or increases in heart rate; periods of sinus arrest or prolonged pauses; slowed acceleration or excessively rapid deceleration during exercise; and any association with clinical symptoms such as exercise intolerance, pre-syncope, and syncope.
A junctional escape rhythm might be registered when the QRS rate is faster than the resting P wave or sinus rate. This is typically connected with increased vagal tone. In a junctional escape rhythm, the R-R interval is regular, and unless the baseline QRS has a bundle branch block, the QRS complexes are narrow. Once physical activity starts, sinus rhythm should resume.
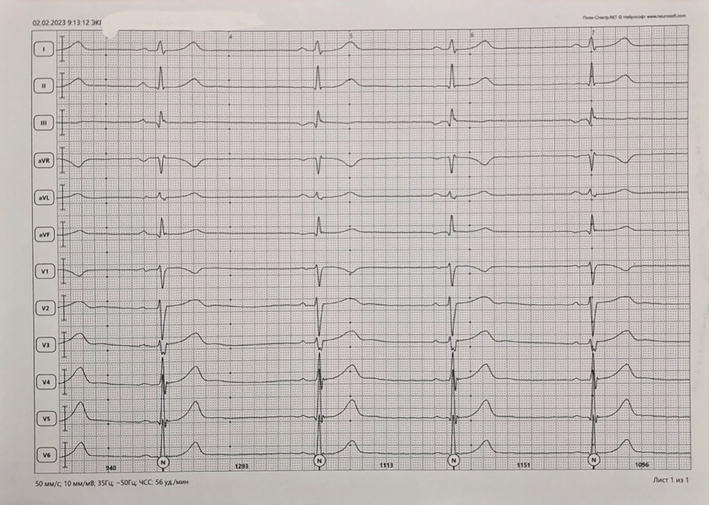
In an ectopic atrial rhythm, the morphology of P waves is different from that of the normal sinus P wave. These P waves are most easily observed when they are negative in the inferior leads (Figure 3). Sometimes, two different P wave patterns may be seen (“wandering atrial pacemaker”). In up to 8% of all athletes at rest, a junctional escape rhythm or wandering atrial pacemaker may be observed. Ectopic atrial rhythms happen due to a slower resting sinus rate caused by increased vagal tone in athletes. With the onset of physical activity, the sinus rhythm should resume.
Figure 3.
ECG recording at 50 mm/s. Sinus bradycardia (56/min). The second, third, and fourth beats show inverted P waves in II, III, and aVF, indicating an ectopic atrial rhythm.
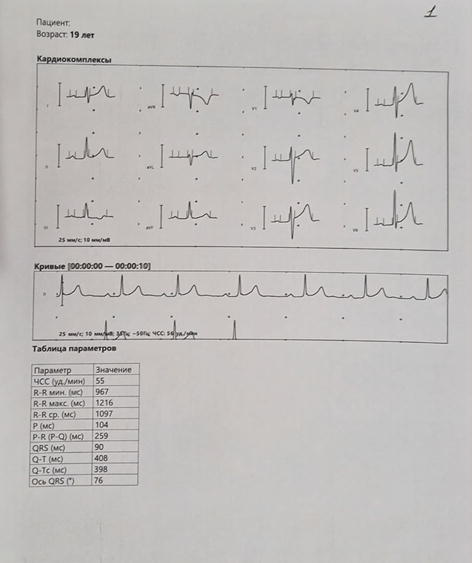
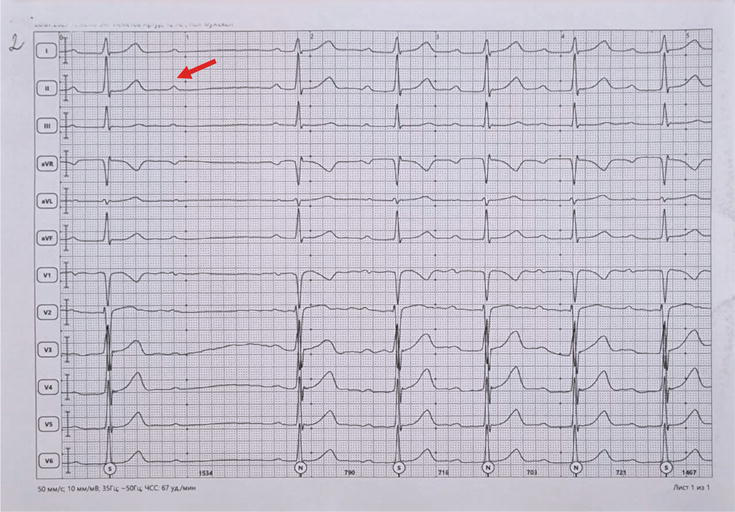
First-degree AV block (Figure 4) and Mobitz type I second-degree AV block (Figure 5) are also considered normal in trained athletes.
ECG recording at 50 mm/s. P-R intervals are progressively increasing (from the second beat of the strip) until a P wave is blocked (arrow). This indicates a second-degree Mobitz 1 A-V block.
Recent data suggests that some ECG findings which were previously considered abnormal, may be a normal variant or a result of physiological cardiac remodeling in athletes. Recent findings suggest that axis deviation, voltage criteria for atrial enlargement, and complete right bundle branch block (RBBB), are classified as “borderline” findings in athletes and do not typically indicate cardiac disease [13].
4.1 Axis deviation and voltage criteria for atrial enlargement
Definitions
Left axis deviation: −30 to −90°
Right axis deviation: >120°
Left atrial enlargement: Prolonged P wave duration of >120 ms in leads I or II with negative portion of the P-wave ≥1 mm in depth and ≥40 ms in duration in lead V1;
Right atrial enlargement: High-pointed P-wave ≥2.5 mm in II, III, or V1
Researchers found that the Seattle criteria reduces the number of positive ECGs compared to the 2010 ESC criteria by at least 40% [17, 18, 36]. It also improves specificity without compromising sensitivity. However, more recent publications suggest that some ECG patterns classified as abnormal in athletes do not correlate with cardiac pathology [16]. These patterns include axis deviation and voltage criteria for atrial enlargement.
In a study of 2533 sportsmen aged 14–35 years and 9997 controls of analogous age, isolated right or left atrial enlargement and isolated right or left axis deviation accounted for 42.6% of all ECG findings [16]. Athletes had a slightly higher prevalence of these findings compared with controls (5.5% vs 4.4%; p=0.023). Athletes also showed a higher prevalence of left atrial enlargement and left axis deviation compared to controls (1.46% vs 0.96%; p=0.028% and 2.13% vs 1.37%; p=0.007, respectively), especially those who trained over 20 h per week. However, there were no significant differences in the prevalence of right atrial enlargement and right axis deviation between the groups (1.11% vs 1.10%; p=0.983% and 0.83% vs 0.92%; p=0.664, respectively) [13].
Athletes who have left axis deviation or left atrial enlargement have larger left ventricular and atrial dimensions compared to athletes with a normal ECG [16]. However, there are no evident differences in the number of athletes with cardiac dimensions exceeding predicted upper limits between the two groups. On the other hand, there are no differences in cardiac dimensions between athletes with right atrial enlargement or right axis deviation compared to athletes with normal/physiological ECG changes. Echo assessment of 579 athletes and controls with voltage criteria for atrial enlargement or isolated axis deviation failed to identify any abnormalities. Thus, the exclusion of axis deviation or atrial enlargement as an abnormal finding reduces the number of false positives from 13% to 7.5%. This improves the specificity of the screening (from 90% to 94%) with a marginal decrease in sensitivity (from 91% to 89.5%). Furthermore, a study of 508 university athletes in the US found that 49 (9.6%) had abnormal ECGs. However, subsequent echocardiography revealed that at least 29 of these athletes (59%) had either voltage criteria for left atrial enlargement alone or in combination with large QRS complexes [37]. These findings were consistent with athletic training and revealed no structural abnormalities in the heart.
Evaluation
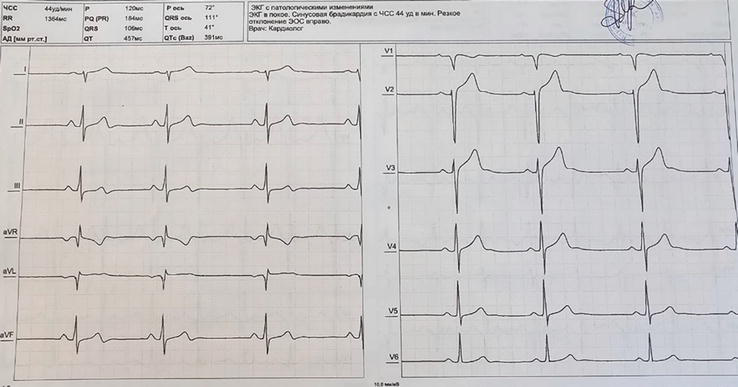
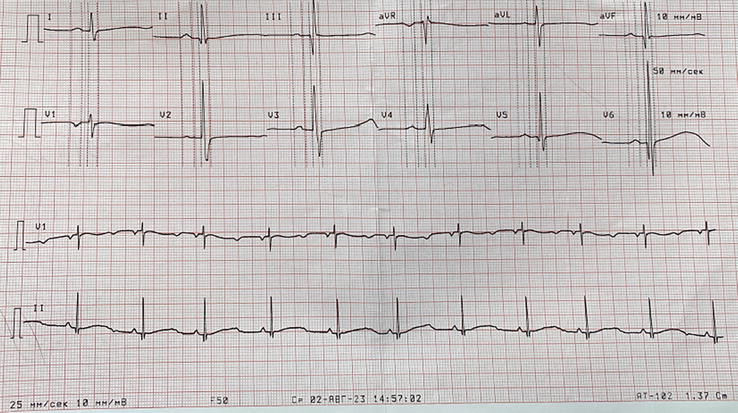
Based on these findings, if an individual displays right axis deviation and right atrial enlargement either alone or in combination with other electrical markers of “athlete’s heart,” it is likely to be a normal variation (Figure 6).
Figure 6.
ECG recording at 25 mm/s. Sinus bradycardia (44/min). QRS axis at 111° consistent with right axis deviation.
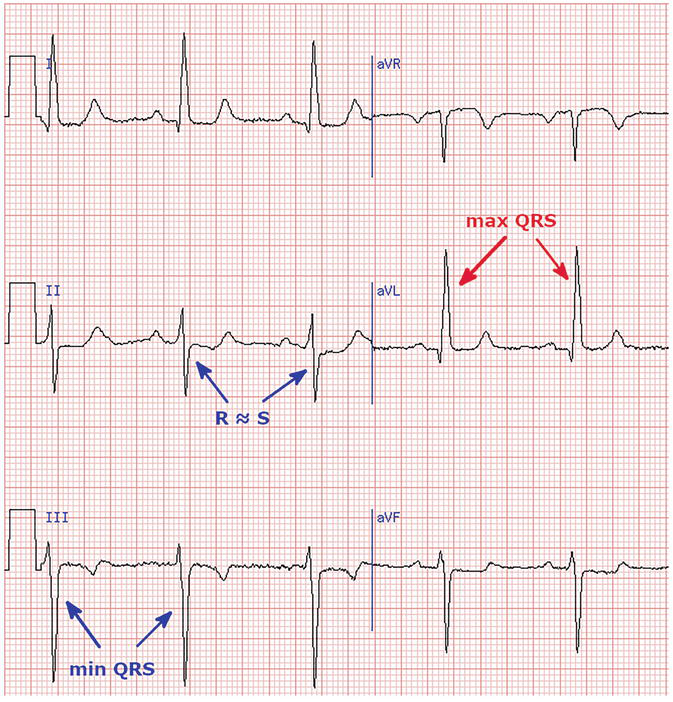
However, if a person has left axis deviation and left atrial enlargement, it could indicate a relative increase in LV dimensions among some athletes (Figure 7).
Figure 7.
Left axis deviation.
4.2 Right bundle branch block (RBBB)
Definitions
Complete right bundle branch block: rSR’ pattern in lead V1 and an S wave wider than R wave in lead I and V6 with QRS duration >120 ms.
Incomplete RBBB: rSR’ pattern in lead V1 and a qRS pattern in lead V6 with QRS duration <120 ms.
While incomplete RBBB is common in young athletes (Figure 8), the clinical relevance of complete RBBB is still not well understood (Figure 9).
Figure 8.
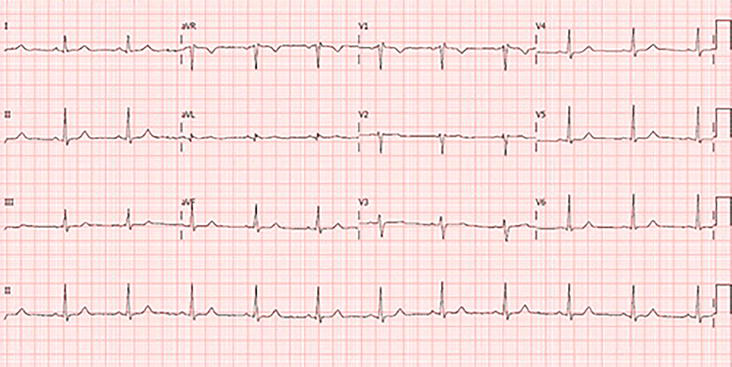
ECG recording at 25 mm/s. Sinus rhythm 64/min. Normal A-V conduction. rSr’ pattern with normal duration in V1-2, indicating incomplete RBBB.
Figure 9.
ECG recorded during a treadmill test in an athlete. rSR’ in V1-4 with wide complex, indicating complete RBBB.
According to the 2010 ESC recommendations and the recent “refined” criteria, this particular ECG pattern is defined as abnormal, even though it is considered a normal finding in the Seattle criteria if the QRS duration is less than 140 ms. The prevalence of the complete RBBB among the general population is 1%, and among young adult athletes is 0.5% to 2.5%.
The United States researchers have reported that RBBB prevalence was 2.5% of 510 athletes [37]. The athletes with complete RBBB demonstrated lower right ventricular ejection fraction and larger right ventricular dimensions and yet maintained a preserved fractional area change. However, none of the athletes with complete or incomplete RBBB showed any signs of structural heart disease. This ECG pattern may be due to the right ventricular adaptation to extreme exercise, indicating a spectrum of structural and physiological cardiac remodeling marked by right ventricular dilatation, resulting in QRS prolongation and a relative reduction in right ventricular systolic function at rest.
Evaluation
Based on the previous findings, some ECG changes in athletes, including left axis deviation, left atrial enlargement, right axis deviation, right atrial enlargement, and complete RBBB, can be considered borderline variants. If an athlete has any one of these conditions alone or in combination with other commonly seen electrical patterns in athletes, is not experiencing any symptoms, and has no family history of premature cardiac disease or sudden cardiac death (SCD), then there is no need for further assessment. However, if an athlete has more than one of these borderline conditions, then they fall under the abnormal category, and further investigation is necessary [13].
T-wave inversion >1 mm in depth from baseline in ≥2 adjacent leads, not including aVR, III, or V1.
T-wave inversion (TWI) in leads aVR, III and/or V1 are always considered normal. When TWI are present in other ECG leads, they may be associated with underlying structural heart disease. Except for TWI limited to leads V1–V4 in black athletes and leads V1–V3 in all athletes younger than 16 years, TWI ≥1 mm in depth in two or more contiguous leads in an anterior, lateral, inferolateral, or inferior territory is abnormal and requires further evaluation for underlying structural heart disease.
5.1.1 Anterior T-wave inversion
T-wave inversion in leads V1–V4 is present in 12% of black athletes and is usually preceded by J-point elevation and convex S-T segment elevation and can often return to normal with detraining [38]. T-wave inversion in anterior leads is also a normal finding in asymptomatic athletes aged <16 years [39]. Apart from these contexts, TWI beyond V2 should be further investigated to rule out an underlying arrhythmogenic right ventricular cardiomyopathy, in particular, if the J-point is not elevated and/or ST segment depression is present.
5.1.2 Lateral or inferolateral T-wave inversion
T-wave inversion in the lateral leads (I, aVL, and V5–V6) can be associated with cardiomyopathy and should always trigger further evaluation including cardiac MRI regardless of ethnicity. Cardiac MRI should be a standard part of the evaluation for ECG that is clearly abnormal and suggestive of apical hypertrophic cardiomyopathy, particularly ECG with profound (≥0.2 mV) TWI and ST segment depression in the lateral or inferolateral leads.
5.1.3 Inferior T-wave inversion
The clinical relevance of TWI in the inferior leads is not clear. Accordingly, when these abnormalities are present in an athlete’s ECG, further investigations including echocardiography or cardiac MRI are recommended.
5.1.4 Biphasic T waves
Although there is no data on the clinical significance of biphasic T waves in athletes, it is recommended further evaluation of this ECG pattern when the negative part is ≥1 mm in depth in ≥2 leads [11].
5.2 S-T segment depression
Definition
≥1 mm in depth in ≥2 adjacent leads ST segment depressions are relatively uncommon in young athletes with normal heart sound and structurally normal hearts [25, 39, 40] and are not considered a feature of athletic training.
Evaluation
Any S-T depression in ≥2 leads is considered an abnormal finding and requires further investigation (echocardiography and/or cardiac MRI) to rule out underlying structural heart disease.
5.3 Pathological Q waves
Definition
Q/R ratio ≥0.25 or a duration ≥40 ms in ≥2 contiguous leads (except III and aVR).
Any initial negative deflection of the QRS complex is referred to as a Q wave, and they are associated with both physiological and pathological electrical activity of the ventricle, including cardiomyopathy, myocardial infarction, and conduction problems.
About 1%–2% of all athletes have been shown to have pathological Q waves, with these rates perhaps being greater in male and black athletes [12, 41]. Pathological Q waves in athletes were previously defined as >3 mm in depth or >40 ms in duration in ≥2 leads (apart from III and aVR) [42, 43]. However, the specificity of these criteria is not optimal, since skinny teenage athletes and trained athletes with physiological LVH may exhibit high-precordial voltages and deep lateral or inferior Q waves. Therefore, it has been suggested that the Q wave depth be normalized to the degree of the preceding R-wave voltage to decrease the rate of false positive rate without compromising the sensitivity for detecting cardiomyopathy [12]. Accordingly, the current definition of pathological Q waves in athletes includes a Q/R ratio ≥0.25 or a duration ≥40 ms in ≥2 contiguous leads (except III and aVR).
Asymmetric septal hypertrophy, a typical feature of HCM, can result in aberrant Q waves because of higher septal stresses, septal fibrosis, and asymmetric electrical activity. In 32% to 42% of individuals with HCM, pathological Q waves are among the most prevalent aberrant ECG abnormalities [22, 44].
Evaluation
The presence of pathological Q waves in two or more adjacent leads calls for further echocardiographic examination to rule out cardiomyopathy. In particular, athletes under the age of 30 should have their risk factors for coronary artery disease thoroughly assessed, since stress testing may be necessary in those athletes who have numerous risk factors for coronary artery disease or a history of myocardial infarction. No more testing is often required if the echocardiogram is normal and there are no other alarming clinical symptoms or ECG abnormalities. Additional assessment using cardiac MRI should be taken into consideration if abnormal Q waves are detected together with other ECG abnormalities, such as ST segment depression or TWI, or if there are any suspicious clinical signs [11].
5.4 Complete LBBB
Definition
QRS >0.12 s, predominantly negative QRS complex in lead V1 (QS or rS), and upright monophasic R wave in leads I and V6.
LBBB is present in <1 in 1000 athletes, whereas it is common in patients with ischemic heart disease or cardiomyopathy [45, 46, 47].
Evaluation
To rule out a serious cardiac condition, complete LBBB must thus always be regarded as an aberrant finding and subjected to a thorough investigation. Complete LBBB athletes need to have a comprehensive myocardial disease evaluation, which includes echocardiography and a cardiac MRI.
Intraventricular conduction delay in athletes is likely caused by both enlarged myocardium and delayed conduction fibers brought on by neural impulses. While the precise threshold for further investigation in athletes with an NIVCD is still unknown, international recommendations suggest that any marked NIVCD in athletes >140 ms, regardless of QRS morphology, should be taken seriously and warrant further investigation.
Evaluation
No additional diagnostic testing is necessary in asymptomatic athletes with an isolated, NIVCD of <140 ms. Athletes with cardiovascular symptoms, a worrisome family history of sudden death, suspected cardiomyopathy, and an NIVCD 140 ms or in combination with additional ECG abnormalities need to be further assessed.
5.6 Ventricular pre-excitation
Definition
PR interval <0.12 s with a delta wave (slurred upstroke in the QRS complex).
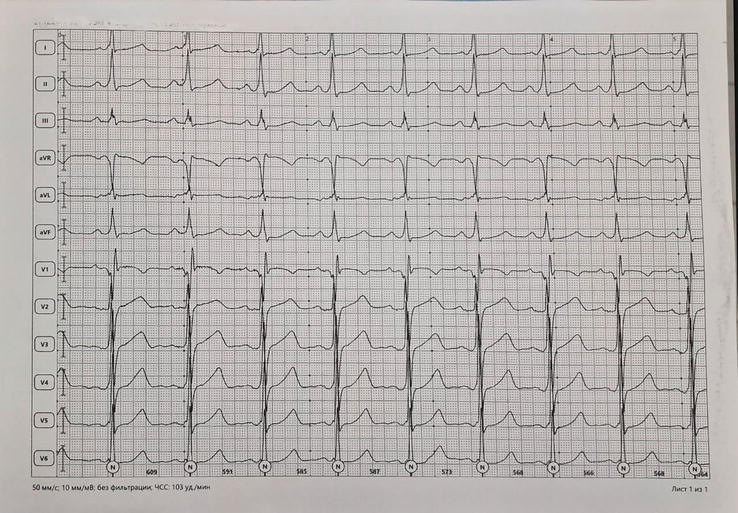
Ventricular pre-excitation pattern is present in about 1/1000 to 4/1000 athletes (Figure 10) [36, 46, 48]. The clinical implication of pre-excitation is that athletes may be more susceptible to sudden cardiac death since ventricular fibrillation may happen in case of paroxysmal atrial fibrillation conducted through the fast accessory pathway.
Figure 10.
ECG recording at 50 mm/s in a 24-year-old asymptomatic athlete. Sinus tachycardia 103/min. Short P-R interval with the slurring slow rise of the initial portion of the QRS (delta wave) indicating ventricular pre-excitation through an accessory pathway.
Evaluation
Athletes with an isolated short PR interval without delta wave or wide QRS do not deserve additional evaluation. In contrast, asymptomatic athletes with a Wolff-Parkinson-White (WPW) pattern should be investigated for a low-risk or high-risk accessory pathway. In these athletes, an exercise stress test is the first non-invasive step for risk stratification, and it indicates a low-risk accessory route when there is a rapid, complete cessation of pre-excitation at increasing heart rates [49, 50]. A low-risk accessory pathway is also consistent with intermittent pre-excitation during sinus rhythm on a resting ECG, which may eliminate the requirement for additional tests [51].
If non-invasive testing is equivocal or unable to prove a low-risk accessory pathway, electrophysiology study should be performed to find the shortest pre-excited RR interval during an induced atrial fibrillation. A pre-excited RR interval of <250 ms (equal to a heart rate of 240/min) indicates a high-risk accessory pathway, and athletes should undergo radiofrequency ablation [50].
5.7 Q-T interval
5.7.1 Prolonged Q-T interval
Definition
QTc ≥0.47 s (males)
QTc ≥0.48 s (females)
QTc ≥0.50 s (unequivocal long QT syndrome (LQTS))
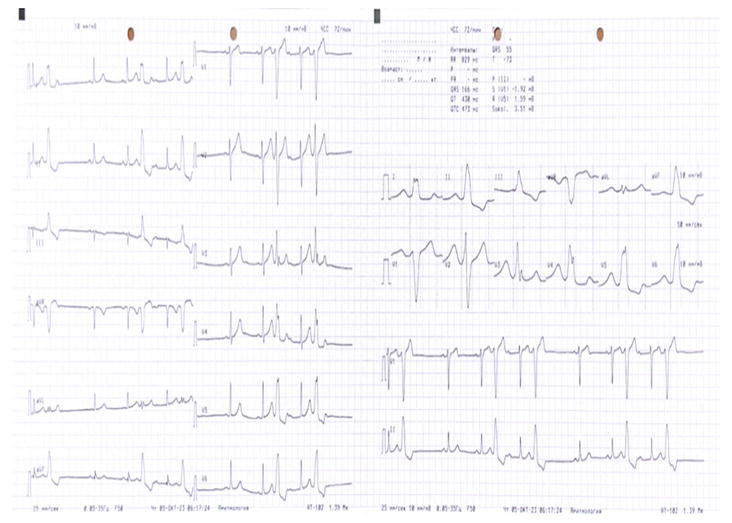
Congenital long QT syndrome (LQTS) is a potentially fatal syndrome characterized by genetically mediated ventricular arrhythmias (torsades de pointes or ventricular fibrillation) (Figure 11). The hallmark electrocardiographic feature is represented by marked QT prolongation due to loss-of-function mutations in the genes producing voltage-gated potassium channels, which control phase 3 repolarization.
Figure 11.
ECG recording at 25 mm/s. Prolonged Q-T interval (560 ms).
The prevalence of this abnormality is around 1 in 2,000 individuals [52], and it may account for 25–40% of autopsy-negative sudden cardiac deaths [53].
Since the accuracy of computer-produced QT intervals corrected for heart rate (QTc) values range from 90% to 95%, accurate measurement and manual validation of the computer-derived QTc are essential. Six principles have been suggested by Postma et al [54] in order to have an accurate assessment of the QTc; however, in clinical practice, we can compare the manually measured QTc in lead II and V5 with the one provided by the computer, which should provide a difference <10 ms.
5.7.2 Short QT interval
Definition
QTc ≤0.32 s
The prevalence of a short QT interval is 0.1%, according to data from over 18,000 asymptomatic young British people; hence, it is pragmatic to recommend that a cut-off value of 320 ms is abnormal. However, individuals with a short QT (<320 ms) did not experience any adverse events, syncope, or sudden death throughout a mean follow-up period of 5.3 years [55]. Thus, a short QT interval should be alarming only in the presence of clinical markers like syncope, premature atrial fibrillation, ventricular arrhythmias, or a pertinent family history.
Evaluation
A prolonged QTc needs additional evaluation. A family history of syncope and premature sudden death should be investigated. In the absence of symptoms or familial disease, a QTc <500 ms is unlikely to represent an LQTS, while a QTc ≥500 ms is highly suggestive of LQTS. If the personal or family history is positive, electrophysiology evaluation is recommended. If the personal/family history is negative, ECG should be repeated on a different day, and if the QTc is below the cut-off values, no additional tests are required.
5.8 Brugada type 1 pattern
Definition
High take-off and downsloping ST segment elevation in V1–V3.
Distinguishing the elevated ST segment characteristic of the Type 1 Brugada pattern from the upward-sloping ST elevation evident in early repolarization among athletes is imperative. In pursuit of this discrimination, the Corrado index emerges as a pertinent metric. This index entails the assessment of the ratio between the ST elevation at the onset of the ST segment/J-point (STJ) and that at 80 ms subsequent to the initiation of the ST segment (ST80). A Corrado index exceeding 1 signifies a predisposition toward a Type 1 Brugada pattern, whereas a ratio falling below 1 in the context of an athlete denotes the manifestation of an early repolarization pattern [56, 57].
Brugada syndrome is an inherited cardiac electrical disorder with an autosomal dominant mode of transmission and incomplete penetrance, with a prevalence ranging between 5 and 66 per 10,000 [58]. Brugada syndrome is projected to account for approximately 4% of total instances of sudden deaths within the general population and represents 5%-20% of cases involving sudden unexplained deaths with an anatomically normal heart upon postmortem examination [12]. The diagnostic criteria for Type 1 Brugada pattern, currently regarded as the exclusive diagnostic indicator, encompasses a coved rSr’ pattern, ST elevation of ≥2 mm, and the inversion of the terminal segment of the T wave in leads V1, V2, and V3. Importantly, these manifestations are not associated with myocardial ischemia, electrolyte imbalances, or overt structural heart pathology [59, 60]. It predisposes to ventricular arrhythmias unrelated to structural heart diseases, and sudden cardiac death occurs more often during states of enhanced vagal tone.
Over the past 25 years, there has been prevalent interchangeability in both scholarly articles and clinical practice between the terms “Brugada type 1 ECG pattern” and “Brugada syndrome” [61]. Even the recent guidelines from the European Society of Cardiology (ESC) concerning the prevention of sudden cardiac death (SCD) equate the Brugada type 1 ECG pattern with Brugada syndrome, establishing the diagnosis of Brugada syndrome primarily based on ECG criteria. This semantic error has the deleterious consequence that any subject displaying a Brugada type 1 ECG pattern is considered to be at risk of SCD, regardless of symptomatic or asymptomatic arrhythmic presence or absence [62, 63].
Evaluation
The electrocardiographic pattern of Type 1 Brugada syndrome requires investigation, regardless of the presence or absence of clinical symptoms. When the ECG pattern is unclear, it is crucial to verify the accuracy of lead placement and perform a high-precordial lead ECG with V1 and V2 positioned in the second or third intercostal region during the repeat ECG. If the Type 1 pattern is identified on this high-precordial lead ECG, it is advisable to refer the patient to an electrophysiologist for further assessment. Careful consideration should be given to potential contributing factors that may accentuate a Brugada-like ECG pattern, such as elevated blood potassium levels, febrile states, medications with Na+ channel-blocking properties, and ensuring appropriate electrode positioning [13].
5.9 Profound sinus bradycardia/first-degree AV block
Definition
<30 bpm or sinus pauses ≥3 s.
Profound sinus bradycardia is characterized by a notable deceleration of the heart rate stemming from dysfunction within the sinoatrial (SA) node. This condition manifests as a heart rate dropping notably below 60 beats per minute, a distinguishing feature often observed in individuals with rigorous athletic training [16, 27]. However, if an athlete exhibits a resting heart rate ≤30 beats per minute or experiences a sinus pause lasting ≥3 s, a comprehensive assessment is warranted [11].
In athletes, there may exist a mild to moderate first-degree atrioventricular (AV) block, evidenced by a PR interval spanning 200–399 ms, attributable to heightened vagal tone [64]. A PR interval ≥400 ms represents a substantial prolongation and a thorough investigation to discern the presence of cardiac conduction anomalies is needed.
Evaluation
When faced with profound sinus bradycardia or a significantly prolonged PR interval, a thorough evaluation should encompass an assessment of the chronotropic response during mild aerobic activity, such as engaging in stationary running or stair climbing. Exercise testing proves valuable in this context, providing an objective evaluation of the PR interval and heart rate response to aerobic exertion. Should the heart rate demonstrate a proper increase, the PR interval normalize, and the athlete remain asymptomatic, further testing is generally unnecessary. Conversely, if the heart rate fails to rise appropriately or the PR interval does not shorten adequately during exertion, if the athlete experiences pre-syncope or syncope, or if the athlete has a family history of cardiac disease or sudden death, a more comprehensive evaluation is warranted. Depending on the specific clinical context, an echocardiogram or ambulatory ECG monitor may be deemed necessary for a thorough assessment [12, 13].
5.10 High-grade atrioventricular block
Definition
Second-degree AV block Mobitz type 2: Intermittently non-conducted P waves not preceded by PR prolongation and not followed by PR shortening.
Third-degree AV block: Complete heart block.
Mobitz type 2 second-degree AV block and third-degree AV block are consistently pathological and should be regarded as an abnormal finding in athletes. Complete heart block can sometimes be mistaken for AV dissociation without block, a circumstance wherein the junctional pacemaker operates at a faster pace than the sinus node, leading to a higher number of QRS complexes compared to P waves. AV dissociation without block represents an expression of autonomic discordance between AV and sinus nodal modulation, yet it is not indicative of pathology. Similar to other functional disturbances, conducting a minor exercise load alongside subsequent ECG recording will demonstrate a resolution of the ECG findings in AV dissociation [11].
Evaluation
Upon the detection of a high-grade AV block, a comprehensive evaluation is essential. This assessment generally incorporates an echocardiogram, prolonged ECG monitoring in everyday activities, and a stress ECG test. Interpretation of these findings guides the need for further investigations, which may encompass laboratory testing and cardiac MRI for a more in-depth assessment. It is imperative to refer the individual to an electrophysiologist for specialized evaluation and management, given the seriousness and potential implications of these cardiac conduction abnormalities [13].
5.11 Multiple premature ventricular contractions
Definition
≥2 per tracing.
The occurrence of multiple premature ventricular contractions (PVCs)– defined as two or more in an ECG strip – is infrequent and is observed in less than 1% of 12-lead electrocardiograms in athletes [36, 46] (Figure 12). Research studies, such as those conducted by Biffi and colleagues in 2002 and Verdile et al. in 2015, have indicated that PVCs often diminish during physical exertion or following periods of decreased physical activity [65, 66]. These studies shed light on the extended medical implications of frequent and intricate ventricular tachyarrhythmias observed in highly conditioned athletes, emphasizing the dynamics of these arrhythmias during varying activity levels and deconditioning phases.
Figure 12.
ECG recording at 25 mm/s. Monomorphic premature beats with wide morphology, indicating their ventricular origin.
Evaluation
Although multiple PVCs are generally benign, their presence can signify potential underlying heart disease [66]. Specifically, the identification of two or more PVCs within a 10-s trace, noted as couplets, triplets, or non-sustained ventricular tachycardia, is considered abnormal and necessitates a more thorough evaluation to rule out underlying structural cardiac abnormalities. At a minimum, individuals presenting with such PVC patterns should undergo an ambulatory Holter monitor, echocardiogram, and exercise stress test. With advancements in technology, the availability of modern, compact, leadless ambulatory recorders facilitates prolonged electrocardiographic monitoring, even during training and competition, enabling the exclusion of complex ventricular arrhythmias [11].
If both the Holter monitor and echocardiogram produce normal results and PVC decrease during exercise, typically, no further assessment is recommended for asymptomatic athletes. Existing research indicates that in competitive athletes with ≥2,000 PVCs per 24 h, about 30% manifested underlying structural heart disease, a notable contrast to the lower percentages of 3% and 0% observed in those with <2,000 and <100 PVCs per day, respectively [65]. Consequently, athletes presenting with ≥2,000 PVCs per 24 h, instances of non-sustained ventricular tachycardia, or an increasing ectopic burden during an incremental exercise test may necessitate additional evaluation. This could involve contrast-enhanced cardiac MRI and electrophysiology studies to more comprehensively assess the cardiac condition.
While some studies have indicated that a reduction in PVC burden with detraining suggests a favorable prognosis, this finding has not been universally corroborated. Therefore, employing detraining as a diagnostic or therapeutic measure is not currently recommended [13].
Supraventricular tachycardia (SVT), atrial fibrillation, and atrial flutter are infrequently observed in resting ECGs among athletes. The occurrence of these arrhythmias in young athletes during ECG screening is extremely low, amounting to only 6 cases out of 32,561 individuals [46]. Nevertheless, their presence is invariably regarded as abnormal and necessitates comprehensive further investigations.
Moreover, atrial tachyarrhythmias may be linked to other critical conditions, including LQTS, Wolff-Parkinson-White (WPW) syndrome, Brugada syndrome, and various cardiomyopathies, underlining the significance of thorough evaluation and assessment in such cases [67].
Evaluation
If a resting sinus tachycardia exceeding 120 beats per minute is observed, it is advisable to conduct a repeat ECG after a period of rest, considering recent exercise or anxiety as potential causative factors. Additionally, an exploration of other underlying etiologies is warranted, including fever, infection, dehydration, stimulant use, anemia, hyperthyroidism, or, albeit rare, underlying cardiac or pulmonary disease [62].
In cases of paroxysmal SVT, obtaining a repeat ECG during the non-SVT episode is advisable if feasible. If maneuvers like the Valsalva maneuver, carotid sinus massage, or the diving reflex are utilized to terminate the arrhythmia, obtaining a rhythm strip can offer insights into the mechanism of the SVT. Comprehensive evaluation should include an echocardiogram, ambulatory ECG monitoring, and an exercise treadmill test.
Upon the identification of atrial fibrillation or flutter, a comprehensive approach is crucial. Initiating an echocardiogram is essential to evaluate potential structural heart disease. Furthermore, adhering to standard guidelines and considering anticoagulation therapy is prudent. To ascertain the nature of the arrhythmia (paroxysmal or persistent) and ventricular rate variations throughout the day, an ambulatory ECG monitor should be utilized. A thorough family history evaluation may shed light on any potential underlying genetic predispositions. Depending on the findings from these assessments, additional diagnostic steps such as cardiac MRI, electrophysiology study with potential ablation, and/or genetic testing should be contemplated, aiming to tailor the management plan accordingly [12, 13].
The presence of ventricular couplets, triplets, and non-sustained ventricular tachycardia always necessitates thorough investigation due to their potential to indicate underlying cardiac pathology or act as precursors to sustained ventricular tachycardia, a condition that may result in sudden cardiac death [68].
Evaluation
In the presence of ventricular arrhythmias, a comprehensive evaluation is imperative. This should encompass a thorough review of the individual’s family medical history, an echocardiogram to assess for potential structural heart disease, and a cardiac MRI to investigate the possibility of arrhythmogenic right ventricular cardiomyopathy or other types of cardiomyopathies. Additionally, utilizing an ambulatory ECG monitor and conducting an exercise ECG test are crucial components of the assessment process.
Based on the outcomes of these initial evaluations, further investigations may be warranted, including the possibility of an electrophysiology study or genetic testing. These steps aim to provide a comprehensive understanding of the condition, allowing for appropriate management and intervention strategies [12, 13].
Interpretation of the athletes’ ECG is of paramount importance to differentiate between physiological and pathological changes. Clearly, too strict ECG criteria will result in false positive findings and wrong disqualification of athletes from sports, while pathological changes considered normal could be falsely reassuring for athletes, which may result in potentially dramatic events. Over the last decades, the classification of the different ECG patterns has been refined with the introduction of training-related patterns and changes due to ethnicity, which has resulted in a consistent reduction of false positive findings without an increased risk of cardiac events.
The 2018 international recommendations for electrocardiographic interpretation in athletes [13] represent a useful guide for physicians who are involved in the evaluation of athletes. Following these recommendations facilitates the assessment of athletes and the decision in terms of fitness for sport while identifying those subjects which can be at risk of fatal cardiac events.
References
1.Basu J, Malhotra A. Interpreting the athlete’s ECG: Current state and future perspectives. Current Treatment Options in Cardiovascular Medicine. 2018;20(12):104. DOI: 10.1007/s11936-018-0693-0
2.Huston TP, Puffer JC, Rodney WM. The athletic heart syndrome. The New England Journal of Medicine. 1985;313(1):24-32. DOI: 10.1056/NEJM198507043130106
3.Oakley CM. The electrocardiogram in the highly trained athlete. Cardiology Clinics. 1992;10(2):295-302. DOI: 10.1016/S0733-8651(18)30245-5
4.Björnstad H, Smith G, Storstein L, Meen HD, Hals O. Electrocardiographic and echocardiographic findings in top athletes, athletic students and sedentary controls. Cardiology. 1993;82(1):66-74. DOI: 10.1159/000175856
5.Storstein L, Bjørnstad H, Hals O, Meen ID. Electrocardiographic findings according to sex in athletes and controls. Cardiologia. 1991;79(3):227-236. DOI: 10.1159/000174882
6.Bjørnstad H, Storstein L, Dyre Meen H, Hals O. Electrocardiographic findings according to level of fitness and sport activity. Cardiology. 1993;83(4):268-279. DOI: 10.1159/000175980
7.Bjørnstad H, Storstein L, Dyre Meen H, Hals O. Electrocardiographic findings of repolarization in athletic students and control subjects. Cardiologia. 1994;84(1):51-60. DOI: 10.1159/000176328
8.Barbier J, Ville N, Kervio G, Walther G, Carré F. Sports-specific features of athlete’s heart and their relation to echocardiographic parameters. Herz. 2006;31(6):531. DOI: 10.1007/s00059-006-2862-2
9.Corrado D, Pelliccia A, Bjørnstad HH, et al. Cardiovascular pre-participation screening of young competitive athletes for prevention of sudden death: Proposal for a common European protocol. Consensus Statement of the Study Group of Sport Cardiology of the Working Group of Cardiac Rehabilitation and Exercise Physiology and the Working Group of Myocardial and Pericardial Diseases of the European Society of Cardiology. European Heart Journal. 2005;26(5):516-524. DOI: 10.1093/eurheartj/ehi108
10.Corrado D, Pelliccia A, Heidbuchel H, et al. Recommendations for interpretation of 12-lead electrocardiogram in the athlete [published correction appears in Eur Heart J. 2010 Feb;31(3):379]. European Heart Journal. 2010;31(2):243-259. DOI: 10.1093/eurheartj/ehp473
11.Drezner JA, Ackerman MJ, Anderson J, et al. Electrocardiographic interpretation in athletes: The “Seattle criteria”. British Journal of Sports Medicine. 2013;47:122-124
12.Sheikh N, Papadakis M, Ghani S, et al. Comparison of electrocardiographic criteria for the detection of cardiac abnormalities in elite black and white athletes. Circulation. 2014;129(16):1637-1649. DOI: 10.1161/CIRCULATIONAHA.113.006179
13.Sharma S, Drezner JA, Baggish A, et al. International recommendations for electrocardiographic interpretation in athletes. European Heart Journal. 2018;39(16):1466-1480. DOI: 10.1093/eurheartj/ehw631
14.Pelliccia A, Maron BJ, Spataro A, Proschan MA, Spirito P. The upper limit of physiologic cardiac hypertrophy in highly trained elite athletes. New England Journal of Medicine. 1991;324:295-301. DOI: 10.1056/NEJM199101313240504
15.Ryan MP, Cleland JG, French JA, Joshi J, Choudhury L, Chojnowska L, et al. The standard electrocardiogram as a screening test for hypertrophic cardiomyopathy. American Journal of Cardiology. 1995;76:689-694. DOI: 10.1016/s0002-9149(99)80198-2
16.Papadakis M, Basavarajaiah S, Rawlins J, Edwards C, Makan J, Firoozi S, et al. Prevalence and significance of T-wave inversions in predominantly Caucasian adolescent athletes. European Heart Journal. 2009;30:1728-1735. DOI: 10.1093/eurheartj/ehp164
17.Pelliccia A, Maron BJ, Culasso F, Di Paolo FM, Spataro A, Biffi A, et al. Clinical significance of abnormal electrocardiographic patterns in trained athletes. Circulation. 2000;102:278-284. DOI: 10.1161/01.cir.102.3.278
18.Sohaib SM, Payne JR, Shukla R, World M, Pennell DJ, Montgomery HE. Electrocardiographic (ECG) criteria for determining left ventricular mass in young healthy men; data from the LARGE Heart study. Journal of Cardiovascular Magnetic Resonance. 2009;11:2. DOI: 10.1186/1532-429X-11-2
19.Sathanandam S, Zimmerman F, Davis J, Marek J. Abstract 2484: ECG screening criteria for LVH does not correlate with diagnosis of hypertrophic cardiomyopathy. Circulation. 2009;120:S647
20.Weiner RB, Hutter AM, Wang F, Kim JH, Wood MJ, Wang TJ, et al. Performance of the 2010 European Society of Cardiology criteria for ECG interpretation in the athlete. Heart. 2011;97:1573-1577. DOI: 10.1136/hrt.2011.227330
21.Calore C, Melacini P, Pelliccia A, Cianfrocca C, Schiavon M, Di Paolo FM, et al. Prevalence and clinical meaning of isolated increase of QRS voltages in hypertrophic cardiomyopathy versus athlete’s heart: Relevance to athletic screening. International Journal of Cardiology. 2013;168:4494-4497. DOI: 10.1093/eurheartj/ehv591
22.Lakdawala NK, Thune JJ, Maron BJ, Cirino AL, Havndrup O, Bundgaard H, et al. Electrocardiographic features of sarcomere mutation carriers with and without clinically overt hypertrophic cardiomyopathy. American Journal of Cardiology. 2011;108:1606-1613. DOI: 10.1016/j.amjcard.2011.07.019
23.Rawlins J, Carre F, Kervio G, Papadakis M, Chandra N, Edwards C, et al. Ethnic differences in physiological cardiac adaptation to intense physical exercise in highly trained female athletes. Circulation. 2010;121:1078-1085. DOI: 10.1161/CIRCULATIONAHA.109.917211
24.Gati S, Sheikh N, Ghani S, Zaidi A, Wilson M, Raju H, et al. Should axis deviation or atrial enlargement be categorised as abnormal in young athletes? The athlete’s electrocardiogram: Time for re-appraisal of markers of pathology. European Heart Journal. 2013;34(47):3641-3648. DOI: 10.1093/eurheartj/eht390
25.Di Paolo FM, Schmied C, Zerguini YA, Junge A, Quattrini F, Culasso F, et al. The athlete’s heart in adolescent Africans: An electrocardiographic and echocardiographic study. Journal of American College of Cardiology. 2012;59:1029-1036. DOI: 10.1016/j.jacc.2011.12.008
26.Calo L, Sperandii F, Martino A, Guerra E, Cavarretta E, Quaranta F, et al. Echocardiographic findings in 2261 peri-pubertal athletes with or without inverted T waves at electrocardiogram. Heart. 2015;101:193-200. DOI: 10.1136/heartjnl-2014-306110
27.Sharma S, Whyte G, Elliott P, Padula M, Kaushal R, Mahon N, et al. Electrocardiographic changes in 1000 highly trained junior elite athletes. British Journal of Sports Medicine. 1999;33:319-324. DOI: 10.1136/bjsm.33.5.319
28.Stein R, Medeiros CM, Rosito GA, Zimerman LI, Ribeiro JP. Intrinsic sinus and atrioventricular node electrophysiologic adaptations in endurance athletes. Journal of American College Cardiology. 2002;39:1033-1038. DOI: 10.1016/s0735-1097(02)01722-9
29.Magalski A, McCoy M, Zabel M, Magee LM, Goeke J, Main ML, et al. Cardiovascular screening with electrocardiography and echocardiography in collegiate athletes. American Journal of Medicine. 2011;124:511-518. DOI: 10.1016/j.amjmed.2011.01.009
30.Haissaguerre M, Derval N, Sacher F, et al. Sudden cardiac arrest associated with early repolarization. New England Journal of Medicine. 2008;358:2016-2023. DOI: 10.1056/NEJMoa071968
31.Baggish AL, Hutter AM, Wang F, Yared K, Weiner RB, Kupperman E, et al. Cardiovascular screening in college athletes with and without electrocardiography: A cross-sectional study. Annals of International Medicine. 2010;152:269-275. DOI: 10.7326/0003-4819-152-5-201003020-00004
32.Kim JH, Noseworthy PA, McCarty D, et al. Significance of electrocardiographic right bundle branch block in trained athletes. American Journal of Cardiology. 2011;107:1083-1089. DOI: 10.1016/j.amjcard.2010.11.037
33.Chen X, Zhao T, Lu M, et al. The relationship between electrocardiographic changes and CMR features in asymptomatic or mildly symptomatic patients with hypertrophic cardiomyopathy. International Journal of Cardiovascular Imaging. 2014;30(Suppl 1):55-63. DOI: 10.1007/s10554-014-0416-x
34.Sheikh N, Papadakis M, Schnell F, et al. Clinical profile of athletes with hypertrophic cardiomyopathy. Circulatory Cardiovascular Imaging. 2015;8:e003454. DOI: 10.1161/CIRCIMAGING.114.003454
35.Tikkanen JT, Anttonen O, Junttila MJ, Aro AL, Kerola T, Rissanen HA, et al. Long-term outcome associated with early repolarization on electrocardiography. New England Journal of Medicine. 2009;361:2529-2537. DOI: 10.1056/NEJMoa0907589
36.Pelliccia A, Culasso F, Di Paolo FM, et al. Prevalence of abnormal electrocardiograms in a large, unselected population undergoing pre-participation cardiovascular screening. European Heart Journal. 2007;28:2006-2010. DOI: 10.1093/eurheartj/ehm219
37.Sheikh N, Papadakis M, Carre F, et al. Cardiac adaptation to exercise in adolescent athletes of African ethnicity: An emergent elite athletic population. British Journal of Sports Medicine. 2013;47:585-592. DOI: 10.1136/bjsports-2012-091874
38.Calore C, Zorzi A, Sheikh N, Nese A, Facci M, Malhotra A, et al. Electrocardiographic anterior T-wave inversion in athletes of different ethnicities: Differential diagnosis between athlete’s heart and cardiomyopathy. European Heart Journal. 2016;37(32):2515-2527. DOI: 10.1093/eurheartj/ehv591
39.Haghjoo M, Mohammadzadeh S, Taherpour M, Faghfurian B, Fazelifar AF, Alizadeh A, et al. ST-segment depression as a risk factor in hypertrophic cardiomyopathy. Europace. 2009;11(5):643-649. DOI: 10.1093/europace/eun393
40.Bent RE, Wheeler MT, Hadley D, Knowles JW, Pavlovic A, Finocchiaro G, et al. Systematic comparison of digital electrocardiograms from healthy athletes and patients with hypertrophic cardiomyopathy. Journal of the American College of Cardiology. 2015;65(22):2462-2463. DOI: 10.1016/j.jacc.2015.03.559
41.Bent RE, Wheeler MT, Hadley D, Froelicher V, Ashley E, Perez MV. Computerized Q wave dimensions in athletes and hypertrophic cardiomyopathy patients. Journal of Electrocardiology. 2015;48(3):362-367. DOI: 10.1016/j.jelectrocard.2015.01.009
42.Uberoi A, Stein R, Perez MV, Freeman J, Wheeler M, Dewey F, et al. Interpretation of the electrocardiogram of young athletes. Circulation. 2011;124(6):746-757. DOI: 10.1161/CIRCULATIONAHA.110.013078
43.Drezner JA, Ackerman MJ, Anderson J, Ashley E, Asplund CA, Baggish AL, et al. Electrocardiographic interpretation in athletes: The ‘Seattle criteria’. British Journal of Sports Medicine. 2013;47(3):122-124. DOI: 10.1136/bjsports-2012-092067
44.Rowin EJ, Maron BJ, Appelbaum E, Link MS, Gibson CM, Lesser JR, et al. Significance of false negative electrocardiograms in preparticipation screening of athletes for hypertrophic cardiomyopathy. The American journal of cardiology. 2012;110(7):1027-1032. DOI: 10.1016/j.amjcard.2012.05.035
45.Le VV, Wheeler MT, Mandic S, Dewey F, Fonda H, Perez M, et al. Addition of the electrocardiogram to the preparticipation examination of college athletes. Clinical Journal of Sport Medicine. 2010;20(2):98-105. DOI: 10.1097/JSM.0b013e3181d44705
46.Marek J, Bufalino V, Davis J, Marek K, Gami A, Stephan W, et al. Feasibility and findings of large-scale electrocardiographic screening in young adults: Data from 32,561 subjects. Heart Rhythm. 2011;8(10):1555-1559. DOI: 10.1016/j.hrthm.2011.04.024
47.Kim JH, Baggish AL. Electrocardiographic right and left bundle branch block patterns in athletes: Prevalence, pathology, and clinical significance. Journal of Electrocardiology. 2015;48(3):380-384. DOI: 10.1016/j.jelectrocard.2015.03.015
48.Fudge J, Harmon KG, Owens DS, et al. Cardiovascular screening in adolescents and young adults: A prospective study comparing the Pre-participation physical evaluation monograph 4th edition and ECG. British Journal of Sports Medicine. 2014;48:1172-1178. DOI: 10.1136/bjsports-2014-093840
49.Daubert C, Ollitrault J, Descaves C, et al. Failure of the exercise test to predict the anterograde refractory period of the accessory pathway in Wolff Parkinson white syndrome. Pacing Clinical Electrophysiology. 1988;11:1130-1138. DOI: 10.1111/j.1540-8159.1988.tb03964.x
50.Cohen MI, Triedman JK, Cannon BC, et al. PACES/HRS expert consensus statement on the management of the asymptomatic young patient with a Wolff-Parkinson-White (WPW, ventricular preexcitation) electrocardiographic pattern: Developed in partnership between the pediatric and congenital electrophysiology society (PACES) and the heart rhythm society (HRS). Endorsed by the governing bodies of PACES, HRS, the American College of Cardiology Foundation (ACCF), the American Heart Association (AHA), the American Academy of Pediatrics (AAP), and the Canadian Heart Rhythm Society (CHRS). Heart Rhythm. 2012;9:1006-1024. DOI: 10.1016/j.hrthm.2012.03.050
51.Klein GJ, Gulamhusein SS. Intermittent preexcitation in the Wolff-Parkinson-White syndrome. American Journal of Cardiology. 1983;52:292-296. DOI: 10.1016/0002-9149(83)90125-x
52.Schwartz PJ, Stramba- Badiale M, Crotti L, et al. Prevalence of the congenital long-QT syndrome. Circulation. 2009;120:1761-1767. DOI: 10.1161/CIRCULATIONAHA.109.863209
53.Meyer L, Stubbs B, Fahrenbruch C, et al. Incidence, causes, and survival trends from cardiovascular-related sudden cardiac arrest in children and young adults 0 to 35 years of age: A 30-year review. Circulation. 2012;126:1363-1372. DOI: 10.1161/CIRCULATIONAHA.111.076810
54.Postema PG, De Jong JS, Van der Bilt IA, Wilde AA. Accurate electrocardiographic assessment of the QT interval: Teach the tangent. Heart Rhythm. 2008;5(7):1015-1018. DOI: 10.1016/j.hrthm.2008.03.037
55.Dhutia H, Malhotra A, Parpia S, et al. The prevalence and significance of a short QT interval in 18,825 low-risk individuals including Athletes. British Journal of Sports Medicine. 2016;50:124-129. DOI: 10.1136/bjsports-2015-094827
56.Drezner JA, Ackerman MJ, Cannon BC, Corrado D, Heidbuchel H, Prutkin JM, et al. Abnormal electrocardiographic findings in athletes: Recognising changes suggestive of primary electrical disease. British Journal of Sports Medicine. 2013;47(3):153-167. DOI: 10.1136/bjsports-2012-092070
57.Zorzi A, Leoni L, Di Paolo FM, Rigato I, Migliore F, Bauce B, et al. Differential diagnosis between early repolarization of athlete’s heart and coved-type Brugada electrocardiogram. The American Journal of Cardiology. 2015;115:529-532. DOI: 10.1016/j.amjcard.2014.11.035
58.Yap YG, Behr ER, Camm AJ. Drug-induced Brugada syndrome. Europace. 2009;11(8):989-994. DOI: 10.1093/europace/eup114
59.Wilde AA, Antzelevitch C, Borggrefe M, Brugada J, Brugada R, Brugada P, et al. Proposed diagnostic criteria for the Brugada syndrome: Consensus report. Circulation. 2002;106(19):2514-2519. DOI: 10.1161/01.CIR.0000034169.45752.4A
60.de Luna AB, Brugada J, Baranchuk A, Borggrefe M, Breithardt G, Goldwasser D, et al. Current electrocardiographic criteria for diagnosis of Brugada pattern: A consensus report. Journal of Electrocardiology. 2012;45(5):433-442. DOI: 10.1016/j.jelectrocard.2012.06.004
61.Priori SG, Blomström-Lundqvist C, Mazzanti A, Blom N, Borggrefe M, Camm J, et al. 2015 ESC Guidelines for the management of patients with ventricular arrhythmias and the prevention of sudden cardiac death: The Task Force for the Management of Patients with Ventricular Arrhythmias and the Prevention of Sudden Cardiac Death of the European Society of Cardiology (ESC). European Heart Journal. 2015;36(41):2793-2867. DOI: 10.1093/europace/euv319
62.Delise P, Allocca G, Sitta N. Brugada type 1 electrocardiogram: Should we treat the electrocardiogram or the patient? World Journal of Cardiology. 2017;9(9):737. DOI: 10.4330/wjc.v9.i9.737
63.Brugada R, Campuzano O, Sarquella-Brugada G, Brugada J, Brugada P. Brugada syndrome. Methodist DeBakey Cardiovascular Journal. 2014;10(1):25. DOI: 10.14797/mdcj-10-1-25
64.Kinoshita S, Konishi G. Atrioventricular Wenckebach periodicity in athletes: Influence of increased vagal tone on the occurrence of atypical periods. Journal of Electrocardiology. 1987;20(3):272-279. DOI: 10.1016/S0022-0736(87)80026-2
65.Biffi A, Pelliccia A, Verdile L, Fernando F, Spataro A, Caselli S, et al. Long-term clinical significance of frequent and complex ventricular tachyarrhythmias in trained athletes. Journal of the American College of Cardiology. 2002;40(3):446-452. DOI: 10.1016/S0735-1097(02)01977-0
66.Verdile L, Maron BJ, Pelliccia A, Spataro A, Santini M, Biffi A. Clinical significance of exercise-induced ventricular tachyarrhythmias in trained athletes without cardiovascular abnormalities. Heart Rhythm. 2015;12(1):78-85. DOI: 10.1016/j.hrthm.2014.09.009
67.Crouse SF, Meade T, Hansen BE, Green JS, Martin SE. Electrocardiograms of collegiate football athletes. Clinical Cardiology: An International Indexed and Peer-Reviewed Journal for Advances in the Treatment of Cardiovascular Disease. 2009;32(1):37-42. DOI: 10.1002/clc.20452
68.John RM, Tedrow UB, Koplan BA, Albert CM, Epstein LM, Sweeney MO, et al. Ventricular arrhythmias and sudden cardiac death. The Lancet. 2012;380(9852):1520-1529. DOI: 10.1016/S0140-6736(12)61413-5
Written By
Yeltay Rakhmanov, Bauyrzhan Toktarbay, Zaukiya Khamitova and Alessandro Salustri
Submitted: 31 October 2023Reviewed: 20 December 2023Published: 05 March 2024