Open Access is an initiative that aims to make scientific research freely available to all. To date our community has made over 100 million downloads. It’s based on principles of collaboration, unobstructed discovery, and, most importantly, scientific progression. As PhD students, we found it difficult to access the research we needed, so we decided to create a new Open Access publisher that levels the playing field for scientists across the world. How? By making research easy to access, and puts the academic needs of the researchers before the business interests of publishers.
We are a community of more than 103,000 authors and editors from 3,291 institutions spanning 160 countries, including Nobel Prize winners and some of the world’s most-cited researchers. Publishing on IntechOpen allows authors to earn citations and find new collaborators, meaning more people see your work not only from your own field of study, but from other related fields too.
This study identifies the importance and ability of geographic information systems and remote sensing technologies to manage and monitor surface water in the Jazan region of Saudi Arabia. This study uses several methods to establish a geographical database for the study area: hydrologic and water quality data, a digital Geographical Information System (GIS) elevation model, the spatial distribution and investigation of water samples in Jazan and watershed delineation and flowing tracing tools. The proposed spatial data architecture attempts to implement flood prevention tools and practical land-use proposals, as well as the design of a computerised GIS database for flood risk assessment and mapping.
MIS Department, College of Business, King Khalid University, Abha, Saudi Arabia
Ahmed Abdelmotlab Ahmed
MIS Department, College of Business, King Khalid University, Abha, Saudi Arabia
Mohammed Ahmed Al-Ghobiri
MIS Department, College of Business, King Khalid University, Abha, Saudi Arabia
Osman Ali Nasr
MIS Department, College of Business, King Khalid University, Abha, Saudi Arabia
*Address all correspondence to: salkhalidi@kku.edu.sa
1. Introduction
In the last half-century, the Earth has faced drastic and spectacular changes in its tidal and planetary movement, as identified by the appearance of natural disasters in the equatorial zones. Governments must address the natural destruction faced by economically growing cities. Scarce planning in the agricultural field, which is controlled by conventional water authorities, has raised the problem of extra development needed in underground water. This revolution has benefited humankind by reducing malnourishment in developing countries and providing drinking water to rural and urban areas, while the lack of prevention in flood water flow and supply of drinking water has had negative ecological impacts on the geographical condition of the land [1].
Water resources play an essential role in providing freshwater for irrigation, industrial activities, and drinking, but extracting the maximum level of groundwater from alluvial aquifers makes them vulnerable to pollution-related activities. This effect has been widely studied [2, 3, 4, 5]. High temperatures, high underground evaporation rates and minimal rainfall define the Kingdom of Saudi Arabia (KSA) as one of the world’s driest countries. Additionally, agricultural advancements and industrial growth play an essential role in forming unmanageable groundwater concepts and mitigating water quality [6].
Many areas of Saudi Arabia consist of hilly, vegetation-free slopes and steep, mountainous terrain. Freshwater management is crucial for this area. The sub-substantial condition in many areas of the KSA has reflected the increased rate of Earth flooding [7, 8, 9, 10, 11, 12, 13, 14].
Water management resource issues are resolved by improving the water supply, non-point source pollination and groundwater-surface quality. Several of these sources require understanding the fundamental features of physical, biological, social, and economic components and better information regarding operating these components together within the watershed [15]. Water management resources are linked to many watershed components, such as rivers, wetlands, and groundwater. This system requires methods to evaluate land use and watershed management operational practises, and watershed simulation models are required to reduce uncertainty in decision making.
According to the study, to interrelate the information of a specific global area, remote sensing technologies provide valuable updates to the spatial information on natural resources and the climatic and geographical conditions of the remote area. GIS integrates and analyses multi-layered spatial information and has a variety of specific formats for effective planning for watershed development, along with Integrated Sustainable Development guidelines and decision rules. Linear Imaging Self scanner (LISS-III) satellites are advanced in collecting data based on land cover hydrogeomorphology, which is essential for water resource planning and development. On the basis of environmental conditions, GIS analyses spatial data integration [16].
The Jazan region, like the rest of the regions of the Kingdom of Saudi Arabia, suffers from the scarcity of available groundwater resources as a result of its geographical location, and a portion of the surface water is lost through a lot of valleys without optimal exploitation, due to the region’s topography and its steep slopes. Therefore, this study sheds light on the possibility of benefiting from surface water and contributing to alleviating the severity of the water crisis in the study area. The problem of the study can be summarised in the following points:
Failure to make maximum use of rainwater in the study area.
The phenomenon of flooding and its negative effects on the infrastructure in the study area.
Late and sudden reporting of flood phenomena.
Traditional mechanisms used to deal with these phenomena.
In addition, after reviewing previous studies that related to this study subject, the researchers believe that there are technical additions that distinguished the study, including:
Using cloud storage technologies, as well as relying on the NoSQL structure, suits such studies, which are characterised by the abundance of data generated from the sensors used in the study, which provides huge data that can be used in future studies.
The study provides smart application interfaces for dashboards that will help in making decisions.
Integrating some machine learning algorithms to predict the values of phenomena in different places in the study area.
The technologies used are free, and the application is available to everyone.
Moreover, the researchers emphasise that this study is a unique contribution to the area of the Jazan region as it has a lot of valleys and very heavy rainfall, especially during summer months.
Therefore, this study can be significant research that can be added to the previous related studies in the application of GIS.
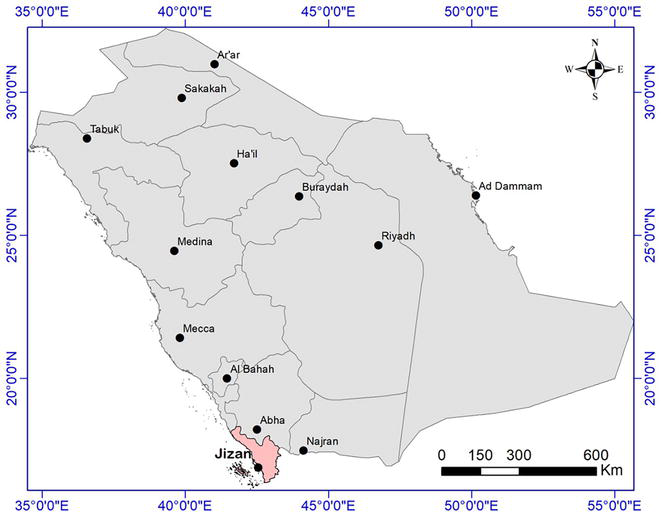
The Jazan region is located in the southwestern part (East: 42–43.8 and North: 16.5–17.0) of Saudi Arabia, consisting of more than 100 islands. Its area is about 13,500 km2. The landform of Jazan is mostly alluvial, with a temperature of about 28C, relative humidity of 62% and annual precipitation of 62 mm. It consists of many valleys and drainage channels directed towards the Red Sea, as shown in Figures 1 and 2.
Figure 1.
Kingdom of Saudi Arabia. Source: [17].
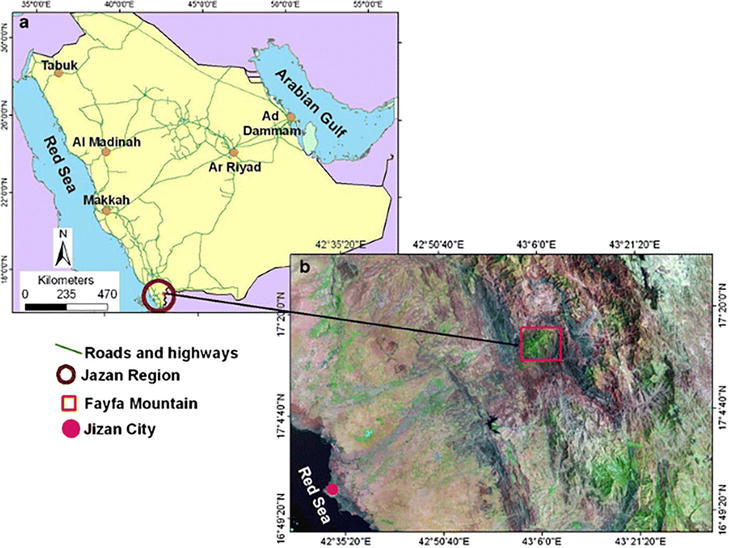
Figure 2.
GIS map of Jazan region, Saudi Arabia [18].
It is situated on the coast of the Red Sea, serves as the region’s most important large agricultural land and is characterised by different environmental and climatic changes. This region consists of several governmental and administrative centres [19].
The economic importance of this Saudi Arabian city lies in its ideal location at the mouth of the Red Sea, where it serves the markets of Europe, Asia and East Africa by transporting raw materials to serve the manufacturing facilities of the Jazan [20]. Rainfall ranges from 100 to 450 millimetres, depending on the elevation of the site, and these rains are often dense and heavy, generating massive and sudden floods due to the rainfall in mountainous areas and steep slopes towards the coast, where the central valleys of the region often run from east to west towards the Red Sea coast. The Jazan region’s climate is highly affected by tropical winds. The coastal plain climate is moderate in winter and hot and humid in summer, resulting in rainfall. Due to Jazan’s environment and seacoast, it is Saudi Arabia’s naval industry hub, and the government also wants to convert it into an agricultural hub due to its rich underground water reserves.
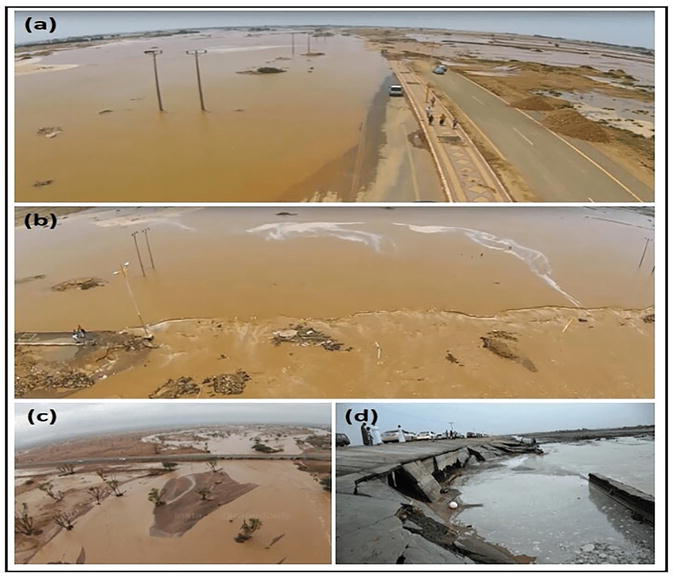
The KSA is highly affected by arbitrary climatic events that cause considerable damage to agricultural zones, railroads, and highways [21]. According to the study, about 34 Million kilometers3 (Mkm3) of water is present on Earth, and 22% of the groundwater accounts for 97% of the potential potable water for human consumption [22], as shown in Figure 3.
Figure 3.
Flood risks on Jizan-Abha highway [20] (a) showing the flooding of the Jazan-Abha road on 15/4/1440 H, (b) showing the flooding of the sides of the road. Picture (c) shows the floodwaters passing under the Jazan-Abha road as a result of the Wadi Bayad floods. Picture (d) shows the Jizan road-Abha collapsing [20].
In arid to semiarid regions where there is low rainfall and limited freshwater resources, there is greater emphasis on the use of groundwater as a source of freshwater. The freshwater acquaintance has an accessible depth, therefore giving rise to salinity, seawater ingression, and water pollution due to over-drafting, which degrades the quality of soil [22, 23, 24, 25].
Geologists and researchers consider remote sensing (RS) and GIS as techniques for evaluating flood hazard impacts and agricultural infrastructural change in mountainous areas [26, 27, 28, 29]. The water resource system requires the assessment and management of geographical activities, requiring the handling of multiple forms of spatial data.
The study uses a systems methodology in designing databases and building the proposed application, as well as a spatial analysis methodology through the following steps:
Obtain a recent satellite image of the area in which the study area is located.
Determine the study area accurately from approved sources of maps and reference them geographically to suit the method of the coordinate system used in satellite images (geographical coordinating system).
Obtain a map of the elevations covering the study area.
Apply mosaic or clip technology to satellite images to cover the study area.
Conduct Hydrologic analysis of the map using ArcGIS Pro.
Determine the proposed locations for the bubble sensors and connect them within a wireless network.
Design a NoSQL database on Google Firebase to store sensor data.
Design a mobile application interface and display and analyse sensor data.
Earth explorer: The tool provides users with the ability to query, search, and request satellite images, aerial photos, and mapping products from several sources.
ArcGIS Pro: Geographic Information Systems technology, through which the following tools were used:
Georeferencing tool: for returning and geometric correction of satellite images.
Geoprocessing tool: To process spatial data.
Hydrologic tool: Tools are used to model the flow of water across the surface.
Firebase: Google’s web and mobile app development platform that helps developers create apps and games that users will love.
Flutter: It is an open-source framework from Google for creating beautiful, locally compiled, cross-platform applications from a single code base.
It consists of a set of thematic maps, such as topographic and level maps. I also used aerial photographs for the year 2022 with a resolution of 15 cm and contour lines with a vertical interval (5 m), and I used the shuttle radar topography mission (SRTM) satellite images from the Earth Explorer website of the study area dated October 16, 2023, a pixel size of 30×30.
GIS offers the most powerful tool for studying the various combinations of locations and enhancing the performance of the simulation models to improve area knowledge. Stimulation models provide decision-making geologists with interactive tools for understanding the physical stem and judging how the installed support system affects the overall system [15].
The most important role is in the development of distributed hydrologic models and an improved understanding of the spatial aspects of the distribution and movement of water in landscapes. The outcomes of administrative policies and management strategies for small plots are mainly focused on watersheds and jurisdictions.
Conversion of such databases into digital form can be accomplished for the future investigation of water distribution, sample collection and utilisation, and for preparing location-specific land and water resource development plans in the GIS environment by implementing such databases with socio-economic data.
10. Determination of hydrologic data and water quality data
Data collection for a water resource management spatial data model is based on a 1:25,000 scale linking drainage, watershed, transport network, surface water bodies, hydrogeomorphology, etc., via GIS and RS technologies. This data includes terrestrial ecosystem, watershed, and river network hydrologic modelling studies.
11. Digital GIS elevation model
The impact of water resource management in GIS is simulated by stimulating the development of source pollution models and the analysis of the predicted movement of water-related contaminants in natural and anthropogenic landscapes. Radar technology is also used to create the potential for hydrologic studies at possible regional scales.
12. Spatial interpolation tools
The data are often distributed with hydrologic and water quality data by using new satellite sensors that work at a finer spatial and temporal resolution to regional climate stations.
13. Potential zone mapping of RS and GIS
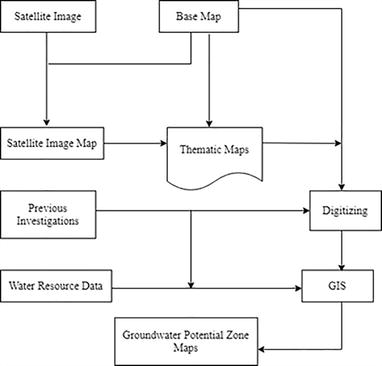
Improved prediction and accuracy of promising locations and their groundwater potential can be gained by identifying pertinent geomorphological and geological metrics, allocating adequate weights, preparing subsequent thematic maps, and using high-quality remotely sensed data. RS- and GIS-based frameworks are shown in Figure 4 for groundwater potential zone mapping.
Figure 4.
RS and GIS mapping.
14. Spatial distribution and investigation of water sample in Jazan
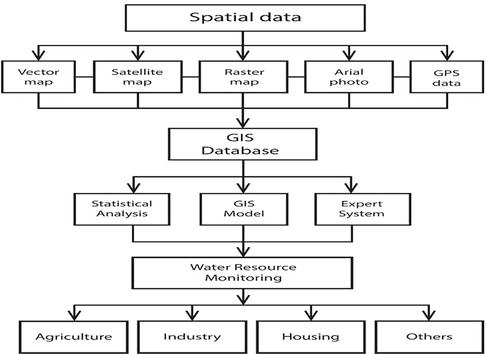
Spatial distribution and the identification of groundwater have different objectives in the Jazan region. Extraction and investigation of water samples from different regions of Jazan were initiated using a modified GIS system. The modified system’s musing geostatistics (kriging) and splines create spatial and spatiotemporal models of land surfaces, climatic phenomena like precipitation and temperature, soil properties, and water quality from measured data. This method was modified according to the regional requirement for proper investigation: (a) the water component layer in the aquifer meets drinking standards; (b) new GIS layers must identify appropriate locations for drinking water in the groundwater aquifer; and (c) significant water components are produced by different component combinations [30]. There are four basic formats for representing and storing data: satellite images, vector maps, aerial maps, and GPS data. These represent cartographic features, much like maps or scaled drawings, with scattered points and lines. Each type of mapping model represents a separate feature class. All of these formatted image files are presented as layers in a GIS database. The information was collected from various sources that facilitate the analysis and formulation of the proposed water resources management model, including agriculture and environmental aspects, to assist in decision-making and developing plans (Figure 5).
Figure 5.
Spatial data for water resources monitoring architecture.
The GIS database system comprises data models that identify the spatial relationships between multiple datasets. They involve an input dataset and a tool for analysing and generating new information, resulting in an output dataset.
15. Water shed delineation and flowing tracing tools
Hydrologic modelling and water resource management require algorithms that support portioning hydrologic units and provide the basic parameters required for flow routing and hydrologic models. Identification of potential sources of non-point source pollution in flow tracing has allowed the simulation of the movement of water, sediment, and other pollutants through landscapes [31] by developing new tools for mapping algebra-supporting computation with spatiotemporal data.
16. Visualisation tools’ impacts on computer cartography
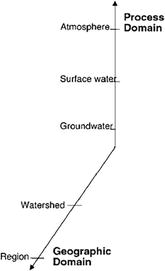
GIS communication of water resource data increases the availability of maps generated efficiently by cartographic tools to visualise the development and present the model in the mountainous or tropical region of Jazan [32]. Many studies are presented to illustrate models of water movement and identify saline and drinking water extraction by modified processes and patterns. (Figure 6).
Figure 6.
Mapping by visualisation tool.
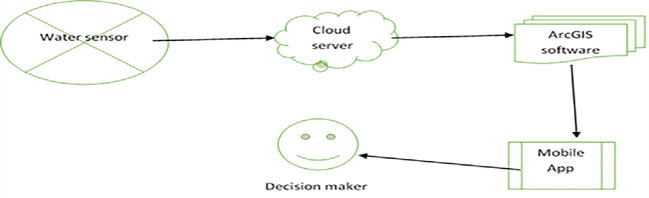
17. System workflow
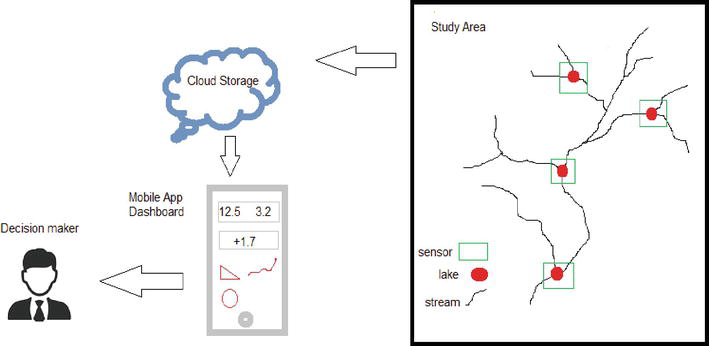
The sensors read the level of water in the lakes and send it to the server.
The server stores the data and sends a copy to the mobile application.
The Oracle App processes data and extracts reports to the mobile application.
The decision-maker takes readings of the statistics and possible predictions and their percentages.
The decision-maker issues appropriate decisions (Figure 7)
Figure 7.
System proposal workflow.
18. Data processing
The obtained datasets have different formats and scales, so to facilitate the precise processing and interaction between them, a GIS database using ArcGIS 10.2 software was developed. All datasets were using the universal transverse mercator (UTM) coordinate system, zone 37. Digital elevation models and topographic maps were used to extract all streams and catchment areas from the images. Interpretation of satellite images was carried out to determine the areas of urban expansion, and HEC-RAS was used to determine the inundation zones. The dark subtraction method was used to reduce the atmospheric effect on the reflectance values using Landsat data imported into ENVI 5.3 software [33]. The stratified random sampling method was then used to assign a proportional number of regions of interest to each land-use class based on its area and homogeneity.
19. Results and discussion
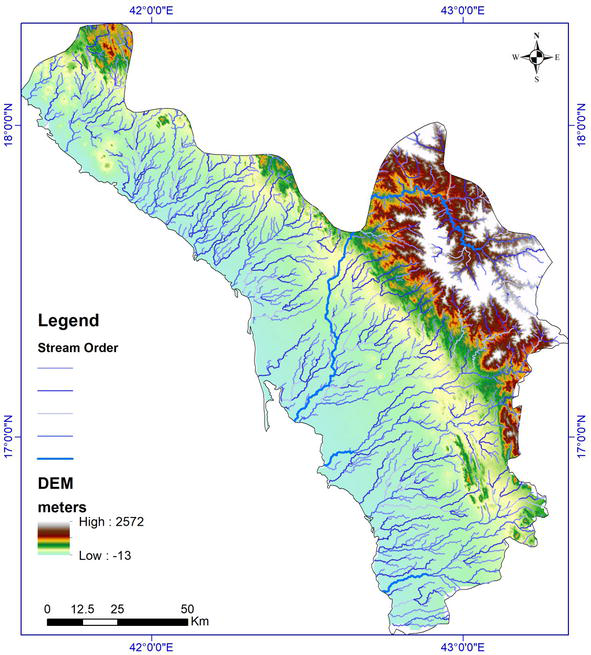
This paper relies on free satellite images (Landsat 8) at the planning stage and can obtain high-resolution images for the implementation stage. Figure 8a shows the part of the study area taken from Landsat 8.
Figure 8.
Base maps.
A set of statistical and spatial procedures was carried out to obtain Figure 8b and get the watersheds in the study area:
Hydrology toolset
Flow direction
Flow accumulation
Flow length
Stream order
Position of Watershed
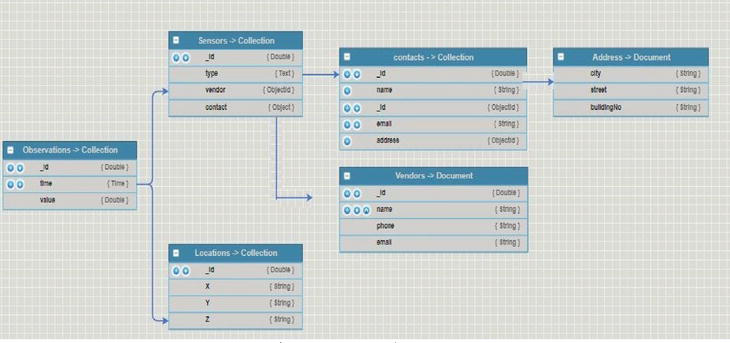
Based on satellite image processing outputs and this study, the layers below were agreed upon, and a geographic database was designed using RS and GIS technologies. These parameters were identified to obtain the appropriate estimation in the software of the regional water resourcing management (Figure 9).
Figure 9.
Database design.
20. Database design
The concept of non-relational databases was relied upon to suit these projects to store and manage the huge data recorded from the readings of the sensors used, and the author also depend on the Firebase-database service.
21. Project hardware and technologies
21.1 Water level sensors
The water sensor reads the water level in the tank and sends the reading over the internet to the proposed server. The water level is displayed in a smartphone app as a vertical bar illustrating the percentage capacity of the water. The app sounds an alarm when the water level reaches a specific value.
21.2 Cloud storage
Firebase will be used for the project database for extracting the water sensors, and cloud storage will be used for the big data.
21.3 ArcGIS and Oracle applications
The Oracle database management system is needed to manipulate the descriptive data (sensors), and ArcGIS software is used to design the necessary layers. Figure 10 shows some of the functions that are included in the project.
Figure 10.
Some of the proposed system functions.
21.4 Android app
The mobile app will be designed to read sensor data and give the decision-maker statistics and predictions. The Ministry of Environment, Water and Agriculture in Saudi Arabia aims to conserve water sources and promote rainfall and surface water to ensure the provision and distribution of water. This can be achieved through specific strategies such as raising public water management standards, managing water resources, rehabilitating water collection and meteorological data collection networks, building multi-purpose dams, and creating water facilities to support growing populations, new towns and villages, industrial cities and agricultural land reclamation.
In addition to hydrological applications, GIS can study rainfall flow systems in the Jazan region and capture watersheds, which will significantly help identify the best distribution of flood wells for the population in these areas. In this way, the best areas for irrigation can be determined, thereby promoting agricultural production and access to water. The GIS approach is also used for water network planning, engineering, operations, maintenance, financing, and management functions. Dam construction requires determining the dam’s location and the lake’s size. GIS can identify the best water conservation practices and address where potential risks may arise.
This study aims to create a database of the morphometric and hydrological characteristics of dry valleys within the Jazan region in Saudi Arabia. Likewise, previous studies have discovered the existence of groundwater in acquirers in Hada Al-Sham [33, 34]. The study by Madani [35] found the problem of probable groundwater demarcation using RS and GIS in the Wadi Yalamlam and Makkah Jurisdiction catchment areas in west KSA. The study by Swain [36] used soil and water assessment tool (SWAT)-based hydrological modelling. Using the stream flow values inside a basin, the hydroelectric potential of that basin is calculated. Therefore, it is crucial to estimate basin stream flow correctly when designing hydroelectric structures. In other words, the runoff values dictate the size and, thus, the cost of these structures (Table 1).
#
Technology
Previous studies and projects
The current study
1
Application interface
Website
Mobile app
2
Database structure
SQL
NoSQL
3
IoT (Internet of Things)
Not available
Available
4
Availability of information
Not available
Available
5
Users
Decision makers
For everyone
6
Artificial intelligence
Not available
Machine learning algorithms
7
The information
Dashboards
Text reports
Table 1.
A comparison between the tools that have been used in similar studies and projects and the current study results to date.
22. Recommendations
After studying the surface water of the Jazan region, several results were carefully discussed, and it was found that GIS and geospatial tools were needed. In addition, this research provides recommendations that could help decision makers in the Ministry of Environment, Water, and Agriculture and its branch in Jazan understand the current situation regarding heavy rainwater and valleys. These recommendations could also help identify processes that would benefit from applying GIS and geospatial tools.
The researchers have visited the dams in Jazan and the multiple valleys that flow to the sea. There is a clear need for GIS and geospatial tools to manage and regulate the flow of rainwater in these valleys. This regulation will take advantage of the rainfall and help to prevent damage to farms and houses.
The agricultural sector in the kingdom uses mostly non-renewable groundwater, with some of its demands met by surface water and renewable groundwater. However, the Saudi Government has introduced some measures to partially reduce excessive pumping from groundwater reserves. The proposed spatial data water management strategy is the most crucial development in this context. The most significant steps include screening the availability of ground resources and the needs of the public and private sectors, assessing the environment, identifying resource areas, data management, decision making, and resource auditing.
The availability of groundwater is a significant issue in Saudi Arabia, and the country faces prolonged problems with drinking water scarcity. To reach self-sufficient levels of water intake, technical and non-technical measures must be linked, including raising public awareness. Based on the proposed architecture, there is a likelihood of a low level of public awareness about the water shortage problem in Saudi Arabia and a lack of measures taken by local water authorities in the Jazan region to address this issue. Extensive work is urgently needed to increase water awareness through media campaigns that explain the importance of water resources.
The findings revealed that urbanisation is the critical factor influencing agricultural regions. Seasonal irrigation water requirements can be handled both within a particular region and over a large area. To optimise water management in irrigation networks, irrigation water supply should be aligned with irrigation water needs. Water distribution between old and cultivated lands should be controlled.
In most cases, the failure of watershed development is significant because adjustments to numerous natural facets result in a lack of natural resource awareness. Scientific surveys should be conducted to generate optimum use of current natural resources such as water, vegetation, and land in the watershed. This will be further used to monitor watershed development in the future.
This research idea is considered a preliminary investigation proposal. Further work is needed to describe water awareness campaigns and offer financial support for implementing the spatial data model structure. Therefore, these researchers support programmes addressing water resources in the Jazan region that use GIS to manage the development of water sources and benefit from modern irrigation technologies.
References
1.Ramirez-Pulido J, González-Ruiz N, Gardner A, Arroyo-Cabrales J. A list of recent land mammals of Mexico. USA: Special Publications of the Museum of Texas Tech University; 2014;63:1-69
2.Su C, Zhu Y, Abbas Z, Huq M. Sources and controls for elevated arsenic concentrations in groundwater of Datong Basin, northern China. Environmental Earth Sciences. 2016;75(7):1-13. DOI: 10.1007/s12665-016-5359-1
3.Huq ME, Su C, Li J, Sarven MS. Arsenic enrichment and mobilization in the Holocene alluvial aquifers of Prayagpur of southwestern Bangladesh. International Bio Deterioration and Biodegradation. 2018b;128:186-194. DOI: 10.1016/j.ibiod.2018.01.008
4.Huq M, Su C, Fahad S, Li J, Sarven M, Liu R. Distribution and hydro geochemical behavior of arsenic enriched groundwater in the sedimentary aquifer comparison between Datong Basin (China) and Kushtia District (Bangladesh). Environmental Science and Pollution Research. 2018a;25(16):15830-15843. DOI: 10.1201/9781351046633-50
5.Huq ME, Fahad S, Shao Z, Sarven MS, Al-Huqail AA, Siddiqui MH, et al. High arsenic contamination and presence of other trace metals in drinking water of Kushtia district, Bangladesh. Journal of Environmental Management. 2019;242:199-209. DOI: 10.1016/j.jenvman.2019.04.086
6.Ahmed I, Nazzal Y, Zaidi FK, Al-Arifi NS, Ghrefat H, Naeem M. Hydrogeological vulnerability and pollution risk mapping of the Saq and overlying aquifers using the DRASTIC model and GIS techniques, NW Saudi Arabia. Environmental Earth Sciences. 2015;74(2):1303-1318. DOI: 10.1007/s12665-015-4120-5
7.Coumou D, Rahmstorf S. A decade of weather extremes. Nature Climate Change. 2012;2(7):491-496. DOI: 10.1038/nclimate1452
8.Mambretti S, De Wrachien D, Sole A. Flood-risk assessment and hazard mitigation measures: Case studies and lessons learnt in Italy. WIT Transactions on Ecology and the Environment. 2008;118:17-26. DOI: 10.2495/friar080021
9.Avinash S. Flood related disasters: Concerned to urban flooding in Bangalore, India. International Journal of Research in Engineering and Technology. 2014;03(28):76-83. DOI: 10.15623/ijret.2014.0328013
10.Bathrellos GD, Karymbalis E, Skilodimou HD, Gaki-Papanastassiou K, Baltas EA. Urban flood hazard assessment in the basin of Athens Metropolitan City, Greece. Environmental Earth Sciences. 2016;75(4):1-14. DOI: 10.1007/s12665-015-5157-1
11.Van Oldenborgh GJ, Otto FEL, Haustein K, AchutaRao K. The massive precipitation event of December 2015 in Chennai, India. BAMS. 2016;97:S87-S91
12.Roxy MK, Ghosh S, Pathak A, Athulya R, Mujumdar M, Murtugudde R, et al. A threefold rise in widespread extreme rain events over Central India. Nature Communications. 2017;8(1):1-11. DOI: 10.1038/s41467-017-00744-9
13.Dottori F, Szewczyk W, Ciscar JC, Zhao F, Alfieri L, Hirabayashi Y, et al. Increased human and economic losses from river flooding with anthropogenic warming. Nature Climate Change. 2018;8(9):781-786. DOI: 10.1038/s41558-018-0257-z
14.Skilodimou HD, Bathrellos GD, Chousianitis K, Youssef AM, Pradhan B. Multi-hazard assessment modeling via multi-criteria analysis and GIS: A case study. Environmental Earth Sciences. 2019;78(2):1-21. DOI: 10.1007/s12665-018-8003-4
15.The National Research Council. New Strategies for America’s Watersheds. Washington, DC: National Academy Press; 1999
16.Chowdary VM, Ramakrishnan D, Srivastava YK, Chandran V, Jeyaram A. Integrated water resource development plan for sustainable management of Mayurakshi watershed, India using remote sensing and GIS. Water Resources Management. 2009;23(8):1581-1602. DOI: 10.1007/s11269-008-9342-9
17.The Saudi Geological Survey (SGS) official portal. [online] Available from: https://www.sgs.org.sa [Accessed: February 25, 2018]
18.Maerz NH, Youssef AM, Pradhan B, Bulkhi A. Remediation and mitigation strategies for rock fall hazards along the highways of Fayfa Mountain, Jazan region, Kingdom of Saudi Arabia. Arabian Journal of Geosciences. 2015;8(5):2633-2651. DOI: 10.1007/s12517-014-1423-x
19.General Authority for Statistics. 2018. Available from: https://www.stats.gov.sa
20.Abdelkarim A, Gaber AF, Youssef AM, Pradhan B. Flood hazard assessment of the urban area of Tabuk City, Kingdom of Saudi Arabia by integrating spatial-based hydrologic and hydrodynamic modeling. Sensors. 2019;19(5):1024. DOI: 10.3390/s19051024
21.Youssef AM, Pradhan B, Sefry SA. Flash flood susceptibility assessment in Jeddah city (Kingdom of Saudi Arabia) using bivariate and multivariate statistical models. Environmental Earth Sciences. 2016;75(1):1-16
22.Foster S. Groundwater: Assessing Vulnerability and promoting protection of a threatened resource. Proceedings of the 8th Stockholm Water Symposium, Sweden. 10-13 Aug, 1998. pp. 79-90
23.Scanlon BR, Keese KE, Flint AL, Flint LE, Gaye CB, Edmunds WM, et al. Global synthesis of groundwater recharge in semiarid and arid regions. Hydrological Processes: An International Journal. 2006;20(15):3335-3370. DOI: 10.1002/hyp.6335
24.Chen J, Qian H, Gao Y, Wang H, Zhang M. Insights into hydrological and hydro chemical processes in response to water replenishment for lakes in arid regions. Journal of Hydrology. 2020;581:124386. DOI: 10.1016/j.jhydrol.2019.124386
25.Chen J, Gao Y, Qian H, Ren W, Qu W. Hydro geochemical evidence for fluoride behavior in groundwater and the associated risk to human health for a large irrigation plain in the Yellow River Basin. Science of the Total Environment. 2021;800:149428. DOI: 10.1016/j
26.Benz UC, Hofmann P, Willhauck G, Lingenfelder I, Heynen M. Multi-resolution, object-oriented fuzzy analysis of remote sensing data for GIS-ready information. ISPRS Journal of Photogrammetry and Remote Sensing. 2004;58(3-4):239-258. DOI: 10.1016/j.isprsjprs.2003.10.002
27.Dutta D, Herath S. Trend of floods in Asia and flood risk management with integrated river basin approach. In: Proceedings of the 2nd International Conference of Asia-Pacific Hydrology and Water Resources Association. Singapore. Vol. 1. 2004. pp. 55-63
28.Gaitan S, Ten Veldhuis MC, van de Giesen N. Spatial distribution of flood incidents along urban overland flow-paths. Water Resources Management. 2015;29(9):3387-3399. DOI: 10.1007/s11269-015-1006-y
29.Chen J, Wu H, Qian H, Gao Y. Assessing nitrate and fluoride contaminants in drinking water and their health risk of rural residents living in a semiarid region of Northwest China. Exposure and Health. 2017;9(3):183-195. DOI: 10.1007/s12403-016-0231-9
30.Naiman RJ, Bisson PA, Lee RG, Turner MG. Approaches to Management at the Watershed Scale. In: Kohm KA, Franklin JA, editors. Creating a Forestry for the 21st Century: The Science of Ecosystem Management. Washington, D.C., USA: Island Press; 1997. pp 239-253
31.Wilson JP, Gallant JC. Digital Terrain Analysis. In book: Terrain Analysis: Principles and Applications. Canada: John Wiley & Sons Inc.; Jan 2000. pp 1-27
32.Mitas L, Mitasova H, Brown WM, Astley M. Interacting Fields Approach for Evolving Spatial Phenomena: Application to erosion Simulation for Optimized Land Use. USA: lllinois University at Urbana Center for Supercomputing Research and Development; 1996
33.Mahmoud SH, Alazba AA. Integrated remote sensing and GIS-based approach for deciphering groundwater potential zones in the central region of Saudi Arabia. Environmental Earth Sciences. 2016;75(4):1-28. DOI: 10.1007/s12665-015-5156-2
34.El-Hames AS. Determination of groundwater availability in shallow arid region aquifers utilizing GIS technology: A case study in Hada Al-Sham, Western Saudi Arabia. Hydrogeology Journal. 2005;13(4):640-648. DOI: 10.1007/s10040-004-0323-7
35.Madani A, Niyazi B, Elfakharani A, Osman H. The effects of structural elements on groundwater of Wadi Yalamlam, Saudi Arabia using integration of remote sensing and airborne magnetic survey. Earth Systems and Environment. 2019;3(2):301-312. DOI: 10.1007/s41748-019-00091-3
36.Swain S, Mishra SK, Pandey A, Pandey AC, Jain A, Chauhan SK, et al. Hydrological modelling through SWAT over a Himalayan catchment using high-resolution geospatial inputs. Environmental Challenges. 2022;8:100579. DOI: 10.1016/j.envc.2022.100579
Written By
Saeed Q. Al-Khalidi Al-Maliki, Ahmed Abdelmotlab Ahmed, Mohammed Ahmed Al-Ghobiri and Osman Ali Nasr
Submitted: 02 September 2023Reviewed: 13 October 2023Published: 11 March 2024