
Abstract
An epidemic of an unknown virus introduces extreme uncertainty and can, as we found in 2020, easily lead to panic reactions. Only data subjected to mathematical analysis—statistical analysis above all else at the outset—can give a quick understanding of the seriousness of the situation and provide the means for immediate contingency planning. To understand the Covid-19 crisis, we used Extreme Value Theory (EVT) techniques that extract information from the tails of distributions, where the information about ‘catastrophic events’ resides. We describe how the information so obtained gave us the predictive power essential for contingency planning very early in the Covid-19 pandemic. We also describe the epidemiological model we developed, which extends the initial statistical work and gives a complete toolkit for predicting the behaviour of a viral outbreak in time to be effective in dealing with it. Finally, we talk briefly about the importance of a readily accessible worldwide population and disease database to aid in the preparation for future emergencies.
Keywords
- predictive power
- mathematical models
- extreme value statistics
- data based
- small data sets
- creation of international database
1. Introduction
One of the main qualities of human beings is the ability to transform the unknown into something manageable, predictable and ultimately controllable. We are surrounded by examples of this, from the astronomical observations of the ancients and millennia of using plants for medicinal purposes to the whole body of empirical knowledge leading to the science we depend on today for all of modern medicine and technology.
For this, we have used observations and experiments, constantly testing our knowledge of how nature works. When this process develops to the level of a theory of why or how things occur, we must verify that our theory is capable of making useful predictions.
Theories which are incapable of prediction have no value in this enterprise, as Feynman so memorably said.
The same empirical knowledge that was used to guide cannon balls into enemy fortifications—then transformed into laws by Isaac Newton—now allows us to send spacecraft to the moon. Because the laws make predictions whose accuracy can be tested, those tests tell us the theory is not accurate enough to send probes to the outer planets—for that, we need Einstein’s refinements. And those, in turn, have had their accuracy proved by observation and experiment.
The same process applies equally to biology and medicine. When a new virus appears, we try all imaginable ways to understand how to deal with it, using models and laboratory experiments and trying new, and old, medicines.
The danger of making assumptions before observing and experimenting is well illustrated by the occurrence of an outbreak of the common cold, a coronavirus, in an Antarctic base after 17 weeks of complete isolation [2]. This example is of particular importance here, since many of the models that have been developed to understand viruses make assumptions about the spread of diseases and, in particular, means for preventing that spread that have never been proven.
That these models have never been validated by testing their predictions against real data was somehow not considered at the outset of the Covid-19 pandemic when they were used to guide public policy.
The most important thing we can do at the beginning of an epidemic is the most basic of all. Make observations and collect and study the primary data, which is the number of infections, the proportion of those that require hospitalisation and the proportion that result in death.
The essential tool in this phase is the statistical analysis of those observations to make provisions for the burden on the medical system. We should do this because it works. And because the fear that hospitals would be overwhelmed led to disastrous public policy decisions almost everywhere.
2. Application of statistics to the virus threat
2.1 What are the right tools? The statistics of the ‘extreme values’
When observing natural phenomena, like the daily maximum temperature in summer, the severity of earthquakes, or deaths caused by viruses, we always have a large cluster of data around the average, the mean value, and we have the ‘tails’, data that is far from the mean.
Averages, as the name indicates, describe ‘the status quo’. No hospital is worried about seeing the average number of patients showing up in the emergency department. The tail of the distribution of hospital admissions, the departure from the average, on the other hand, is what we need to understand to be prepared for bad times.
In a viral epidemic, with rapidly growing numbers of hospital admissions, the important information about daily admissions is how much bigger they are likely to be than the ones we have already observed. That’s what we need to be able to predict.
We are prepared for average-strength earthquakes, with evacuation plans and reinforced buildings, as well as for average years of influenza and other virus infections with hospital capacity, medical supplies and staff capability for the average disease seasons.
To deal with exceptional cases, such as an epidemic of infections with a previously unknown virus, we have to turn to the area of probability and statistics, which is designed to make predictions about events far from the average.
That subject is called Extreme Value Theory. It is what insurance companies use to attempt to set the correct premiums for earthquake insurance or damage from hurricanes, knowing as they do that an event worse than those already observed can be expected to happen someday.
That’s completely analogous to our hospital admissions problem. On 3 March 2020, New York City recorded its first Covid-19 hospital admission. On 13 March, 145 Covid-19 patients were admitted, and by 19 March the daily number had ballooned to 571. Two days later, Governor Cuomo made his fateful ‘Pause’ order, shutting down the city and the state. He had been advised by Imperial College modellers that ‘unless drastic measures were taken—intensive care units would have 30 Covid patients for every available bed’ [3, 4].
In the event, by the end of March, admissions had peaked at 1835 in a single day and began to subside.
The question that the mayor and governor would have liked the answer to on 19 March, when the then frightening level of 571 daily admissions had been reached, were: How many admissions should we expect on a day that exceeds 571, the largest number at that point?
Imperial College modellers did not know how to answer [5]. For that, we need statistics.
2.2 The statistics of ‘How much worse can it get?’
On 19 March 2020, when 571 Covid-19 patients were admitted, everyone would have liked to know the answer to this question.
Of course, nobody can give an exact answer—but using statistics, we can give the answer on average. In other words, it is perfectly possible to answer the question: ‘Over the days when more than 571 people are admitted, what will the average admissions be?’ On 19 March 2020, our answer would have been 1246. Over the next 2 months, there were 34 days with more than 571 admissions, but their average never exceeded our estimate by more than 15%.
To provide these answers, we use a variant of the subject called Extreme Value Theory (EVT).
Unfortunately, for NYC and the rest of the world that was affected by Covid-19, there is no possibility of conventional EVT [6] addressing a problem with so little data. EVT has largely been applied to actuarial or financial problems where huge data sets of observations are available.
As it turns out, we discovered a new approach to EVT that we have been using for many years to make good predictions about the tails of even very small data sets. We proved, too late to help New York in 2020, that our methods provide reliable estimates of the size of Covid-19 outbreaks from the outset in NYC and elsewhere to the endemic phase. Now our methods have been available for almost 2 years and should be in use to help deal with the ongoing Covid-19 crisis.
2.3 The mathematical idea
From the outset, there was significant controversy about the degree to which Covid-19 was unprecedented, especially as the public policy responses were unprecedented [7]. Headline numbers of deaths appeared worldwide with no context, no reference to normal seasonal mortality.
Was Covid-19 an average epidemic, or were these numbers far above average? But what does it mean to be ‘far above the average’? We saw many discussions about the ‘departure from the average number of deaths or the average over the most recent five years,’ but the average does not convey the variability of the historical record. Even worse was the assumption that the standard deviation from the 5-year average was a useful indicator of what was happening in the spring of 2020.
When we started considering this problem in April 2020, we used our standard approach of working purely with data, making no assumptions. We compared weekly Covid-19 deaths in 2020 with weekly deaths from all causes over the same period from all previous years where the data was available [8].
Working with no assumptions gives us a unique window into the problem of virus infections. We look at the information given by the data, which is what already happened, and find an estimative of what is likely to happen on average. We cannot possibly say what will happen on a certain day or how large or small it is going to be, but we can say what is likely to happen. Enough to make predictions, which is the hallmark of good science.
2.4 Immediate evaluation of the seriousness of the threat
It’s easy to calculate the difference between the 5-year average weekly deaths in England and Wales in the second week of April (10,520) and the number of deaths recorded in the second week of April 2020 (18,516). The fact that deaths recorded in this particular week were 76% above the 5-year average conveys absolutely no information.
To make any meaningful inference about the deaths in the second week of April 2020, you needed to know how much variability there is in the weekly death data.
To exemplify what can be done at the first level, when we have deaths’ data but not likely enough data related to a new virus, we will mention two studies we did.
I like to say we wanted to know if this new virus was something that comes from Mars and is so completely unforeseeable, or if it could be seen as a consequence of changes in life.
The critical question to ask is how likely it is that the maximum number of weekly deaths observed so far will be exceeded, and if it is, what the average excess will be [9].
To verify the accuracy of our tools, we did a test of the robustness of the method using weekly Brazilian data to see if the 2016 peak was predictable by looking at the ‘in-sample’ period from January 2001 to the end of 2015. The worst week in the in-sample period was 26,172 in June 2015.
The key question is how bad the situation can get if this maximum from June 2015 is exceeded. According to our analysis, if the situation got worse, the average excess deaths would be 28,629. Indeed, in June 2016, a new record week was recorded. The number of deaths was 28,709. In 2016, 2017 and 2018, there were 33 weeks exceeding the previous maximum of 26,172, and the average number of deaths in those weeks was 26,989—only 6% lower than our prediction.
We proceeded with the same study for Brazil using weekly data from 2001 to 2018 [10], and for some European countries, Denmark, the Netherlands, Sweden and the UK., the records we have start in 2007, 1995, 2000 and 2010, respectively [11]. Using this data until the end of 2019 did allow us to make predictions for 2020 that were in very good agreement with reality.
What we found out is the number of deaths in 2020 was indeed high, but predictable, that is, compatible with what has been seen before.
2.5 Bounds on growth for hospital admissions: an essential tool for contingency planning
As soon as we had some data about Covid-19, we could do some estimations of the growth of the virus. We used all the data available, which was not a lot, but we managed to create bounds of growth that have been proven to be predictive.
The method we are going to describe here can be used for all sorts of planning: infections, deaths, hospitalisations, hospital beds, equipment and personnel.
As we already described, the idea is to use a statistical technique for making estimates far from the mean. We observed Covid-19 waves separated by only 3 weeks, so our standard approach during the endemic phase has been to use 3 weeks of hospital admissions data to estimate bounds on growth for the next few weeks.
At the outset of the epidemic, or in any new epidemic, we may have even less data available. For example, as we discussed in Section 2.1, on 19 March 2020, 2 days before Governor Cuomo’s ‘Pause’ order went into effect, we would have had only 17 days of hospital admissions to advise the governor what to expect—and it would have been enough.
As we described before, the idea is to take the sample maximum and find Level 1, the average number of admissions conditional on exceeding this maximum. This calculation gives us our first bound on cumulative admissions, which is linear growth at Level 1 admissions per day.
Level 2 is the calculated average conditional on exceeding Level 1, and Level 3 is the calculated average conditional on exceeding Level 2. Linear growth at Level 2 and Level 3 admissions per day will be used once the Level 1 growth bound is exceeded by 10% or more.
Note that as long as average admissions over K days are less than or equal to Level 1, then simple arithmetic means that the sum of those admissions over K days must be less than or equal to K times L1—exactly the result of linear growth at L1 admissions per day. We can see in the sample below (Figure 1), which was based on 21 days of hospital admissions in England until 5 December, that the hospitalisations were well within the bounds. When we made this estimate, the UK government was being pressured to ‘cancel Christmas’ by its scientific advisors who had vastly overestimated the impact of the Omicron variant [12].
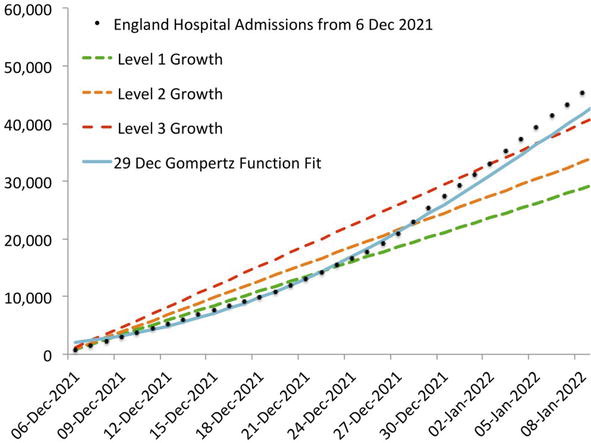
Figure 1.
The 29 December 2021 Gompertz function fit’s prediction errors never exceeded 9.2%. The level 3 bound was only breached in the first week of January, after our target level of predictive power had been achieved.
It is very important to note that we have been making accurate predictions, as illustrated above, in real time for English hospitalisations since November 2021. A more detailed description of our predictions, with the EVT bands for the beginning of the waves and including the epidemiological model that we describe below, can be seen in [13].
2.6 An epidemiological study of viral growth that makes accurate predictions
We have shown that the epidemic curve of cumulative events in viral outbreaks is a Gompertz function. This is a ‘first law of virus dynamics’ that is analogous to the observation by Galileo that projectiles follow parabolic paths. It does not explain why that’s the path followed—but it allows accurate predictions to be made. A Gompertz function fit to observed data can be projected forward to predict future growth—at first for a few days and then for weeks at a time.
Not only does this model correctly describe the Covid-19 outbreaks, but also all the viral outbreaks of the past for which we have been able to obtain data, and most recently, the monkeypox epidemic (Figure 2).
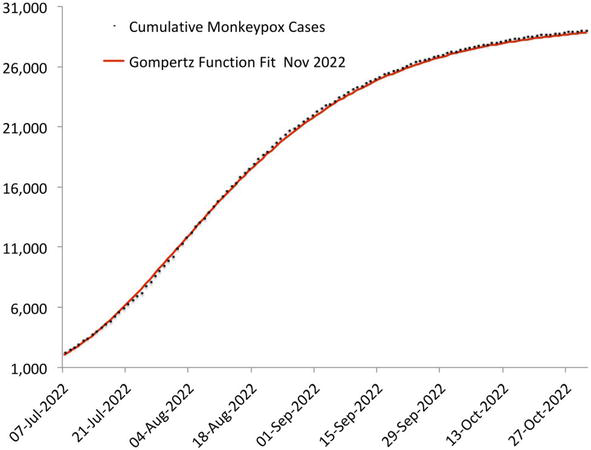
Figure 2.
Cumulative US monkeypox cases, July to November 2022.
In cases such as monkeypox, the initial outbreak leads to a series of Gompertz function ‘approximations’ (fits made by non-linear regression from observed data) which rapidly converge to their final form. In cases such as Covid-19, the Spanish influenza pandemic or seasonal influenza, the initial Gompertz function growth is followed by a linear growth.
These two modes alternate, creating what everyone knows as the seasonal influenza cycle and what was observed initially as successive ‘waves’ of Covid-19 outbreaks.
This model is a stark contrast to the ‘state of the art’ compartmental models, whose proponents are careful to explain that their models are producing ‘scenarios’ and not predictions [14].
Our model, which was published on 26 December 2021 [15], was discovered by working with data from viral outbreaks, with no assumptions and with the goal of making predictions that were accurate enough to be useful during an epidemic. As we have said before, a mathematical model must be able to make accurate predictions to be valid.
Previous attempts to use the Gompertz function to predict the course of the Covid-19 outbreak, such as Michael Levitt’s [16], failed this test because their authors missed the significance of the transition to linear growth—indicating endemic disease.
There is no way to predict the timing of this transition, so it was never possible to predict the outbreak fully simply by identifying the final Gompertz function fit.
Once the transition is made, linear extrapolation gives excellent predictions until the next outbreak. This is marked by a sharp increase in the slope of the line of best fit. At that time, we use the statistical techniques described above on the most recent 21 data points to provide bounds on the growth of the new outbreak. This gives excellent predictions until the next Gompertz function phase is sufficiently well established. This typically takes 3 to 4 weeks.
During the Gompertz function growth phase, a series of Gompertz function fits to cumulative admissions data allows us to make predictions by extrapolating forward along the fitted curve. The prediction errors become smaller and remain smaller for longer as the outbreak progresses. Typically, within about 2 weeks, prediction errors remain below 25% for at least a week out of the sample, and in 3 to 4 weeks, the errors will remain below 10% for at least that long. Our growth bounds are created when we detect a transition from linear growth to the next Gompertz function outbreak phase. They are intended to contain cumulative admissions until the Gompertz function fits’ prediction errors remain below 10% for at least a week.
We refer again to [13] for a full description of the complete process.
For the first time since March 2020, a combination of our model with the EVT methods presented here provides a means to navigate successive waves of Covid-19 with reliable projections for the short- to medium-term future.
All Covid-19 events, cases, hospitalisations, ICU admissions and deaths can be forecast accurately, first for a few days and then for weeks at a time with increasing precision as outbreaks progress.
To develop our model, we were greatly inspired by what we saw in the annual cycle of endemic influenza—something that records of the Portuguese National Health Service show clearly.
In brief, the problem of forecasting Covid-19, and other viruses, is reduced to:
Using EVT to provide bounds on growth over the period (approximately 3 weeks) before the Gompertz function’s predictive power develops;
Identifying the switch to Gompertz function growth;
Identifying the end of the outbreak and return to linear growth.
2.7 Two ongoing applications
We have been making accurate real-time predictions of Covid-19 hospital admissions in England since November 2021 (as we indicated in subsection 2.5). They have, as our model established, continued to alternate between Gompertz function growth and linear growth [17].
To anticipate demand on the health system, each time we detect a transition from linear growth to a new outbreak, we use our statistical analysis to provide linear growth bounds.
The most recent outbreak in England was detected using the data up to 21 July 2023, when we observed a strong departure from the linear trend that had been present for many weeks. Figure 3 shows the growth bounds we estimated then as well as the most recent Gompertz function fit.
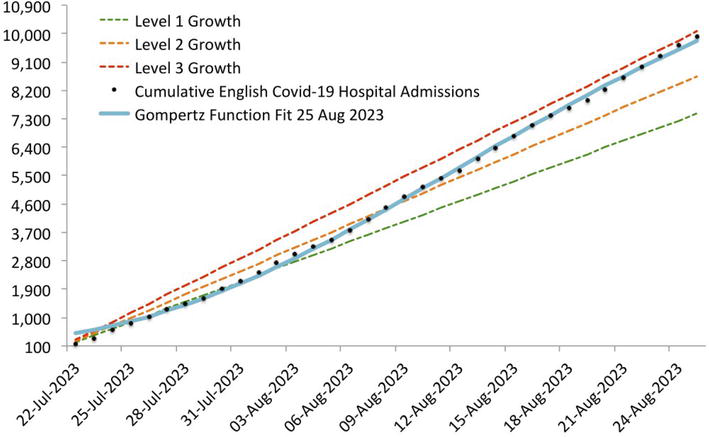
Figure 3.
Growth bounds in English hospitalisations, July to august 2023.
We have also been following Covid-19 hospital admissions in Florida and the predictions of the CDC Centre for Forecasting and Outbreak Analytics [18].
We detected the beginning of what seems likely to be a small outbreak in Florida from the CDC data for hospital admissions up to 14 July 2023.
Figure 4 shows the prediction that the CDC made on 14 July and the daily admissions from 15 July to 18 August 2023.
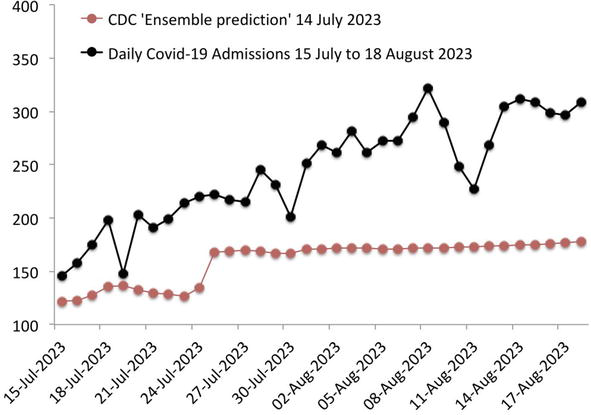
Figure 4.
Prediction made by CDC on 14 July 2023 for daily admissions from 15 July to 18 August 2023.
Figure 5 shows the growth bound we established then, together with cumulative hospital admissions and cumulative admissions from the CDC’s predicted daily values.
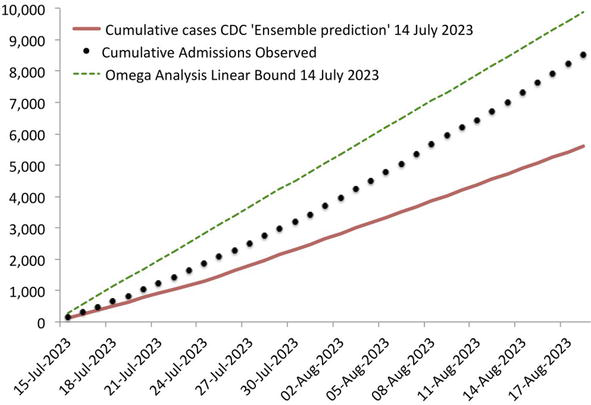
Figure 5.
Shows the growth bound established on 14 July 2023, together with cumulative hospital admissions and cumulative admissions from the CDC predicted daily values.
As of 18 August, cumulative Covid-19 hospital admissions were 15.6% lower than our linear growth bound.
They were more than 52% above the level the CDC predicted. We know what Feynman would say.
To allow the readers to test their own statistical tools, we are annexing a table with the Florida Covid-19 hospital admissions from 15 July to 21 August 2023, data that was used to build our Florida graphs. Figure 4 illustrates our point that the CDC prediction is very poor when verified against the data. In Figure 5, we draw the statistical bounds that are calculated, finding the average excess conditional on what has been already observed (Figure 6).
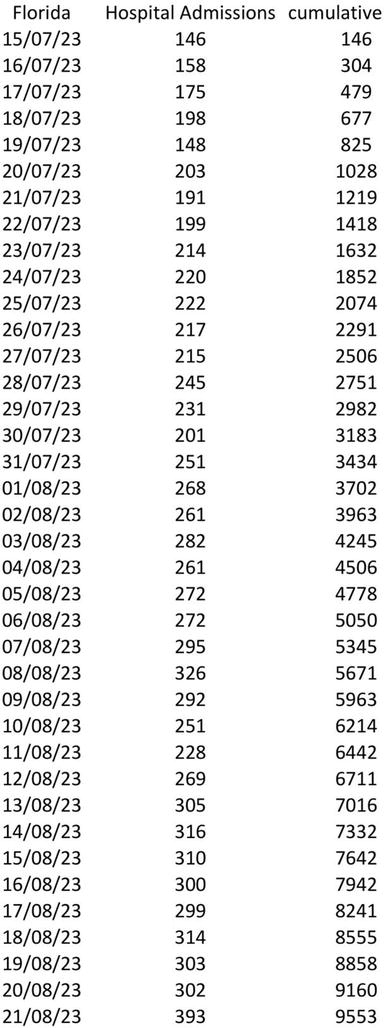
Figure 6.
Florida hospital admissions from 15 July to 21 August 2023.
3. Conclusion
Only data, subjected to mathematical analysis—statistical analysis above all else at the outset—can give a quick understanding of the seriousness of the situation and provide the means for immediate contingency planning.
Acknowledgments
The authors thank Impa, Brazil, for their hospitality while this research was carried out.
Appendix
A. A small note about our epidemiological model discoveries
It is important to stress the necessity of building models that relate to actual data. For us, this means two things: no assumptions about the facts and verifying that the model is actually able to make predictions.
In our epidemiological model, we studied different viruses, in different countries and different time periods. We always used our scientific standard of applying the theory to part of the data, and then we verified that the model has significant predictive power for epidemics, from cholera in 1853 to the Spanish Flu in 1918 and Ebola in 2014, to the acute phase of annual outbreaks of endemic influenza and the Covid-19 pandemic. See Ref. [19] for a non-technical version of our model for the accurate prediction of Covid-19.
B. The importance of a readily accessible population and disease database
One important piece of information that did allow us to fully build the model was influenza’s data that we obtained from the Portuguese medical service. The Portuguese data describe cases of influenza that were severe enough that the patients would look for a doctor, who would then diagnose the cases, and a very good database was created. These data show the complete cycle of influenza and give us a blueprint to follow. A good reference for the seasonality of influenza is the work of Hope-Simpson [20].
As mathematicians, we had no idea of the difficulty of obtaining data about viruses. We discovered that the WHO collects data from all countries, writes reports with its conclusions, but does not carry a database.
It makes us think of Tycho Brahe and of all the men who devoted their lives to observing and recording the sky. It makes us think of all the discoveries that were made possible by his work.
A database of observations is a repository of knowledge. It is where scientists can look for patterns, for information on where to base theories and then test them.
References
- 1.
Feynman RP. Cornell University Lecture, 1964. Available from: https://twitter.com/ProfFeynman/status/1380722165033562113 [Accessed: August 25, 2023] - 2.
Allen TR, Bradburne AF, Stott EJ, Goodwin CS, Tyrrell DAJ. An outbreak of common colds at an Antarctic base after seventeen weeks of complete isolation. The Journal of Hygiene, Cambridge University Press. 1973; 71 :657-667. DOI: 10.1017/s0022172400022920 - 3.
Tierney, J. The Panic Pandemic. 2022. Available from: https://www.realclearpolicy.com/2022/07/04/the_panic_pandemic_840617.html #! [Accessed: August 25, 2023] - 4.
Imperial College Covid-19 Response Team. Report 9: Impact of Non-Pharmaceutical Interventions (NPIs) to Reduce COVID-19 Mortality and Healthcare Demand2020. p. 7. Available from: https://www.imperial.ac.uk/media/imperial-college/medicine/sph/ide/gida-fellowships/Imperial-College-COVID19-NPI-modelling-16-03-2020.pdf [Accessed: September 3, 2023] - 5.
Cascon A, Shadwick WF. Rapid response to: Role of mathematical modelling in future pandemic response policy. British Medical Journal. 2022; 378 :e070615. DOI: 10.1136/bmj-2022-070615 Available from:https://www.bmj.com/content/378/bmj-2022-070615/rr [Accessed: August 25, 2023] - 6.
De Haan L, Ferreira A. Extreme value theory: An introduction. Springer Series in Operations Research, I. 2006.DOI: 10.1007/0-387-34471-3 - 7.
Ioannidis JPA. A fiasco in the making? As the coronavirus pandemic takes hold, we are making decisions without reliable data. Stat Reports. 2020. Available from: https://www.statnews.com/2020/03/17/a-fiasco-in-the-making-as-the-coronavirus-pandemic-takes-hold-we-are-making-decisions-without-reliable-data/ [Accessed: September 3, 2023] - 8.
Cascon A, Shadwick WF. We Can’t Gauge the Impact of Covid-19 by Averaging Data Over the Past Five Years. The Telegraph Oped; 2020. Available from: https://www.omegaanalysis.com/_files/ugd/9406d8_58bc01e112774f79975f2b79522d9029.pdf?index=true [Accessed: September 2, 2023] - 9.
Cascon A, Shadwick W F. Minicurso - A Short Course on the Geometry of Probability Distributions. 2023. Available from: https://www.youtube.com/playlist?list=PLo4jXE-LdDTTOvPRBuSUcCJHyZOzpsVDn [Accessed: August 10, 2023] - 10.
Cascon A, Shadwick W F. Analysis of Weekly Deaths from all Causes in Brazil Puts into Context the Headline Number of Deaths Attributed to the Corona Virus. 2020. Available from: https://www.omegaanalysis.com/_files/ugd/9406d8_0cd9a0082ba4414cba7672d62c930be0.pdf?index=true [Accessed: August 10, 2023] - 11.
Cascon A, Shadwick W F. Analysis of Historic Weekly Data on Deaths from all Causes in Denmark, the Netherlands, Sweden and the U.K.(England and Wales). 2020. Available from: https://www.omegaanalysis.com/_files/ugd/9406d8_0cd9a0082ba4414cba7672d62c930be0.pdf?index=true [Accessed: August 10, 2023] - 12.
Mason, R. et al, Boris Johnson Contradicts Expert Advice to Curb Christmas Socialising The Guardian. 2021. Available from: https://www.theguardian.com/world/2021/nov/30/boris-johnson-contradicts-expert-advice-to-cancel-christmas-socialising [Accessed: September 3, 2023] - 13.
Cascon A, Shadwick W F. Predicting Covid-19 Hospital Admissions in England. 2022. Available from: https://www.omegaanalysis.com/_files/ugd/9406d8_7a434209686c4dd0803a28bc5137df6d.pdf [Accessed: August 10, 2023] - 14.
Medley, G. 2021. In Defence of Sage’s Models. 2021. The Spectator. Available from: https://www.spectator.co.uk/article/what-the-media-gets-wrong-about-sage-s-models/ [Accessed: August 10, 2023] - 15.
Cascon A, Shadwick WF. Predicting the Course of Covid-19 and Other Epidemic and Endemic Disease2021. Available from: https://www.medrxiv.org/content/10.1101/2021.12.26.21268419v1 [Accessed: August 10, 2023]. DOI: 10.1101/2021.12.26.21268419 - 16.
Levitt M, Scaiewicz A, Zonta F. Predicting the Trajectory of Any COVID19 Epidemic From the Best Straight Line. Available from: https://www.medrxiv.org/content/10.1101/2020.06.26.20140814v2 [Accessed: August 10, 2023]2020. DOI: 10.1101/2020.06.26.20140814 - 17.
UK Government Coronavirus Hospital Admission Data. Available from: https://coronavirus.data.gov.uk/details/healthcare?areaType=nation&areaName=England [Accessed: September 3, 2023] - 18.
CDC. COVID-19 Forecasts: Hospitalizations. 2023. Available from: https://www.cdc.gov/coronavirus/2019-ncov/science/forecasting/hospitalizations-forecasts.html [Accessed: September 2, 2023] - 19.
Cascon A, Shadwick W F. Predicting the Unpredictable. 2022. Available from: https://www.omegaanalysis.com/_files/ugd/9406d8_4c2f428f7d6d45de803a57dab416589b.pdf [Accessed: August 10, 2023] - 20.
Hope-Simpson RE. The role of season in the epidemiology of influenza. The Journal of Hygiene, Cambridge University Press. 1981; 86 :35-47. DOI: 10.1017/s0022172400068728