
Abstract
One aspect of climate variability is the shift in seasonal change, with a given season arriving early or late. However, this shift in season is location-dependent and affects local ecology. Over subpolar regions, the change in temperature is very much associated with the regional and local variability of snow-caps, sea ice near the pole, pole-ward transportation of heat, cloud cover, and wind circulation. Based on a 36-year analysis of skin temperature, we found that the lowest temperature occurred in March rather than in February. Additionally, the maximum snow cover day has shifted from March 12 to March 17 in the last 3 to 4 decades. A plausible reason for the late accumulation of ice/snow over the Arctic/Alaskan region may be due to the multi-scale interactions between multi-decadal oscillations, for example, North Atlantic Oscillations (NAO) and climate change.
Keywords
- seasonal shift
- snow caps
- multi-decadal oscillations
- Alaska region
- climate change
1. Introduction
Since 1978, NASA satellites have been monitoring the variability of polar ice and snow. Around and over Alaska, seasonal accumulation of ice and snow is an important aspect of the seasons. The Arctic region is experiencing climate change faster than anywhere else on Earth [1]. Arctic ice melt is the complex feedback process that involves poleward movement of heat (from the ocean and atmosphere), moisture transportation, cloud formation, and surface albedo. An enhanced moisture transport and latent heat from the subpolar region to the polar region drive sea-ice retreat and low-level cloud formation for surface warming [2]. The rapid change in Arctic ice impacts the environment, ecosystems, economies, and local communities. In fact, sea ice starts to melt if the temperature rises above freezing point, while undersurface water remains above freezing in Alaska and the Arctic region. After winter, the sun starts to migrate from the southern hemisphere to the Northern Hemisphere. The Arctic region carries seasons around 9 months of winter (long, icy, and dark), around 3 months of summer (short, very cool, and bright), and spring and Autumn for a few weeks. In the transition months (February and March), the heat from the growing temperature is utilized in melting the sea-land ice. It lowers the warmth in summer over the region. The melting and thawing of ice levels led to the formation of new wetlands and ponds over the Tundra region. Climate change might alter the frozen regions into warmer, less frozen regions, thus producing an uncertain future for the Arctic [3]. In addition, March and September are the months of maximum and minimum snow cover over the Arctic Circle regions. The seasonal variation of ice extent over Arctic ice is more than Antarctic region, although the Northern Hemisphere gets more snow than the counterpart southern hemisphere.
The variability of temperature is one of the intriguing crises and worries of the world community. The underlying arctic amplification feedback includes ice-albedo feedback, cloud feedback, and others [4]. This feedback of the greenhouse effect and ice-albedo contribute to around 75 and around 25%, respectively [5]. Basically, the influence of greenhouse gases and other feedback mechanisms on climate change was foresighted long back by many researchers [6, 7]. Screen and Simmonds noted warming over the Arctic faster than the rest of the globe in the last few decades and evident warming in seasons in conjunction with sea ice decline [8]. The surface temperature warming appears to be during the season change and is linked with atmospheric and ocean heat, circulation, and moisture transport [9]. Increasing air temperature and sea temperatures continue to trigger changes in the Arctic region. The Arctic is warming at twice the rate of anywhere else on Earth, which is also known as Arctic amplification. In Global oceans, the problem of coral bleaching is linked to an increase in ocean temperature. Another issue is related to Polar bears, who depend on sea ice extent and thickness for their basic needs, for example, dens, food, and mating. The loss of sea ice is affecting populations of polar bears, and walruses’ populations, and their health, as mentioned by Kathy Crane (NOAA).
The rise in temperature is attributed to greenhouse gases, pollution, and anthropogenic reasons [5]. The variation in the surface temperature greatly influences the sea ice and land snow cover. In turn, variability of the snow cover and sea ice extent influences the temperature variation on seasonal and local scales. Every year the sea ice and snow cover are reduced to a minimum extent and the surface temperature is increasing. Every year there is a time when the snow cover is maximum, which has a great influence on the winter season of a region nearby.
In response to climate change, the Arctic region is experiencing a great rise in surface temperature [4, 10]. The climate and ecological aspect of the region is susceptible to tipping points due to the loss of sea ice [11]. Most of the models underestimated the projection of the fast decline of sea ice [12]. Data from NASA show that average surface temperatures across the Arctic Ocean and air increased an average of 0.16 and 0.09°C/yr. from 2003 to 2013 [13]. In another study, it is revealed that the Arctic has been experiencing warmer and wetter since 2001 [14]. The reason for such an environment is linked to sea-ice melt and evaporation of water from ice-free ocean (open-water). They further added that due to moisture and heat feeding into the Arctic-wide, the trend of early melt and later freeze will likely continue.
Owing to temperature changes, the observed and projected fluctuations in seasonal temperature might have a deep impact on animals, flora and fauna, economic activities, and ecosystems [15]. Increasing air temperatures, sea surface temperatures, declining reflectivity at the surface, shrinking spring land snow cover, summer sea ice, and declining populations of polar bear populations are among many observations being made in the Arctic region (Arctic Report card 2014). Along with the influence of Ocean-Atmospheric variability on Arctic ice melt, decadal-scale models of variability, for example, Atlantic Multidecadal Oscillation and Pacific Decadal Oscillation were also implicated in Arctic sea-ice variability [4].
The significance of this work is quite large since we are addressing an atmospheric signal, from the recent Arctic melt. The largest warm temperature in the tropical troposphere resides in the monsoon near 25oN. The circulations from this region can reach Central Asia and eventually the Arctic, with a substantial increase in the meridional heat flux over the Arctic Circle [16]. The objective of this research work is to assess and relate the decrease in skin temperature and snow/ice cover over and around the Alaska region.
2. Datasets and methodology
In total, 35 years of data have shown effective variability over polar regions and surroundings using skin temperature, geopotential height, winds, and snow cover [17]. This study had the limitation of snow cover datasets from NSDIC. Thus, all the other datasets (ERA-Interim) also showed up to 2014. A standard climatology duration of 1979–2008 was considered in all the figures. The correlation coefficient between skin temperature, and snow cover over the Arctic region, and Alaskan region is calculated. The datasets of snow cover and multi-decadal oscillations (e.g., AO/NAO, North Atlantic Oscillations) are acquired from online data portal [18].
3. Results
3.1 Northern hemisphere
3.1.1 Skin temperature anomalies
Keeping climate change in the background, as sea ice withdraws in summer, SST in the Arctic Ocean region has risen. Among all, the most significant linear trend was observed in the Chukchi Sea (northwest of Alaska), where skin temperature has increased at a rate of 0.5°C/decade. In August 2014, SST was as much as 7.2°F higher than the 1982–2010 average in the Laptev Sea (north of Russia), and in the Bering Strait region, while SST in the Barents Sea, north of Norway, was close to the 1982–2010 average (NOAA Media release, 2014). North of Alaska in the Beaufort Sea there is clockwise churning of the ice which replenishes old ice with new, known as a nursery for older ice.
The variability of temperature on a monthly to yearly scale shows complex variations over the Alaska region. Thus, we considered the decadal variability of skin temperature. Figure 1 shows the skin temperature anomalies of March, over the North Pole region (in stereo-polar format). Anomalies of positive skin temperature can be seen over the north polar region from 1979 to 1984 to 1985–1994. However, after that temperature anomalies remain positive (warming). March is the month when the season starts to change from winter to summer. In the latest decade 2005–2014, positive temperature anomalies can be seen over the USA, Canada, Russia, and Middle East regions. For 1982–2014, we found a correlation of −0.36 between the NAO index and March surface temperature averaged over a box (Figure 1a).
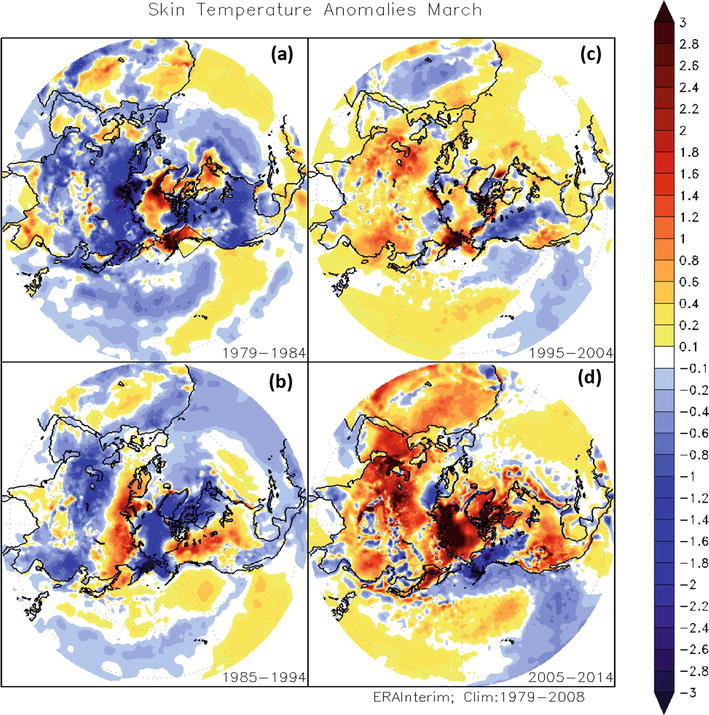
Figure 1.
Skin temperature anomalies for the month of march showing the decadal variability from some decades (a–c) and the remaining 6 years (1979–1984, d).
There are many other features that are hidden in Figure 1, for example, abnormal warnings over the Middle East and Saudi Arabia region. However, such abnormalities are quite local and hardly have an impact on Arctic ice melt.
The Alaska region remains a valuable resource of natural resource for the USA. Any change in the atmospheric conditions might affect the economy and ecosystems of the region. Figure 2 shows the decrease in March skin temperature over a region (135 W–168 W, 60 N–70 N; shown by a black box in Figure 1a) in Alaska. March is a month when the Sun starts to move toward the Northern Hemisphere from the southern hemisphere. This spring warming (heat) is used to melt the snow and surrounding sea ice over the Alaskan region, which is one of the reasons that the skin temperature goes down in the region. Other possible factors might be the oscillation of NAO and AO over the decadal scale. A decrease of 3°C is noted over selected regions in the last 36 years. Additionally, a fluctuation of 7°C between 2005 and 2007 was unique in several decades.
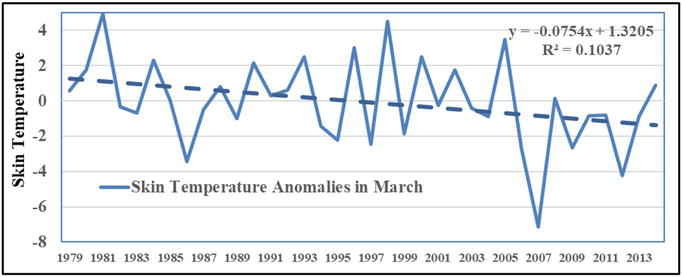
Figure 2.
March month skin temperature anomalies (°C) for 35 years averaged over (135 W–168 W, 60 N–70 N) region. Data source: Era-interim.
3.1.2 Wind anomalies
In America and Canada, regions where the jet stream plays a crucial role in producing freezing and warm weather. Such a pattern of cold and warm weather extends to Europe and Russia via these fast-moving wind streams. In 2014, the jet stream brought very cold air into eastern North America and central Russia, while extremely warm air into Alaska and Northern Europe [19]. Additionally, temperature anomalies of 10 DegC higher than the average for January were taped over Alaska. A difference in the temperature over different parts of the earth influences pressure and then wind pattern. Figure 3 shows the Rossby wave pattern of low, high, and low. As a decadal average, the wind pattern has changed dramatically over different parts of the northern pole.
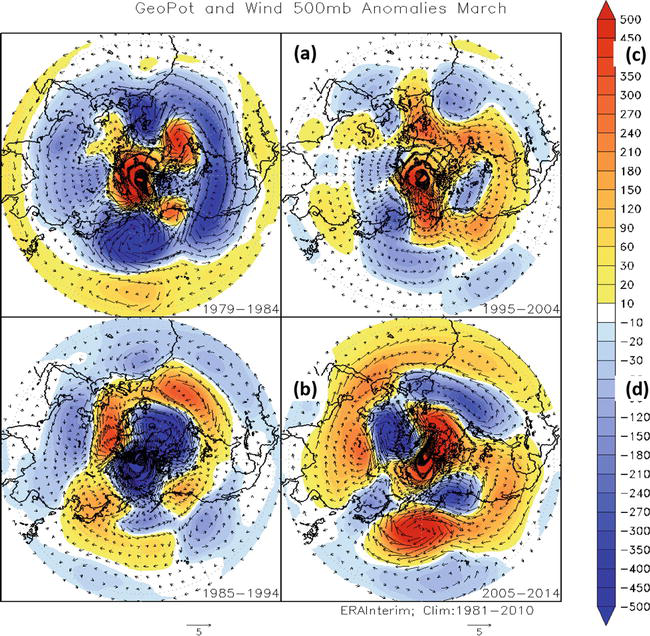
Figure 3.
Geopotential and wind anomalies at 500mb for the month of march showing the decadal variability from some decades (a–c) and the remaining 6 years (1979–1984, d).
3.1.3 Snow cover and variability
Wind and air temperatures curate the snow cover of the surface of Earth. In the era of climate change warning, every next year seems to carry less snow cover [12]. Advancing with this reality, in spring 2014, snow cover across the Arctic was reduced below the long-term mean. Further, due to above-normal temperatures and below-normal snow aggregation, the snow vanished 3 to 4 weeks earlier than normal over the Canadian subarctic, and western Alaska [19]. Figure 4 shows snow cover over the North Pole, which shows the maximum snow cover from March 12 to March 17 in the last 36 years. A shift of 5 days for maximum snow covering the Northern Hemisphere is notable for ecology, economy, tourist, and environmental purposes. These variations are observed from February 24 to April 1, a range of 37 days.
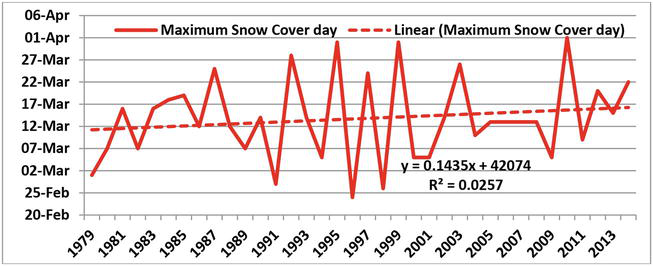
Figure 4.
The line diagram shows a day in a year when snow cover was maximum (million square kilometers) over the Arctic region. Data source: NSDIC.
It is now very clear that every year maximum snow cover (in millions of square kilometers) is decreasing from many studies and datasets demonstrated in Figure 5. Mid-March is the time when snow and ice cover start to melt over the northern pole region. In the year 2015, maximum coverage of ice started melting around February 25 as stated by Jeff Key (NOAA’s Satellite and Information Service Center). It seems snow and ice cover started to melt earlier and faster than in previous years in general. In the recent year, 2009 (April 1) witnessed lower snow cover than in 2010, with a difference of 0.21 square km (Figure 5). However in 2009, the maximum accumulation of snow was observed on April 1, as compared to 2010, when maximum snow was observed on March 6 (Figure 4). Arctic-wide, the start of the melt of snow proceeded by around 6 days from 2003 to 2013, while the yearly refreeze was waited by around 11 days [13].
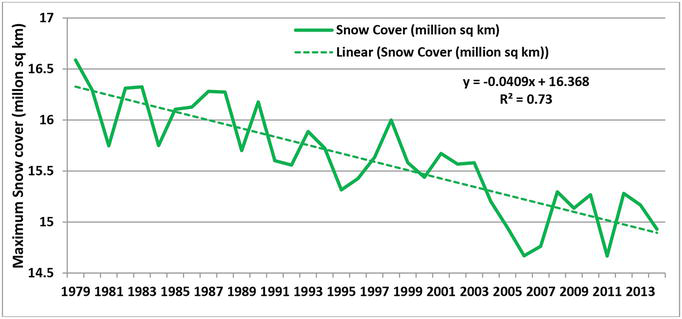
Figure 5.
The line chart shows the details of the maximum snow cover (million square kilometers) over the Arctic region. Data source: NSDIC.
4. Alaska region
4.1 Temperature and snow cover in February and march
In the context of climate change, temperature has shown an increasing trend over almost all parts of Earth. Researchers, forecasters, and the public have good trust that heat and temperature have been uniformly increasing since the initial time, which is known as the Hockey Stick. The average daily maximum temperature in recent decades (2005–2014) for 2 months (February 1 to March 31) declined over many regions (cities) in Alaska (Figure 6a–e) while increasing over many parts of the Northern Hemisphere (Figure 7). It is interesting to note that in decadal graphs, March shows relatively lower temperatures in recent decades (1994 onwards) than February in previous decades (before 1994). We analyzed daily maximum temperatures in many other parts of the Northern Hemisphere. For example, Alta (Norway) has shown an increase in temperature in recent decades. The warming and cooling in the Northern Hemisphere fluctuated quite a decade in March, though. Some of the local and regional atmospheric and oceanic interests play an important role along with remote influences.
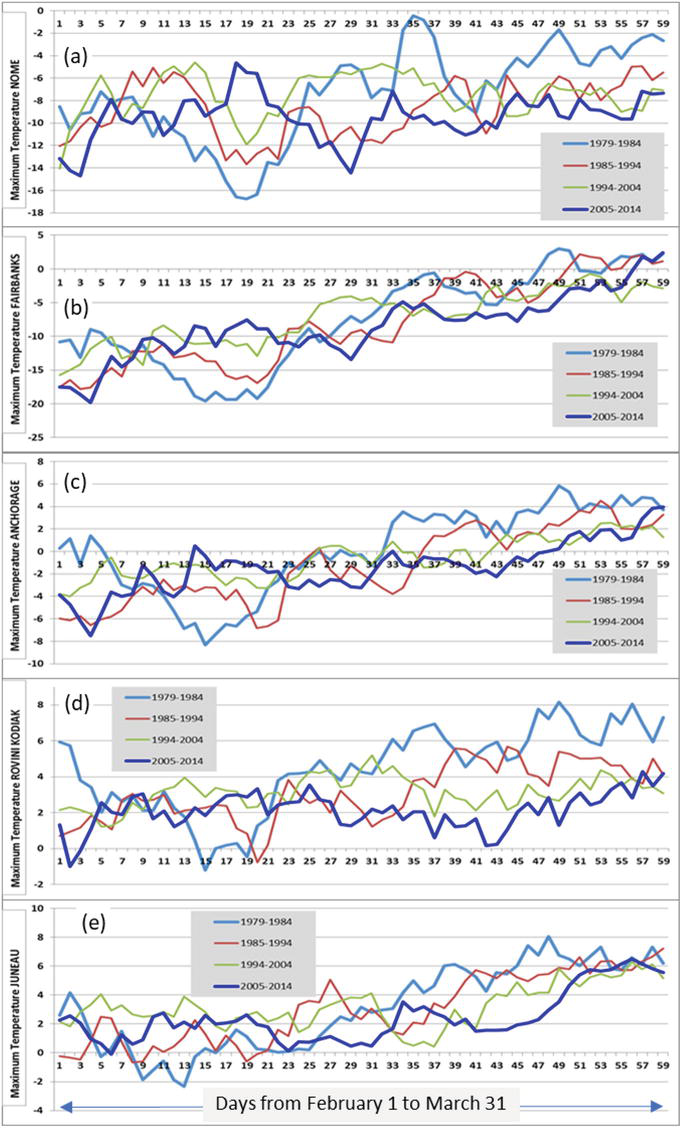
Figure 6.
Line chart shows the variation of maximum temperature over the Alaska region (a–e) for three recent decades and the remaining 6 years.
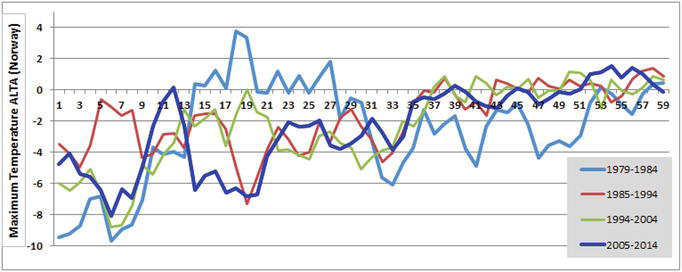
Figure 7.
Line chart shows the variation of maximum temperature over Alta (Norway) for three recent decades and the remaining 6 years.
The overall trend of northern hemispheric ice is decreasing, while the Bering Sea has experienced an accumulation of ice due to a short-lived atmospheric pattern: drifting snow from the North Pole. Figure 8 demonstrates the accumulation of ice, which peaked in the days of February and March in recent years over the Bering Sea. Here, in more recent years, the maximum ice extent/cover is showing a shift toward March.
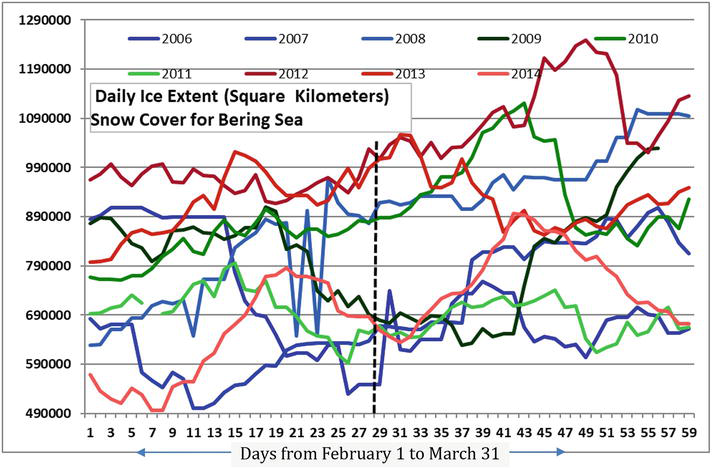
Figure 8.
The line chart shows the variation of daily ice extent over Bering Sea.
From 2007 to 2014, sea ice extent was the lowest since satellite observations started in 1979 [19]. To extend our support for snow-ice cover over bigger parts than just the Bering Sea, here in Figure 9, we showed that the snow and ice growth over the Alaskan region shifted in March as compared to February (Figure 9). The minimum temperature and maximum snow cover are moved to the days of mid-March and later days, over the Northern Alaskan region. Such a shift in the snow cover will influence the ecology and other common traits of the region.
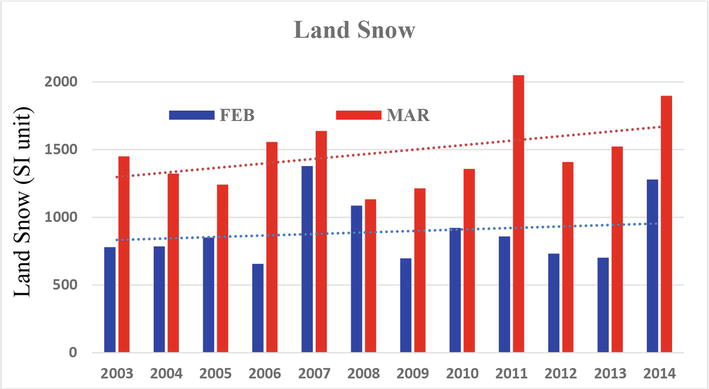
Figure 9.
Land snow and lake ice averaged over the Alaskan region and the adjoining north-western part of Canada (135 W–168 W, 60 N–70 N). Data source MODIS datasets for land snow cover at 0.05-degree horizontal resolution.
5. Conclusions and discussions
Humans are having a significant impact on the Arctic because of greenhouse gas emissions on the multi-decadal to century time scales, with impacts on long-wave radiation and SSTs. In recent decades, minimum temperatures and maximum snow cover show a shift in the month of March, compared to earlier decades. The accumulation of maximum snow cover has shifted by 5 days in the last 36 years (1979–214). During 1980, maximum accumulation was reached by March 12, and now it is around March 17. In the north and northeast of Alaska, the Bering Sea shows the abnormal accumulation of sea ice, that is, a reduction over the North Pole region. March is regarded as colder than February due to the accumulation and melting of snow covering the Alaskan region. We did not consider the timescale of more than a decade; thus, no consideration was given to changes in astronomical factors such as changes in the earth’s orbit and rotational axis, which, of course, occur on much longer time scales. Additionally, we did not calculate energy balance, rate of melting, or heat transfer in our analysis to reach conclusions. Is the shift in minimum temperature due to climate change alone or due to other prominent oscillations prevailing over the region?
Acknowledgments
The authors are thankful to GrADS, ECMWF, and NSCID center for publicly available packages and datasets. The authors are very much thankful to the anonymous reviewer.
References
- 1.
Anchorage Daily News. 2015. Available from: https://www.adn.com/arctic/article/arctic-getting-warmer-and-wetter-sea-ice-shrinks-study-says/2015/08/09/ - 2.
Praetorius S, Rugenstein M, Persad GG, Caldeira K. Global and Arctic climate sensitivity enhanced by changes in North Pacific heat flux. Nature Communications. 2018; 9 :3124. DOI: 10.1038/s41467-018-05337-8 - 3.
NOAA 2021 Annual Report. Monthly Global Climate Report for Annual 2021. NOAA 2021 Annual Report; Asheville, North Carolina, USA: National Center for Environmentla Prediction; 2022. Available from: https://www.ncei.noaa.gov/access/monitoring/monthly-report/global/202113 - 4.
Chylek P, Folland C, Lesins G, Dubey M, Wang M. Arctic air temperature change amplification and the Atlantic multidecadal oscillation. Geophysical Research Letters. 2009; 36 :L14801 - 5.
Bintanja R, van der Linden CE. The changing seasonal climate in the Arctic. Scientific Reports. 2013; 3 :1556. DOI: 10.1038/srep01556 - 6.
Holland MM, Bitz CM. Polar amplification of climate change in coupled models. Climate Dynamics. 2003; 21 :221-232 - 7.
Manabe S, Stouffer RJ. Sensitivity of a global climate model to an increase of CO2 concentration in the atmosphere. Journal of Geophysical Research. 1980; 85 (C10):5529-5555 - 8.
Screen JA, Simmonds I. The central role of diminishing sea ice in recent Arctic temperature amplification. Nature. 2010; 464 :1334-1337 - 9.
Graversen RG. Do changes in the midlatitude circulation have any impact on the Arctic surface air temperature trend? Journal of Climate. 2006; 19 :5422-5438 - 10.
Graversen RG, Burtu M. Arctic amplification enhanced by latent energy transport of atmospheric planetary waves. Quarterly Journal of the Royal Meteorological Society. 2016; 142 (698):2046-2054 - 11.
Lenton TM. Arctic climate tipping points. Ambio. 2012; 41 :10-22 - 12.
Stroeve JC et al. The Arctic’s rapidly shrinking sea ice cover: A research synthesis. Climatic Change. 2012; 110 :1005-1027 - 13.
Hahn LC, Armour KC, Battisti KC, Donohoe A, Fajber R. Seasonal changes in atmospheric heat transport to the Arctic under increased CO2. Geophysical Research Letters. 2023; 50 (20). Available from:https://agupubs.onlinelibrary.wiley.com/doi/epdf/10.1029/2023GL105156 - 14.
Boisvert LN, Strove JC. The Arctic is becoming warmer and wetter as revealed by the atmospheric infrared sounder. Geophysical Research Letters. 2015; 50 (20):4439-4446. DOI: 10.02/2015GL063775 - 15.
Hodson A et al. Glacial ecosystem. Ecological Monographs. 2008; 78 (1):41-67 - 16.
Krishnamurti TN, Kumar V. Prediction of a thermodynamic wave train from the monsoon to the Arctic following extreme rainfall events. Climate Dynamics. 2017; 48 :2315-2337 - 17.
Richter-Menge J, Overland JE, Mathis JT. Arctic Report Card 2016. NOAA; 2016. Available from: http://www.arctic.noaa.gov/Report-Card - 18.
Riggs GA, Hall DK, Salomonson VV. MODIS Snow Products User Guide for Collection 4 Data Products. Greenbelt, USA: Goddard Space Flight Center; 2006 - 19.
Jeffries MO, Ritcher-Menge J, Overland JE. Eds. Arctic Report Card 2014. 2014. Available from: https://arctic.noaa.gov/wp-content/uploads/2023/04/ArcticReportCard_full_report2014.pdf