
Abstract
Efficient management of municipal road assets demands consistent condition monitoring. Traditional methods, encompassing measurement techniques and visual inspections, fall short in the face of urban environment dynamics, requiring substantial human and financial resources. The periodic assessments currently in use make it challenging to maintain an up-to-date perspective on road conditions and provide continuous road availability. In response to these challenges, one noteworthy outcome of the current research is the introduction of vibration monitoring. Leveraging advanced data acquisition techniques and Artificial Intelligence (AI) in the data evaluation, this approach enables continuous data collection and condition assessment with minimal human intervention. Allowing for real-time updates facilitates early detection of damage and supports the development of optimal maintenance strategies, mitigating the need for costly premature resurfacing or rehabilitation. Its impact extends beyond facilitating faster and more reliable decision making in finance, operations, and maintenance. It is crucial to outline quantifiable benefits resulting from this approach, such as improved road sustainability, increased availability, and potential cost savings. Despite its potential, the adoption of vibration monitoring for road condition assessment may encounter challenges, such as implementation costs, technological barriers, regulatory compliance, and a lack of scalability to varying scenarios. Acknowledging these hurdles is crucial for a comprehensive understanding of the proposed solution. Collaboration with stakeholders, including local communities and relevant authorities, is essential for successful implementation. In conclusion, the introduction of vibration monitoring marks a significant leap forward in the continuous assessment of road conditions. It offers tangible benefits such as improved sustainability, increased road availability, and potential cost savings. Acknowledging challenges, connecting to existing research, and addressing practical implementation considerations are essential steps toward realising the full potential of this innovative approach to municipal road asset management.
Keywords
- AI
- asset management
- building information modelling
- BIM
- degradation
- monitoring
- vibration
- maintenance
- data collection
- road pavement
- international roughness index
- IRI
1. Introduction
Every road infrastructure object wears out through climatic conditions and traffic loads. Intensive use of road pavements, irregular maintenance, and inappropriate treatment methods cause damage to the pavement surface and deterioration of the pavement condition. As a result, the quality of the ride and the efficiency of the road availability are reduced. However, pavement management systems focus on accurate performance assessment, which requires accuracy and a reliable monitoring system of the pavement condition.
There are three main methods of collecting information on road conditions. The most common method, especially on trunk roads, is metrological condition monitoring. High-speed road monitors, consisting of laser scanners combined with high-resolution line cameras, record data on the longitudinal and transverse evenness and substance characteristics of the surface. These high-speed measurement systems can be used without disturbing the flow of traffic.
Visual image-based condition monitoring, the second most widely used method of road condition monitoring, is based on the visual analysis of photographic and video images and allows both asset and condition data to be recorded at the same time. This advantage requires digital stereo image cameras and measuring cameras directed at the road surface. Infrastructure objects and their physical characteristics are measured using stereoscopic measurement techniques and 3D laser scanning.
The oldest and most proven method for road condition assessment is visual assessment. This type of recording is only suitable for minor roads and/or side areas like bicycle paths in order to exclude traffic hazards for the monitoring personnel. The use of mobile digital logging devices (e.g. tablet PCs) is widespread to minimise mistakes in the recording. The road network is stored on the device as a digital network model. GPS support allows direct geo-referenced input of the recorded condition features. To facilitate recording, the surface types (road, footpath, cycle lane, etc.) and surrounding buildings are visualised for the operator. With this recording method, the design of the input interface influences the quality and speed of condition monitoring. Progress is comparatively slow (an average expert evaluates 3–4 km per hour).
The three methods described here have the disadvantage that they can only be carried out periodically, on average every 4–5 years, due to the financial and personnel costs involved. This also means that the state of the infrastructure is only glimpsed. Changes between survey campaigns due to traffic, climate, possible excavations, or other adverse changes to the road are not recorded. There is therefore a need for continuous road condition monitoring. However, it must be simple, not require a lot of manpower and, above all, be cost-effective. Road condition monitoring using vibration sensors appears to meet these requirements. The following considerations are therefore intended to shed more light on this method in principle, to examine existing approaches for their suitability and to compare the results with conventional condition monitoring. The aim is to enable road managers to assess whether vibration monitoring is suitable for their purposes.
2. Innovations in road condition monitoring
2.1 Condition monitoring
In general, there are three groups of condition characteristics, which are obtained by different technologies:
Roughness and rutting are characteristics of the evenness in the longitudinal and transverse directions. A common method of measuring roughness is multiple scanning of the road surface using laser triangulation sensors mounted vertically downwards on a rigid beam of 2 or 4 m in length. This is vibration-isolated and mounted under the vehicle. The longitudinal profile of the road is determined from the laser measurements, which are typically taken at 0.1 m intervals.
Laser triangulation sensors mounted on a rigid frame at the rear of a carrier vehicle are used to detect rutting, transverse evenness, and road slope. This rigid frame is also vibration decoupled. A width of up to 4 m can be measured in one pass with the respective outer sensors on the measuring beam set at an angle.
Skid resistance is measured using a SCRIM (Sideway-force Coefficient Routine Investigation Machine). This is metrological equipment mounted on a truck to measure the wet skid resistance of a road surface using the sideways force principle. Skid resistance is less important on urban roads, where traffic speeds are lower. It is therefore not included in the regular condition monitoring campaigns in municipalities.
Pavement texture features are detected by high-resolution line scan cameras. These are usually mounted to the left and right of the rear of the monitoring vehicle and record the road surface synchronously. This is done by illuminating the road with LED lighting. This produces a video of the road surface in 256 grey scales. The surface images are compressed at 10 m intervals. In addition to these images, the front cameras capture a colour image of the vehicle roof for reference, synchronised with the road surface image. The condition of the surface (cracks, patches, and other surface defects) is determined from these video images.
2.2 Condition assessment
Condition monitoring provides measurements with physical units. For the purpose of comparison at object and network level, it is necessary to convert the condition variables into dimensionless condition values. A common unified grading scale ranges from 1 to 5, with 1 being the best and 5 being the worst.
The objectives of the condition assessment are as follows:
Scoring: The objective state variables are technically evaluated.
Comparability: By converting to uniformly scaled condition values, different condition characteristics and different traffic area types can be compared.
Linkage: The uniformly scaled state values can be linked to complex state values (partial target values, total value).
Processing: Condition values are well suited and intuitively understandable for display on maps, for statistical evaluations and for the monetary rating of infrastructure assets.
For the purpose of conversion, defined normalisation functions are applied to the condition variables. These functions vary from country to country and even within countries for the application to different types of road networks. The higher the safety and comfort requirements, the more stringent the conversion functions. Rutting on urban roads does not have the same serious consequences as on motorways due to the lower speeds within urban areas. Therefore, a deeper rut on an urban road may result in better condition scores than a comparatively shallower rut on a motorway.
2.3 Systematic road maintenance
A management cycle, also known as a continuous improvement cycle, plays a key role in the systematic approach to road maintenance. This cycle enhances the efficiency and effectiveness of the entire maintenance process by following six distinct stages: road condition monitoring and evaluation, planning, coordination, execution, measure monitoring, and evaluation (see Figure 1). Each stage contributes to a well-structured and dynamic road maintenance strategy, ultimately leading to improved road safety, prolonged infrastructure lifespan, and enhanced overall transportation efficiency for the community.
Road Condition Monitoring/Assessment, Evaluation and Issue Identification: This phase includes the collection of road condition characteristics and the evaluation of condition data. Road safety and the identification of safety issues complete this phase as input for the planning phase.
Planning of Maintenance Measures: During the planning phase, road authorities carry out a comprehensive assessment of the condition data of the roads within their jurisdiction. This assessment provides the basis for identifying and prioritising maintenance needs. By carefully analysing road conditions and taking into account factors such as traffic patterns, weather impacts and intensity of use, authorities can strategically allocate resources to areas that require immediate attention. Effective planning ensures that maintenance efforts are focused on critical areas, optimising the use of resources.
Coordination of Measures: All maintenance activities are coordinated locally and in a timely manner within the network. This ensures smooth traffic flow within the network and minimises detours. Combining maintenance activities can save money and reduce traffic disruption. Planned excavations for the maintenance of sewers, pipes and cables must be considered.
Execution of Measures: In the execution stage, maintenance activities are carried out based on the established plan. This includes carrying out repairs, implementing preventive measures and addressing identified maintenance needs. Timely implementation of maintenance activities is essential to prevent further deterioration of the road infrastructure. By adhering to the planned maintenance schedule, road authorities can minimise disruption to traffic flow and ensure the safety of road users.
Measure Monitoring and Data Update: The monitoring phase involves continuous tracking of the progress of maintenance activities. This stage allows the road authority to monitor the implementation of the maintenance plan and identify any deviations from the intended course. Regular monitoring provides an opportunity to identify potential problems or challenges that may arise during the execution of maintenance tasks. By staying vigilant and responding to real-time data and feedback, authorities can take corrective action as needed, ensuring that maintenance activities stay on track and effectively address road condition issues.
Result Evaluation: The evaluation stage is crucial for assessing the results of maintenance activities. Road authorities analyse the results achieved through the implementation of the maintenance plan. This evaluation helps to determine the impact of maintenance activities on road condition, safety and overall infrastructure integrity. By identifying successes and areas for improvement, road authorities can refine their maintenance strategies for future cycles. The evaluation process provides valuable insights to inform decision making and guide adjustments to maintenance plans, resource allocation and execution methods.
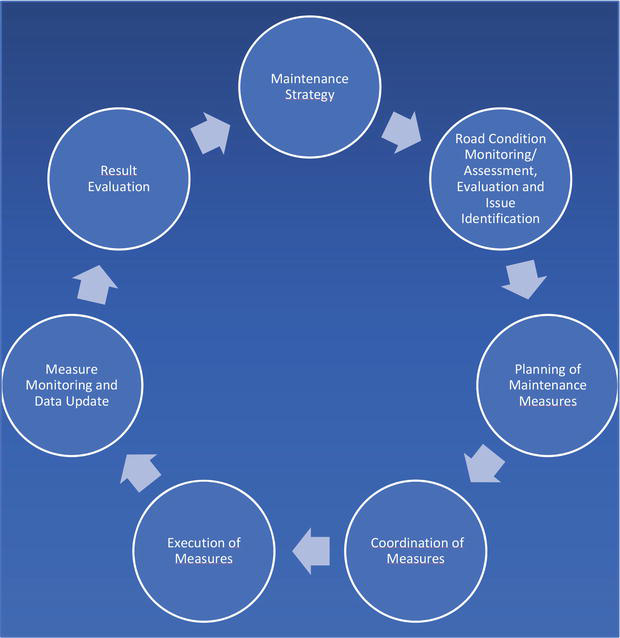
Figure 1.
Management cycle for systematic road maintenance.
By embracing and consistently implementing this management cycle, road maintenance evolves into a structured, adaptive process. This approach not only ensures the longevity of road infrastructure but also enhances road safety and contributes to the overall efficiency of transportation systems. The continuous improvement cycle provides road authorities with a systematic framework to proactively address road maintenance needs, effectively manage resources, and create sustainable road networks that cater to the needs of the community.
2.4 Basics of accelerometer technology
Acceleration sensor technology is increasingly being used in innovative approaches to road condition monitoring. This involves mostly measuring the vertical acceleration of a vehicle as it travels. In some cases, the use of smartphones or other consumer electronic devices is being offered as an effective, cheap and easy-to-handle means for data collection [1, 2, 3].
Today’s smartphones tend to have a wide range of sensors built into them. Accelerometers, for example, are used in smartphones to execute commands by shaking the smartphone, to record the number of steps taken with the pedometer, or to play various games. A gyroscope is used to automatically align the display when the smartphone is rotated, and a GPS module is used to determine the location in navigation applications. They therefore appear to be well suited to this condition monitoring method.
After all, smartphones are not primarily designed as measurement systems. This is reflected in the fact that little or no information is available about the sensors installed, so their quality depends on the smartphone manufacturer or even the model. In addition, a smartphone tends to become obsolete and needs to be replaced more quickly than a purpose-built metrological unit. Apps can also be changed at any time without users being informed. Thus, according to various studies, the hardware and software built into a smartphone are capable of functioning as a measurement system, but it is not designed to do so.
It remains to be investigated what accuracy and repeatability can be achieved with such vibration sensors for recording road condition characteristics relevant to local authorities. The first priority is to select suitable and easy-to-use vibration sensors.
A prerequisite for road condition assessment using accelerometer technology is a correlation between the measured vertical acceleration and the condition of the road surface. International studies have already investigated accelerometer measurement setups based on the International Roughness Index (IRI). First mentioned in a 1986 World Bank publication, the IRI is used in many countries around the world, and its collection is still required by the World Bank as a regular condition monitoring tool for road projects financed by the Bank. Therefore, it is obvious that acceleration data obtained by vibration sensors can be related to the IRI scale.
The IRI is used to describe the effects of roughness on a vehicle. Thus, this index can be used to make statements about the following:
total vehicle operation costs
general ride comfort
dynamic wheel loads
general surface condition
However, the description of the roughness is not sufficient to describe the total road condition. Further investigations have shown that not all pavement characteristics can be captured by vibration monitoring.
Accordingly, the following condition characteristics can be recorded by means of vibration sensors:
short-wave roughness in the longitudinal profile,
fretting,
transverse and crocodile cracks,
open seams and joints,
patches.
However, it is not possible to record.
long-wave roughness,
longitudinal cracks,
evenness in the transverse profile, especially rutting,
binder accumulations.
The IRI is defined as a property of a single wheel track profile because many measurement systems for profile detection can only record a single longitudinal profile. Basically, a measurement interval of 300 mm is required for the IRI; 600 mm is sufficient for less accurate results. For roads that have very good evenness, an interval of less than 300 mm is required. The recorded longitudinal profile should have a constant slope between recorded high points, resulting in the recommended unit of IRI of metres per kilometre (m/km), millimetres per metre (mm/m), or slope × 1000 (Figure 2).
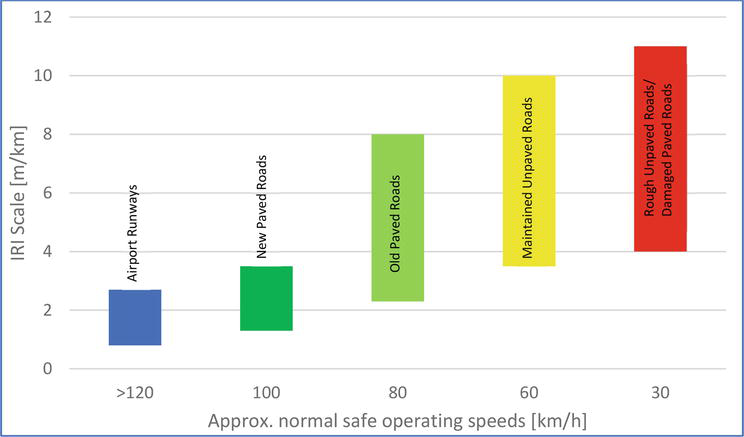
Figure 2.
IRI range by road classes and speeds.
2.5 Research project
The aim of the research project is to develop a cost-effective measurement system for continuous monitoring of road conditions in urban areas. The use of new data collection methods should enable continuous data monitoring and condition assessment with a minimum of manpower. This will support the maintenance management of municipalities and has an impact on economic and political concerns.
Initially, the research started with a smartphone attached to a bicycle [4]. The vibrations during the ride were measured simultaneously by two smartphones. Smartphone 1 was mounted on the right side of the handlebar, Smartphone 2 on the upper bar of the frame. Both were aligned horizontally in order to assign the directions of the acceleration pulses during evaluation, with the y-axis in the direction of travel and the z-axis vertical. Smartphone 1 used the app “SensorLog” and Smartphone 2 “Phyphox”. “Sensor Log” allows to log and stream the smartphone’s sensor data. “Phyphox”, which stands for “physical phone experiments”, is an app developed by Germany’s RWTH Aachen University. It is primarily designed to experiment with the phone’s own sensors. Additionally, for reference purposes, an action camera, “GoPro Fusion”, was mounted on the handlebars with its own bracket and roughly aimed at a point in front of the front tyre with a lens in the direction of travel.
The evaluation of the tests carried out showed that the camera used is suitable for recording the road surface at speeds of up to 50 km/h with sufficient quality. In addition, the evaluation of the collected vibration data can be assigned to a specific road condition with acceptable accuracy.
Since higher and more steady speeds as well as longer measurement runs, are possible with a passenger car, the focus of the investigations was then placed on this method. In addition, the roads to be investigated are mainly used by passenger cars, so the university’s own Volkswagen (VW) bus model, “T5”, was used.
Instead of Smartphone 2, a USB acceleration sensor from “Code Mercenaries”, the model “JoyWarrior 24F14-WP” was fitted in the car, the measured values of which were recorded with a laptop in the passenger compartment. This was used to record accelerations at 20 Hz and the roll, pitch and yaw angles of the sensor. The “GoPro” was attached by means of a suction cup in the centre of the front area of the bonnet at a distance from the road surface of about 1.5 m.
The vibration data was recorded with the smartphone, the app “SensorLog”, and the USB accelerometer. The smartphone was mounted horizontally in the glove compartment on the passenger side. The USB sensor was placed between the front seats on the floor of the interior, secured against slipping by an adhesive strip and connected to a laptop. Both devices were aligned so that the y-axis was pointing in the direction of travel and the z-axis was pointing vertically upwards.
The result of this condition monitoring test showed that only condition features affecting the roughness can be recorded. Structures embedded in the road surface, such as manhole covers, can also be detected. Features of the transverse unevenness, such as ruts or longitudinal cracks that run along the direction of travel, cannot be recorded. Since the driving speed has an influence on the level of the measured values, this should be kept as constant as possible during the measurements and documented continuously.
In the course of the tests carried out, it was investigated whether the action camera used delivers sufficient video quality to detect surface damage with sufficient reliability at usual driving speeds of up to 50 km/h. For a positional allocation of the image data, the GPS data stored by the camera was transferred into the videos and imported into a GIS as a shape file. This allows us to determine the position of any damage visible in the footage and to record the distance travelled during the measurement. The acceleration measurement data collected by means of a smartphone sensor was automatically displayed graphically by a macro and synchronised with the recording time of the videos. For the evaluation of the results, the processed image recordings and vibration data were compared, and the recognisability of individual condition features was documented. Deflections in the vibration data above a selected threshold could be associated with existing surface damage with sufficient reliability. This concluded the first campaign within the project. In particular, there were difficulties in synchronising the vibration and image data. In addition, it was not possible to unambiguously associate the vibration data with specific damage, but only to determine that there was specific damage to the road surface.
Lessons learned from the first step of the project were that the road condition detection method requires GPS, video and acceleration data to be captured while driving. GPS and video data were previously recorded with an action camera. Acceleration data was initially collected by smartphones and then by USB acceleration sensors. Preliminary evaluations showed that the action camera not only records GPS and video data but also acceleration data. When all three types of data are recorded by one device, synchronisation of the data is simplified. For this reason, acceleration measurements were carried out with the “GoPro HERO9 Black” in further development, and the suitability of this action camera as a measurement system was tested [5, 6, 7].
Three measurement runs were carried out with a VW T5 and the “GoPro HERO9 Black”. See Figure 3 for a video clip of the damage at the point of maximum acceleration deflection. The area with the maximum measurement deflection is recorded in the following diagram (see Figure 4).
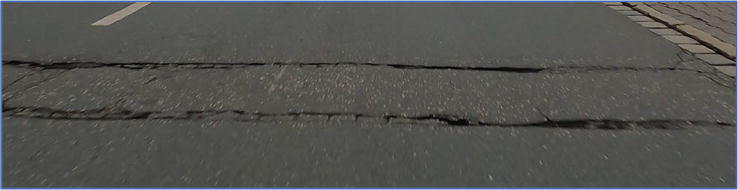
Figure 3.
Road damage at maximum acceleration deflection [
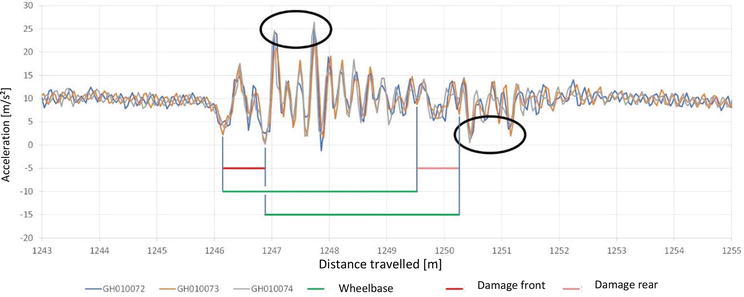
Figure 4.
Acceleration values [
The graph shows the acceleration values on the y-axis and the distance travelled in metres on the x-axis (see Figure 4). It shows the course of the acceleration data for all three measurement runs. At the beginning, the acceleration values oscillate around the rest value of 9.81 m/s2. The curve is then stimulated by the road damage and reaches a low point at 1246.15 m in data series GH010073. The next similarly pronounced low point is at 1246.88 m. The distance between the two points is 0.73 m. This corresponds approximately to the longitudinal extent of the damage. The previous oscillations were only caused by the two front wheels driving over the damage. So, there are two more extremes. One low point is at 1249.52 m, and the other at 1250.26 m. The distance between these two points is 0.74 m. The distance from the first low point of the front wheels to the first low point of the rear wheels is 3.37 metres, and the distance from the second low point of the front wheels to the second low point of the rear wheels is 3.38 metres which equals the wheelbase of a VW T5 (exactly: 3.4 m). It should be critically noted that the effects of the rear wheels on the course of the accelerations are not apparent in the diagram without additional knowledge. The small effects can be attributed to the large distance between the GoPro and the rear wheels. It is notable that the accelerations after passing over the damage overlap in such a way as to produce clearer extremes. These extremes are circled in black in the diagram in Figure 4. The distances between the extremes also reflect the extent of the damage in the longitudinal direction and the wheelbase of the measurement vehicle. These superimposed extremes are clearly visible in the diagram and provide an initial basis for identifying the damage from the acceleration data and determining its extent in the direction of travel. In the area shown, all three series of measurements were taken at a constant speed. As the series of measurements progressed, there were speed differences between the series, and it became obvious that the longitudinal acceleration of the vehicle had an effect on the vertical acceleration. This phenomenon is known in vehicle engineering as “pitching”.
Overall, the GoPro HERO9 Black is suitable as a measurement system and can certainly be used for further research. However, it has been shown that it would be beneficial to have more information and settings available on the accelerometer. As the GoPro does not provide any information about the installed components and no settings can be made on the accelerometer, a separate measurement system with external sensors was set up in the next phase of development.
A single-board Raspberry Pi 3 was used to control the measurement system setup for the next phase of the project, controlling two accelerometers and a Global Navigation Satellite System (GNSS) module with Python code. Unlike the smartphone and the GoPro, the chosen sensor cannot receive a position signal. There is no prepared interface to couple the sensor to a GNSS module. If both the sensor and the GNSS module are controlled by the same single-board computer, all measurements can be stored with the computer’s time and synchronised over time. The measurement system is currently being used on the university’s VW T5. In order to be able to use the measurement system on different vehicle models in the future, vehicle-specific influencing factors must be minimised. Therefore, these must first be defined. A MATLAB/Simulink model has been developed to simulate a quarter vehicle.
It is a one-dimensional model with two degrees of freedom, which allows the vertical movement of a vehicle to be represented. When comparing the simulation results with the measurement results from test runs, it was discovered that the model can represent the vertical acceleration at the wheel carrier better than the vertical acceleration of the body. This is due to the fact that the entire vehicle, with its vehicle-specific components, has an influence on the vertical acceleration during the measurements of the body.
In order to find the vehicle-specific properties of the VW T5, a measurement setup was designed. For the measurement runs, an acceleration sensor was attached to the wheel carrier and a second sensor in the vehicle interior (Figure 5).
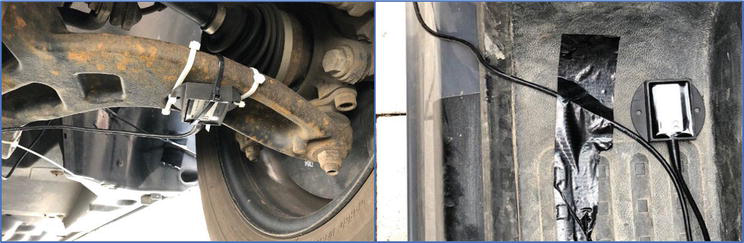
Figure 5.
Sensor under wheel carrier (left) and sensor in vehicle interior (right) [
The sensors were installed on top of each other as far as possible so that the measurement results are not influenced by the position. Different results in the measurements can only be attributed to the height difference of the sensors and, above all, to the vehicle components involved.
Before a new measurement system, for example, the one with the Raspberry Pi can be used in road condition assessment, its suitability must be tested.
2.6 Validation process
During the validation process, the relationship between the acceleration data and the state of the road must be verified. Currently, the condition is documented and subsequently evaluated as part of a metrological road condition survey using high-speed certified systems. With the help of this evaluation, which is obtained through established and standardised recording methods, the validation of the alternative method can be undertaken.
In contrast to many comparable studies, the acceleration data with the method developed at Ohm University is not recorded by smartphones. Due to the different components installed in smartphones, no comparable measurement can be made. In addition, smartphones are located in the interior of a vehicle and are influenced by the vehicle-specific influencing factors of the vehicle. In this project, external, commercially available acceleration sensors are used, which are installed at defined points on the vehicle body. This allows measurements to be taken over a longer period of time under the same conditions. Vehicle-specific factors such as natural frequencies and damping are filtered out by prior calibration measurements, giving the measured values a higher degree of accuracy.
The current system of systematic and periodic road condition monitoring is expected to become much simpler and cheaper with the use of vibration sensors. In addition, permanent condition monitoring will take place when this technology is installed in conventional vehicles that regularly operate in the area of a road network. The initial idea is to use vehicles from the Road Administration, but buses and taxis could be used as well. With permanent condition recording, a continuous inventory of the asset “road” would take place. With this current method of recording the condition of roads, the most common inventory at a key date can be replaced by a permanent inventory. The main advantages are that the inventory is spread over the year, and there is no time pressure to repeat the key date assessment. In addition, the inventory can be carried out at a time when staff are not tied up with other seasonal priorities, such as carrying out construction work in the months when the weather is likely to be favourable.
The longer-term goal is to link sensors as acquisition modules with evaluation modules and to use artificial intelligence to evaluate the measurement results and make them available to the user as a single module.
Up to now, the research project has proven the basic feasibility of road condition monitoring using vibration sensors. In the next steps of research, the objectivity of the method, as well as its reliability and validity, must be proven. This procedure has to follow these six steps:
Step 1: Collection of measurements under known conditions.
Known conditions in this case mean defined, measurable scenarios that generate the acceleration data.
To provide a benchmark for comparison and calibration for the following steps, the first step is to carry out measurement runs with regard to the influence of speed, rotational speed, transmission and inherent vibration from the engine of the vehicle, as well as the roughness of the road surface on the vibrations generated. The measurement drive over defined known obstacles is also included in this step. The measurement runs must be carried out with an optimised measurement setup and accurate but commercially available measurement equipment.
Step 2: Evaluation of the influences.
In the second step, the measurement data from step 1 has to be evaluated using various methods, such as Fast Fourier Transformation. The aim is to calculate the influence of speed, rotational speed, gear and inherent vibration of the engine.
At the same time, a MATLAB simulation must be created for the test vehicle. After entering the damage dimensions and the vehicle-specific properties, the generated vibrations are collected as output. These must then be compared with the data collected with the results of a metrological road condition survey for their evaluation.
Step 3: Measurement runs for extensive data set.
The recording of measured values on a road by means of vibration sensor technology is carried out. Each condition feature must be present several times in different forms in the collected data. These measurements form the data set for the artificial intelligence evaluation in step 5.
Step 4: Validation of the measurement data.
In step 4, the measurement data from step 3 has to be validated on the basis of the current road condition survey with conventional metrological techniques. Limit values have to be calibrated and defined so that the threshold values for the condition of the transverse and longitudinal evenness and for surface damage specified in the applicable regulations can be transferred to the vibration recording. The correlation of the parameters is the decisive quality criterion for the alternative method of condition detection by means of vibration sensors.
Step 5: Automated evaluation and visualisation.
This step involves the construction of a prototype as a test model with unrestricted technical functionality in relation to the final product, using commercially available suitable vibration sensors and a GNSS module controlled by a single-board computer installed in a housing with multifunctional mounting options on various parts of the vehicle body and live data transmission to the cloud using 5G/4G technology. The automated, AI-based analysis of data in post-processing and visualisation of results in a GIS is the result of the test runs. Calculation runs are carried out using the current condition values to optimise the maintenance strategies in order to minimise the construction costs and construction time of maintenance measures.
Step 6: Use of the prototype.
Use of the prototype in a selected municipal area in operation.
2.7 Use case
As part of the project, a use case with measurement runs was established on a selected test track. The criteria are as follows:
stretched track layout,
at least one pavement change,
different existing road surface conditions,
maximum speed of 50 km/h, and
existing comparative data from metrological road condition monitoring.
To ensure comparability and calibration of the condition data obtained from the vibration sensors, the roughness was first measured using a measuring system with the approval of the German Federal Highway Research Institute. The roughness measurement was carried out using multiple laser scanning. There are several ways to assess the roughness of a road. The most common ones in Germany are the “General Unevenness” measured in mm over a base of 4 m and the “Weighed Longitudinal Profile”. The IRI is not common in Germany but can be calculated from the results of multiple laser scanning.
The alternative measurement setup using an acceleration sensor was installed on the passenger side wishbone of a VW T5. The passenger side was chosen because the laser scanning of the measurement vehicle for the calibration measurement was also carried out on the right side of the vehicle. The GNSS sensor was mounted on the dashboard directly behind the windscreen in the centre of the vehicle. As with the previous test drives, the sensors were controlled by a Raspberry PI [8].
The acceleration data obtained was calculated and synchronised with the GPS data. A macro was used to calculate the data in Excel. After this synchronisation, the measurement results were displayed in a geo-information system.
Examination of the recorded acceleration values showed good agreement with the local condition characteristics of transverse cracks, material loss (potholes) and patching [9]. In addition, the accelerograms showed changes in the road surface, manhole covers and valve caps. It is not possible to distinguish the recorded vibrations caused by pavement elements from those caused by surface condition features without accompanying video analysis.
In order to compare the conventional measurement with laser sensors and the alternative method using vibration sensors, the IRI was used, which can be calculated from the data of the laser sensors. A relationship was then established between the IRI and the Root Mean Square (RMS) of the vertical acceleration gathered by the vibration sensors. The RMS value provides a representative description of the “average size” of a data set or function, considering both positive and negative values. This approach is particularly useful for periodic signals. It is used in various contexts, including signal processing and statistics, to quantify the dispersion of data points around the mean value. For the IRI and RMS to be comparable, the vertical acceleration sections must be divided in such a way that the IRI and RMS are calculated in the same way. For this use case, 100-metre sections have been created.
The RMS is calculated using the following equation:
where N is the number of acceleration recordings in the section, azi is the maximum value of acceleration in section i and g is the gravitational acceleration (9.81 m/s2). The IRI values and the RMS values were calculated for nine selected sections of the test track and compared (see Figure 6).
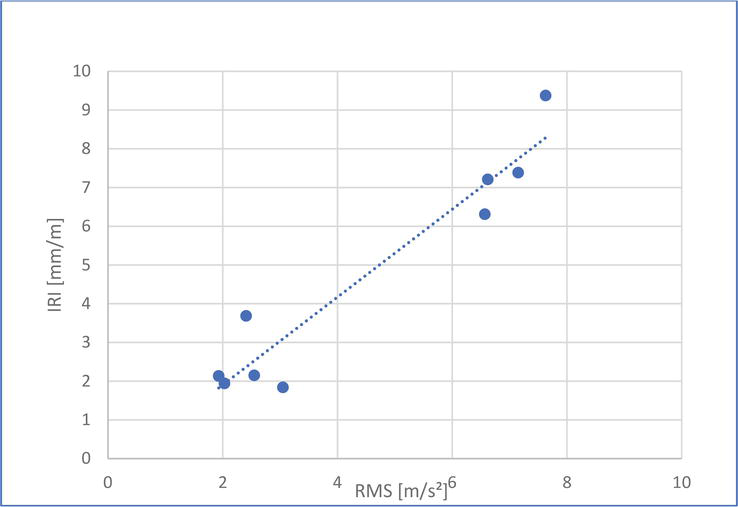
Figure 6.
Correlation between IRI and RMS.
The correlation between IRI and RMS derived from the nine test sections has a coefficient of determination of 0.932 and a correlation coefficient of R = 0.965. Figure 7 compares the IRI and RMS values calculated for each section.
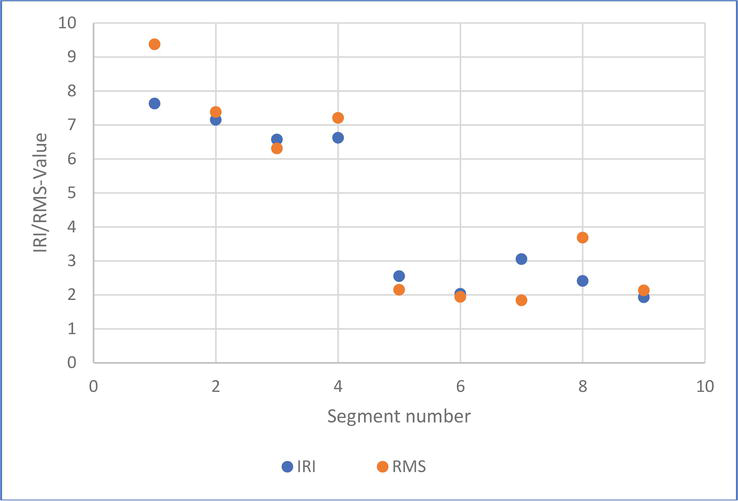
Figure 7.
Relation between IRI and RMS.
With the help of this correlation between IRI and RMS, a way was sought to calculate the IRI from the acceleration data alone and thus to be able to derive a conventionally introduced state variable, the IRI, from the measurement results of the vibration sensors. In the present case, with the measurement setup described, a driving speed of approx. 50 km/h and a 100 m long section were used:
A good correlation between the IRI and the RMS of the vertical acceleration was made possible by the chosen location of the accelerometer mounting at the bottom right of the measurement vehicle. Due to the proven high correlation, the IRI can be estimated using the alternative measurement setup if required, which would be more cost-effective than purchasing a pavement measurement device capable of providing the IRI. If in the future, the measurement setup and speed of approximately 50 km/h is used as in this study, the IRI for a 100 m section can be approximated using Eq. (2).
The evaluation of the RMS is imprecise because the ride quality is only described by the factor “convenience”. Several influencing factors would describe the RMS more accurately, as the comfort of a ride is a personal perception and can vary. The main criticism of both the IRI and the alternative measurement setup is that both only measure the roughness in the wheel track. Photographs and video footage are used to assist in the assessment as they allow the damage to be allocated in a meaningful and concrete way. To cover more of the road surface with acceleration sensors, the sensors can be mounted on both wishbones. For an IRI measurement, two laser profilometers would also be more useful.
3. Building information modelling in road asset management
3.1 Inventory
The basis for modelling the road surface is a laser scan or photogrammetric survey. In the case of a laser scan, any gaps that occur during the recording, e.g. due to parked vehicles, must be closed.
In this project, the road surface was recorded with a measuring vehicle using a modular system (Mobile Urban Mapper). This system consists of two area scan cameras with LED lighting, four still cameras, two ladybug cameras, a pavement profile scanner (PPS), a longitudinal evenness measurement system, a clearance profile scanner (CPS), and a pyrometer. The PPS scanner is used to scan the road surface over a width of 4 m. The longitudinal beams under the vehicle measure the roughness with triangulation sensors. The surface features are detected by surface cameras with LED lighting. The combination of laser scanners and cameras maps the road environment.
For further processing of the laser scan point clouds, vendor-specific programmes are required to open and process the data.
As part of the inventory, all data describing the condition of an infrastructure asset must be recorded. This includes data from the primary ordinal system (any given node-edge system, see Figure 8), the secondary ordinal system (areas adjacent to edges with size and structure information), and the condition (results of metrological or visual condition recording). For an existing road, this corresponds to the so-called “as-built model”.
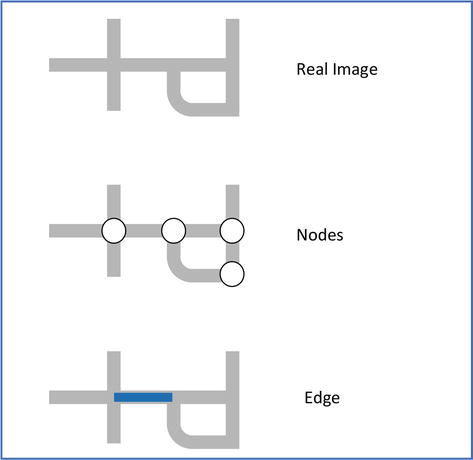
Figure 8.
Example of simple node-edge-system.
Special attention must be paid to the uniqueness and reproducibility of the primary ordering system: The nodes must be uniquely numbered so that all edges within the network also occur only once. These are designated with the adjacent nodes: Edge from node no. x to node no. y, etc.
3.2 Modelling the existing structure
To model the road body in Building Information Modelling (BIM), 3D profile bodies must be generated according to the relevant national regulations and guidelines. Attributes and properties need to be assigned to these profile bodies. For this purpose, software systems are available from various manufacturers. These programmes are complemented by tools for visualisation, coordination, and cost and schedule planning for a comprehensive BIM application.
In this particular application, Civil 3D from Autodesk was used to model the digital twin. The available country-specific modelling packages allow the road body to be modelled quickly and in accordance with the applicable guidelines. It should be noted, however, that deviations from the normative rules and regulations that can be found in any existing structure mean that the use of these modelling packages is limited [10].
3.3 Use for operation and maintenance
The core of the road asset management application is the use case “Use for Operation and Maintenance”. This standardised use case includes the transfer of data from the as-built model to corresponding maintenance management systems, the representation and, if necessary, evaluation of the condition of the structure in the model, and the updating of the model in the case of maintenance measures. These data lead to the development or updating of damage progression models, which in turn enable the planning and implementation of specific maintenance measures.
The basis for this use case is the modelled as-built model. The 3D profile body generated in this way must in turn be divided into 10 m sections to enable correlation with the condition data obtained in an earlier stage of this project. However, 10 m is not mandatory and is too short for segments on trunk and rural roads outside cities, where 100 m is more reasonable. For each of these 10 m sections here, solids were generated to which advanced properties could be assigned. In the use case, these were condition data, ordinal data, maintenance data, and acceleration data from the alternative road condition monitoring. These extended properties could be assigned to the different pavement layers in the model.
The acceleration data sets from the alternative road condition survey were divided into the same 10 m sections as the existing condition survey to allow the acceleration values to be mapped to the existing condition values. A comparison of the surface photos from the PPS scanner with the vibration values allowed the vibration values to be mapped to visually detectable road damage.
Infraworks software was used to visualise the digital twin modelled in Civil 3D. Visualisation is a convenient tool for the user to better understand the location, conditions and relationships. After importing the solids into Infraworks, it was possible to visualise condition data, as-built data, acceleration data and ordinal data.
3.4 Perspective of BIM in road asset management
It turned out that the process of creating a digital twin is user-friendly and largely uncomplicated. However, a high level of computer performance is required to be able to reproduce the surface in a detailed and realistic manner. The accuracy has an impact on the precision of the road surface and on the associated visual image of the damage. When digital models are linked to condition, maintenance and order data, the BIM working method is an enormous support for the management system. By using a digital model, data can be retrieved quickly and in greater quantity at any time. Through the volume bodies, quantity take-offs can be created automatically, which offers an advantage for resource planning and costing.
The future of BIM in road maintenance looks promising, with several potential advancements and perspectives that could significantly impact the field. Here are some key trends and perspectives to consider:
Integration of Internet of Things (IoT) and Sensor Data: BIM can leverage data from various sensors and Internet of Things (IoT) devices embedded within road infrastructure to continuously monitor conditions. This data can be integrated with the digital twin model to provide real-time insights into road health, traffic patterns, weather impacts, and more. This integration enhances predictive maintenance capabilities, allowing authorities to address issues before they escalate.
Advanced Analytics and Artificial Intelligence (AI): BIM combined with advanced analytics and AI will enable more accurate prediction of road degradation and deterioration patterns. AI algorithms can analyse historical data, sensor inputs, and other relevant factors to forecast maintenance needs, optimise resource allocation, and develop more efficient maintenance strategies [11, 12].
Augmented Reality (AR) and Virtual Reality (VR) for Visualisation: AR and VR technologies can provide immersive visualisation experiences for road maintenance planning and execution. Maintenance crews can use AR glasses to overlay digital models onto the physical environment, guiding them through tasks and providing access to real-time data, reducing errors and enhancing efficiency and road availability.
Automation and Robotics: As robotics and automation continue to advance, they can play a significant role in road maintenance tasks. Robotic vehicles and drones equipped with sensors can autonomously inspect road conditions, identifying cracks, potholes, and other issues. Automated machinery can also be used for repair and resurfacing tasks, reducing the need for manual labour. GPS data and automated guidance enable maintenance crews to easily find repair spots in large road networks.
Lifecycle Management: BIM can support the entire lifecycle of road infrastructure, from design and construction to maintenance and final replacement. By capturing data at every stage, BIM models can provide insights into the long-term performance of materials, design choices, and maintenance strategies, leading to more informed decisions in subsequent projects.
Digital Twins for Performance Monitoring: Digital twin technology will become more sophisticated, allowing road managers to simulate various maintenance scenarios and their potential impacts on-road performance. This proactive approach can help optimise maintenance schedules and resource allocation, leading to cost savings and improved road quality.
Collaboration and Data Sharing: BIM promotes collaboration among various stakeholders involved in road maintenance, including road agencies, contractors, designers, and technology providers. Sharing data and insights through a centralised BIM platform can foster better communication, coordination, and knowledge exchange.
Sustainability and Resilience: Future road maintenance strategies will likely prioritise sustainability and resilience. BIM can be used to assess the environmental impact of maintenance activities, optimise material usage, and integrate climate resilience measures into road infrastructure designs.
Regulatory Compliance and Reporting: BIM can aid in compliance with regulations and reporting requirements related to road maintenance. Accurate and comprehensive digital records can streamline the process of documenting maintenance activities, making it easier to demonstrate compliance and respond to audits.
In conclusion, the future of BIM in road maintenance will see increased integration of advanced technologies, data analytics, and automation to create smarter, more efficient, and sustainable road networks. BIM’s role will evolve from being a tool primarily used for design and construction to becoming an integral part of ongoing maintenance and infrastructure asset management.
4. Conclusion
The tried and tested method of road condition monitoring using laser scanning to measure the longitudinal and transverse profile and video recording of the road surface for subsequent signposting of road damage is labour and cost-intensive.
The multiple benefits of using vibration sensors for continuous road condition monitoring parallel the well-documented benefits of advanced sensor technologies. The ability to provide real-time insight into road conditions, enabling timely intervention, is in line with the growing trend in road management toward proactive infrastructure management using real-time data and predictive algorithms.
Still, the challenges of using vibration data for road condition monitoring are significant and varied. The following difficulties highlight the limitations and obstacles to the effective implementation of vibration monitoring in regular operations:
Specialised Knowledge Requirements: Deriving insights from vibration data demands specialised knowledge, hindering widespread adoption.
Limited Holistic Understanding: Vibration data alone may incompletely represent road conditions, overlooking factors like surface quality and structural integrity.
External Influences on Data Accuracy: External factors like traffic and weather can introduce noise, questioning the reliability of vibration data.
Lack of Context in Data: Incomplete contextual information in vibration data hampers identifying root causes, impacting maintenance prioritisation.
Inability to Capture All Characteristics: Vibration monitoring may miss certain road conditions, potentially leaving critical issues unaddressed.
The integration of digital models with condition, maintenance and asset data offers numerous benefits that will improve decision making, efficiency and cost effectiveness. The use case demonstrated the ability to create a BIM-enabled 3D model of an existing road for road asset management, which was visualised and provided with further maintenance management attributes.
The existing examples in literature dealing with BIM application in bridge management offer a detailed exploration of the technical intricacies and strategies necessary for seamless integration. AI will play a key role in processing and analysing the vast amount of data collected from different sources. Machine learning algorithms can be trained to recognise patterns, predict road deterioration and even suggest optimised maintenance schedules based on historical data and usage patterns. By linking this information with geographic data and historical maintenance records, decision-makers can develop long-term maintenance strategies, allocate resources more efficiently, and plan for infrastructure upgrades or replacements well in advance. BIM fosters collaboration among stakeholders, promoting better communication and coordination in road maintenance efforts.
In a critical discussion, it is important to recognise that neither vibration sensors nor BIM are stand-alone solutions but can complement each other in road condition monitoring. Vibration sensors provide real-time data that can be used to complement periodic assessments. BIM provides a comprehensive data framework for informed decision making but requires consistent maintenance and engineering skills. The future potential lies in synergising these approaches to create a more holistic and efficient road maintenance strategy.
However, to deepen understanding and context, further exploration of technical challenges, integration strategies, and ethical considerations is imperative.
Integration demands addressing technical complexities such as interoperability, ensuring data standardisation, and managing scalability. Overcoming these challenges ensures a smooth amalgamation of diverse technologies. A phased, gradual implementation strategy allows for systematic adaptation and learning from pilot projects. Additionally, providing training for maintenance personnel and establishing feedback mechanisms ensures efficient utilisation and continuous improvement. Emphasis on data privacy, equity, accessibility, and transparent decision making is vital. Adhering to ethical standards builds public trust and ensures that the benefits of technology are distributed fairly across communities.
In conclusion, a holistic approach addressing technical, ethical, and practical dimensions is essential for successful integration. This comprehensive strategy maximises the potential benefits of these technologies in road maintenance, contributing to more efficient and sustainable urban infrastructure.
References
- 1.
Best B, Shtayat A, Moridpour S, Shroff A, Raol D. A review of monitoring systems of pavement condition in paved and unpaved roads. Journal of Traffic and Transportation Engineering (English Edition). 2020; 7 (5):629-638. DOI: 10.1016/j.jtte.2020.03.004 - 2.
Shtayat A, Moridpour S, Best B, Shahriar Rumi M. Using a smartphone software and a regular bicycle to monitor pavement health statues. In: Proceedings of the 2nd International Conference on Robotics Systems and Vehicle Technology 2020. New York, NY, USA: Association for Computing Machinery; 2020. DOI: 10.1145/3450292.3450312 - 3.
Shtayat A, Moridpour S, Best B, Rumi M. Using a smartphone software and a regular bicycle to monitor pavement health statues. In: Proceedings of the 9th International Conference on Transportation and Traffic Engineering (ICTTE); 29–31 December 2021; Naples, Italy; 2021. New York, NY, USA: Association for Computing Machinery; 2021 - 4.
Knuepfer M. Image Referencing in Road Condition Monitoring using Vibration Sensor Technology. Bachelor’s Thesis. Ohm University of Applied Sciences Nuremberg; 2020. Nuremberg, Germany: Ohm University of Applied Sciences; 2020 - 5.
Angerer H. Development of Alternative Methods for Road Condition Monitoring. Master’s Thesis. Ohm University of Applied Sciences Nuremberg; 2022. Nuremberg, Germany: Ohm University of Applied Sciences; 2022 - 6.
Best, Berthold; Angerer, Helena: Alternative methods of road condition monitoring. In: Proceedings SURF2022, the 9th Symposium on Pavement Surface Characteristics; 12–14 September 2022; Milano, Italy; 2022. Paris, France: PIARC - World Road Association; 2022 - 7.
Best B, Angerer H. Development of alternative methods for road condition monitoring. In: Proceedings Australasian Transport Research Forum 2022; 28–30 September 2022; Adelaide, Australia, 2022. Canberra, Australia: Australasian Transport Research Forum Incorporated; 2022 - 8.
Zaiko A. Correlation between the International Roughness Index (IRI) and the Vertical Acceleration of a Vehicle. Bachelor’s Thesis. Ohm University of Applied Sciences Nuremberg; 2022. Nuremberg, Germany: Ohm University of Applied Sciences; 2022 - 9.
Abulizi K et al. Measuring and evaluating of road roughness conditions with a compact road profiler and ArcGIS. Journal of Traffic and Transportation Engineering (English Edition). 2016; 3 (3):398-411. DOI: 10.1016/j.jtte.2016.09.004 - 10.
Kroner K. Digital Twin for Road Asset Management. Bachelor’s Thesis. Ohm University of Applied Sciences Nuremberg; 2022. Nuremberg, Germany: Ohm University of Applied Sciences; 2022 - 11.
Shtayat A, Moridpour S, Best B, Rumi M. An overview of pavement degradation prediction models. Journal of Advanced Transportation. 2022: Special Issue. DOI: 10.1155/2022/7783588 - 12.
Shtayat A, Moridpour S, Best B, Abuhassan M. Using supervised machine learning algorithms in pavement degradation monitoring. International Journal of Transportation Science and Technology. 2022; 12 (2):628-639. DOI: 10.1016/j.ijtst.2022.10.001