
Abstract
The chapter evaluates the importance of integrated hydrosedimentological modeling in improving port resilience and environmental decision-making under the context of climate change, using the Paraíba do Sul River, Brazil, as a case study. It highlights the use of advanced predictive modeling, such as SWAT and SisBaHiA, in addressing the challenges posed by extreme climatic events on port operations and water resource management. The research emphasizes the need for tools to anticipate and adapt to adverse impacts, integrating remote sensing technologies and GIS for precise environmental monitoring. The goal is to promote informed decision-making for the sustainable management of water resources, mitigating erosion and sedimentation and adapting port operations to climate change.
Keywords
- hydrosedimentological modeling
- port resilience
- climate change
- remote sensing
- water resource management
- SWAT
- SisBaHiA
1. Introduction
In the global context of increasing frequency of extreme weather events, port areas face unprecedented challenges. The complexity of sediment processes and water flows, intensified by such events, demands innovative approaches to ensure the operational continuity and sustainability of ports. This study focuses on the application of integrated hydrosedimentological modeling in the Paraíba do Sul River region, Brazil, aiming to formulate strategies that strengthen the resilience of port infrastructures and improve water resource management in the face of challenges posed by climate change [1, 2].
The main question guiding this study is: “How can integrated predictive modeling of hydrological and sedimentological processes be improved to effectively predict and mitigate these impacts, ensuring the resilience and sustainability of port operations in the face of climate variations?” This question reflects the urgency to develop advanced predictive modeling capable of predicting and mitigating the adverse effects of extreme precipitation events, underlining the need to adapt port operations to climate change expectations [3, 4].
The analysis and prediction of the effects of climate change on port areas, through hydrological and sedimentological modeling studies, are crucial to ensure the sustainability and resilience of these vital infrastructures [5, 6]. Instruments such as the SWAT (Soil and Water Assessment Tool) and the SisBaHiA (Environmental Hydrodynamics Base System) are fundamental in this area, providing a thorough assessment of sedimentation and erosion processes, as well as their impacts on port activities. These modeling tools offer essential insights into the dynamic mechanisms that influence coastal and port areas, enabling the development of proactive strategies for environmental management and the optimization of port operations in the face of challenges posed by climate change [7, 8].
The SWAT (Soil and Water Assessment Tool) is a tool used to analyze the impact of changes in land use and management practices on hydrology and sediment transport [9]. The combination of SWAT with remote sensing technologies and Geographic Information Systems (GIS) has been shown to be particularly effective in Land Use and Cover Change (LUCC) studies, emphasizing the efficiency of these technologies in monitoring and predicting environmental changes with high accuracy [10] illustrate how this integration can provide detailed and robust insights into environmental dynamics, facilitating informed decision-making for the sustainable management of water resources and the mitigation of erosion and sedimentation impacts.
SisBaHiA (Base System of Environmental Hydrodynamics) is a tool focused on hydrosedimentological and water quality modeling in estuarine and coastal environments. Its use is essential to obtain understandings about the influence of currents, tides, and sedimentation processes on the configuration of port areas. Through SisBaHiA, it is possible to identify how port morphology is affected by these natural factors and develop effective mitigation strategies against erosion and siltation. The application of this model allows the development of specific solutions that aim to preserve the functionality and sustainability of port infrastructures, ensuring their operability in the face of challenges imposed by coastal dynamics and sedimentological processes [11, 12, 13].
Climate change presents notable challenges to port operations, affecting precipitation patterns, sea levels, and the occurrence of extreme weather events. Research focusing on the protective effects of coral reefs, seagrass meadows, and mangroves underlines the vital importance of maintaining healthy coastal ecosystems. These ecosystems play a crucial role in defending against erosion and providing valuable ecosystem services, contributing significantly to the protection of port areas from adverse environmental impacts [14, 15].
In addition, assessing soil quality and understanding its influence on sediment transport are important for the development of effective mitigation strategies. Using soil quality indices to compare different methods offers an objective way to assess soil health and its ability to sustain vegetation, a crucial element in preventing erosion. This approach allows for a better understanding of how land management practices can be optimized to protect coastal and port areas from degradation [16].
The challenge lies in the effective adaptation of integrated predictive modeling approaches to capture the complexity and variability of climate impacts, both on a local and global scale, in port zones. The main gap lies in the definition of specific methodologies and the implementation of high-resolution data that allow an accurate prediction of the interaction between extreme precipitation events and sedimentary and water dynamics, taking into account future climate variations [17, 18].
Integrated predictive modeling is essential for water resource management, urban planning, climate change adaptation, and disaster mitigation. It combines several models and techniques to predict the impact of environmental, social, and economic variables on complex systems. Integrating hydrological models such as SWAT with water quality models, such as SisBaHiA, and land use models provides a comprehensive understanding of the processes studied. This approach is vital for addressing today’s environmental, social, and economic challenges, offering a powerful tool for complex systems analysis, accurate predictions, and informed decision-making at various scales, enabling the development of sustainable and resilient solutions [19].
This work aims to improve the understanding and practices in integrated predictive modeling to predict and mitigate impacts of extreme precipitation events in ports, taking into account meteorological, hydrological, sedimentological, oceanographic, and geographic variations. Thus, a new modeling methodology is proposed to increase port resilience and sustainability against climate change. The research seeks to advance knowledge in hydrology, offering practical recommendations to strengthen port operations in the face of the climate challenge.
The gap highlighted, emphasizing the need for refinement in modeling methodologies and understanding of interactions in hydrological and sedimentological systems during such extreme events, aligns with the goal of this research. Improving predictive modeling to predict and minimize impacts requires an in-depth understanding of these dynamics, underlining the importance of exploiting these gaps in studies with the use of advanced technologies and analysis under different climatic conditions.
Conducting this research offers significant benefits, including enhancing the ability to predict and mitigate risks associated with extreme weather events in ports. This facilitates the development of more effective strategies to manage water and sedimentary resources, increasing the resilience of port infrastructures. In addition, it contributes to the environmental and economic sustainability of port operations by informing public policies and management practices that are adaptive to climate change.
2. Methodology
The study explored the integrated modeling of hydrological and sedimentological processes in Brazil in the Paraíba do Sul and Itabapoana River Basins, as well as in the adjacent coastal zone, using two modeling systems: the Base System of Environmental Hydrodynamics, SisBaHiA [20], for hydrosedimentological aspects in the adjacent coastal region and the Soil & Water Assessment Tool, SWAT [21], for hydrological modeling of the river basins of interest.
SisBaHiA, developed at COPPE|UFRJ since 1987, has been expanded and improved over the years, being adopted in several studies and projects related to the modeling of water bodies. SWAT, on the other hand, under continued development by the Agricultural Research Service and Texas A&M University since 1996, is widely used to calculate flows and loads of water, nutrients, and sediments, based on specific information about water, soil properties, topography, vegetation, and soil management practices in the watershed. The combination of these models allowed for detailed simulations of river flows and suspended sediment concentrations, providing a solid basis for environmental assessments and decision-making.
2.1 Hydrological modeling system: SWAT
Considering the lack of data on TSH concentrations in the Paraíba do Sul and Itabapoana rivers, it was proposed to estimate these concentrations using the public domain system SWAT—Soil & Water Assessment Tool.
SWAT is a time-evolving model and usually works on a daily time frame. One of its advantages is the possibility of making simulations for short or long time series. It considers the watershed divided into sub-basins based on relief, soils, and land use and thereby preserves the spatially distributed parameters of the entire basin and the homogeneous characteristics within the basin. The input data for each sub-basin can be grouped or organized according to the following categories: climatic, Hydrologic Response Units (HRUs), ponds/wetlands, groundwater, main water course, and sub-basin drainage. To generate the HRUs in each sub-basin, a sensitivity level is adopted, eliminating land use classes with an area smaller than the established value [22].
The implementation of SWAT requires several input parameters for a coherent representation of the physical characteristics of a watershed. In the specific case of the present study, a hydrological model was developed with two outlets, corresponding to the hydrographic basins of the Paraíba do Sul and Itabapoana rivers (Figure 1).
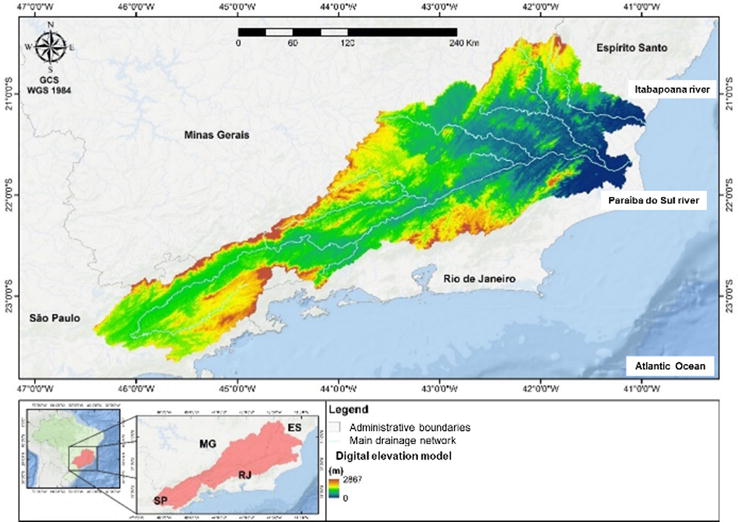
Figure 1.
Digital elevation model with the identification of the modeled hydrographic basins and their respective main drainage.
In the development of hydrological modeling in SWAT, the parameters were divided into Digital Elevation Model, land use and occupation data, and pedological and meteorological data for each watershed, as detailed below.
2.1.1 Digital elevation model
To simulate the physical and chemical processes of a river basin, we start with the MDE. It is necessary for the mathematical representation of the altimetric surface to be studied, through the coordinates X, Y, and Z. The MDE was a mosaic that originated from the composition of 21 images of the ASTER Global Digital Elevation Model V003 satellite [23] with a resolution of 30 m. To fulfill the objective of the present study, the hydrographic basins modeled were the basins of the rivers: Paraíba do Sul and Itabapoana, as shown in Figure 1.
2.1.2 Land use and occupation map
In the process of occupying a territory, several natural and cultural factors are preponderant. And in this way, the configuration of land use and occupation directly influences the ecological systems of the region, producing effects on its landscape. Knowledge of land use and occupation is fundamental for space quality management, as well as essential for understanding the erosion processes and susceptibility to erosion of an area. For the SWAT modeling, a mosaic composed of 04 Vector Thematic Bases of Land Cover and Land Use of the states of Espírito Santos, Minas Gerais, Rio de Janeiro, and São Paulo of the Brazilian Institute of Geography and Statistics—IBGE for the year 2018 was used at a scale of 1:1,000,000, cf. Figure 2. It should be noted that the data were obtained from the website of the National Spatial Data Infrastructure (INDE) [24].
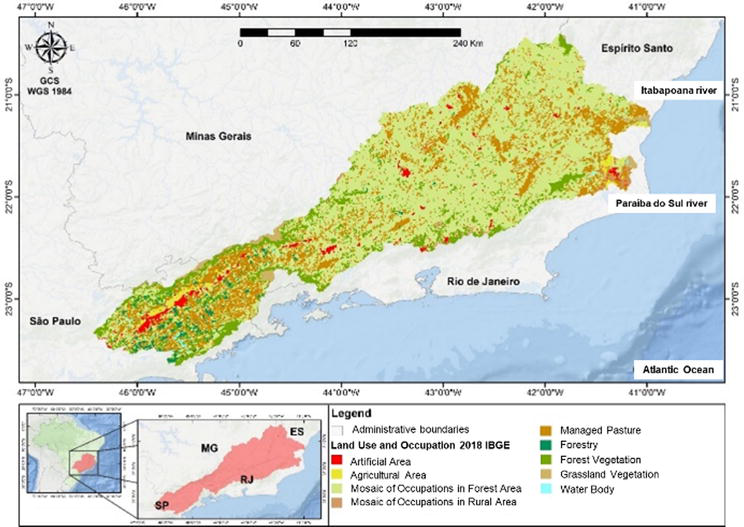
Figure 2.
Land use and occupation map used in hydrological modeling from the vector thematic bases of land cover and land use of the states of Espírito Santos, Minas Gerais, São Paulo, and Rio de Janeiro of the IBGE for the year 2018.
2.1.3 Pedological map
The pedological data used for modeling were prepared by the Brazilian Institute of Geography and Statistics – IBGE within the scope of the publication Macrocharacterization of Natural Resources of Brazil, which presents part of the results obtained throughout the Natural Resources Mapping project, where the Brazilian natural resources were mapped and described, at a scale of 1:250,000, related to the themes geology (rocks), geomorphology (relief), pedology (soils), and vegetation. The soil types represent the soil classes of Brazil, based on the Brazilian Soil Classification System (order level). These classes are grouped according to similar morphological characteristics that are repeated throughout the country; see Figure 3. Pedological data were obtained from the INDE website [24].
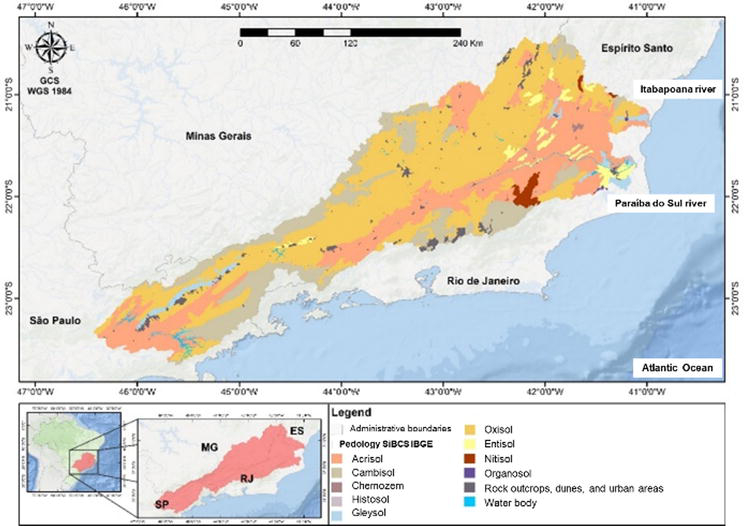
Figure 3.
Pedological map used in hydrological modeling from the publication macrocharacterization of natural resources of Brazil, prepared by IBGE, with classification of soils at the order level.
As the original SWAT database refers to the standards of North American soil parameters, correspondence was made between the classes of the Brazilian Soil Classification System (SiBCS) and the taxonomy of the Food and Agriculture Organization (FAO), cf. supervised by Embrapa Soils [25].
2.1.4 Weather data
The meteorological data used for hydrological modeling were: precipitation, minimum and maximum temperatures, relative humidity, and wind and solar radiation. The locations of the stations are distributed in the modeling domain as shown in Figure 4. These data were obtained through the POWER Project through the electronic address POWER | Data Access Viewer [26]. This project provides solar and weather datasets sourced from NASA research to support renewable energy, building energy efficiency, and agricultural needs. According to [27], the project’s products are satellite-based, and models have been shown to be accurate enough to provide reliable solar and meteorological resource data in regions where surface measurements are scarce or non-existent. Documentation of the project and its methodology can be found on the NASA POWER | Docs [28].
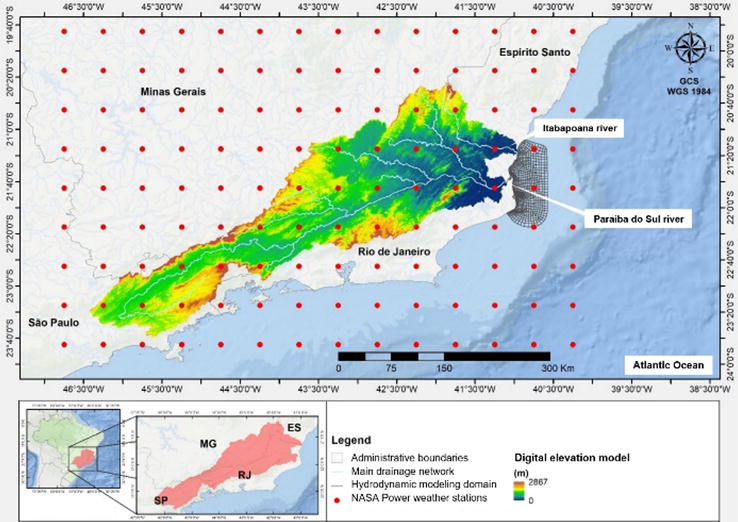
Figure 4.
Weather data stations extracted from POWER | Data Access Viewer from NASA Prediction of Worldwide Energy Resources.
2.2 Hydrosedimentological modeling system: SisBaHiA
The models used in the hydrosedimentological analyses of the adjacent coastal zone discussed in this study are part of SisBaHiA—Base System of Environmental Hydrodynamics. Technical details about the methodology adopted in the SisBaHiA models as well as the mathematical and numerical formulation of the system models and the imposition of boundary conditions can be seen in [29].
The use and availability of the models developed in SisBaHiA are obtained free of charge through SisBaHiA [20], where you will find instructions on how to install the system. The overall strategy of the system is based on a hierarchical database system, in order to provide reliability and ease of manipulation of data and results to users.
In the development of hydrosedimentological modeling in SisBaHiA, the parameters were divided into Digital terrain modeling, Fluvial and sedimentological constraints, and Meteorological and oceanographic constraints. The quantification of sedimentation was done through hydrosedimentological computational modeling with six coupled models running simultaneously, namely: Hydrodynamic Model, Salinity and Temperature Transport Model, Non-Cohesive Sediment Model, Cohesive Sediment Model, Wave Model and Generation with local winds, and Wave Propagation Models generated outside the local domain.
2.2.1 Digital terrain modeling
In the development of maps to delineate the modeling domain, we move on to the discretization of this domain using a finite element mesh; a detailed approach is illustrated in Figure 5. This step is complemented by the inclusion of informative layers, with bathymetry data presented in Figure 6, and the definition of the amplitude of the equivalent roughness of the bottom, varying according to the material present in the bed.
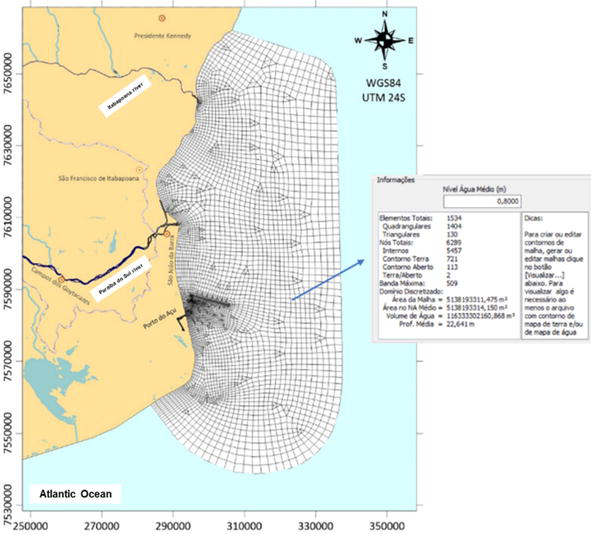
Figure 5.
Discretization of the modeling domain into triangular and quadrangular subparametric finite elements. Triangular elements are quadratic, and quadrangular elements are biquadratic.
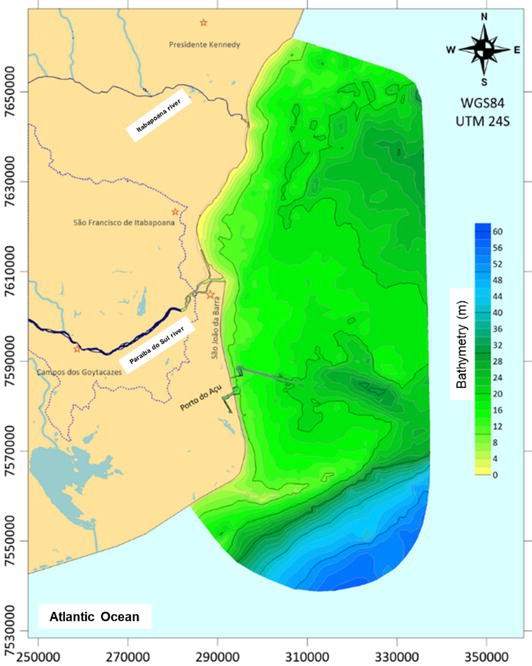
Figure 6.
Bathymetry map resulting from digital modeling of the domain of interest in a finite element mesh, as shown in the map in
2.2.2 Fluvial and sedimentological constraints
The analysis of the liquid and solid flows from the Paraíba do Sul and Itabapoana rivers, covering both fine suspended sediments and more granular forms, reveals important nuances about the sedimentary processes of the region. Using the SWAT model to calculate both the liquid flows, illustrated in Figure 7, and the concentrations of suspended sediments (Figure 8), we focused on components such as clays and fine silts. These fine sediments, often categorized as Total Suspended Sediments (TSS), are essential to understanding sedimentary transport in the water column, highlighting the complexity and dynamics of the river systems under study.
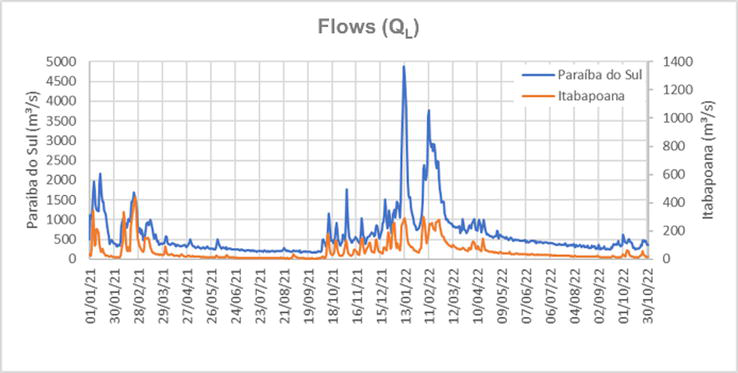
Figure 7.
Hydrographs of simulated net flows for the hydrographic basins of the Paraíba do Sul and Itabapoana rivers by the SWAT hydrological model from 01/01/2021 to 10/31/2022.
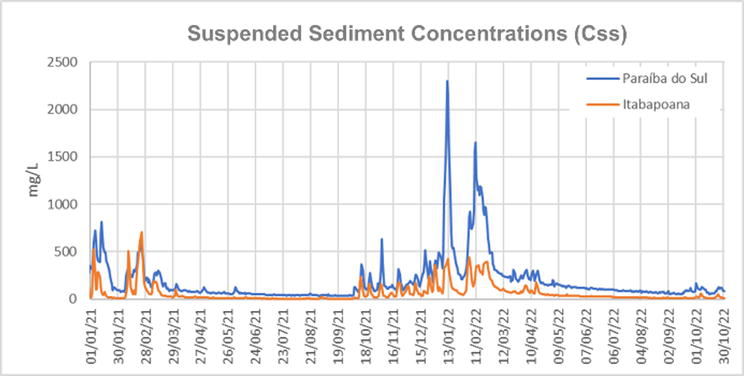
Figure 8.
Hydrographs of simulated TSS concentrations for the Paraíba do Sul and Itabapoana river basins by the SWAT hydrological model from 01/01/2021 to 10/31/2022.
In the context of sedimentology of fluvial and estuarine environments, modeling the solid flows of sediments, such as coarse silt, sands, and even gravel, is important. In the upstream section of the rivers, within the modeling domain, these flows are calculated based on an equilibrium condition, assuming that the sediment load carried by the rivers is equal to their transport capacity. This capacity is influenced by variables such as the flow and velocity of the water, as well as the effects of the tide. Therefore, a sedimentary equilibrium is presumed, where there is no deficiency of sediments upstream [29].
For the non-cohesive sediments, a spatial distribution was considered according to sedimentary typologies described by [30]. Thus, the sedimentological characterization of the region was based on previous studies that mapped the distribution of sediments, providing a critical reference for the understanding of sedimentary processes.
2.2.3 Meteorological and oceanographic constraints
In this section dedicated to meteorological and oceanographic conditions, the study details the use of data from five stations of the FES, Finite Element Solution [31], and six stations of the HYCOM, Hybrid Coordinate Ocean Model [32], to generate data on astronomical and meteorological tides.
The data were applied to all 113 maritime boundary nodes defined as “Open Contour.” This procedure allowed a refined understanding of the influences of tides on the studied system, essential for hydrodynamic and sediment transport analyses, highlighting the interconnection between oceanographic and meteorological phenomena in marine environmental modeling. The locations of the stations used are illustrated in Figure 9.
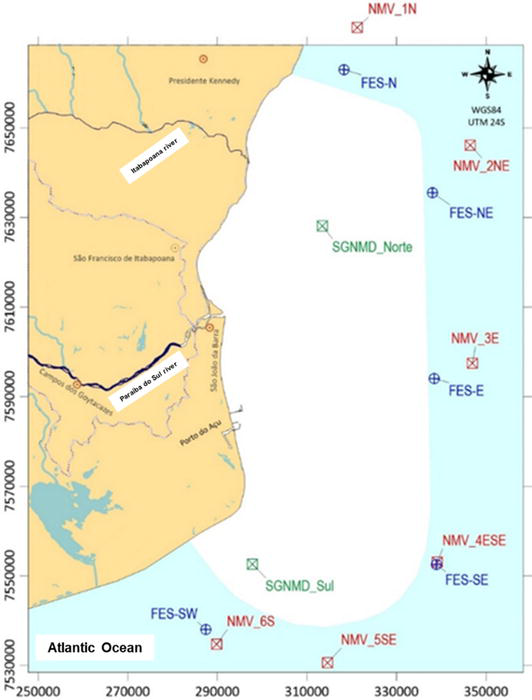
Figure 9.
Positioning of the five stations of harmonic constants of astronomical tides of the FES and the six stations of the HYCOM with values of NMV—variable mean level and of the SGNMD—differential mean level generator series stations for induction of drift currents.
Regarding astronomical tides, we highlight the methodology used to distribute their effects along approximately 200 km of maritime border. This process was carefully carried out by weighting values from five stations in the FES2014, thus ensuring an accurate and detailed representation of the rise in astronomical tide levels (Figure 10).
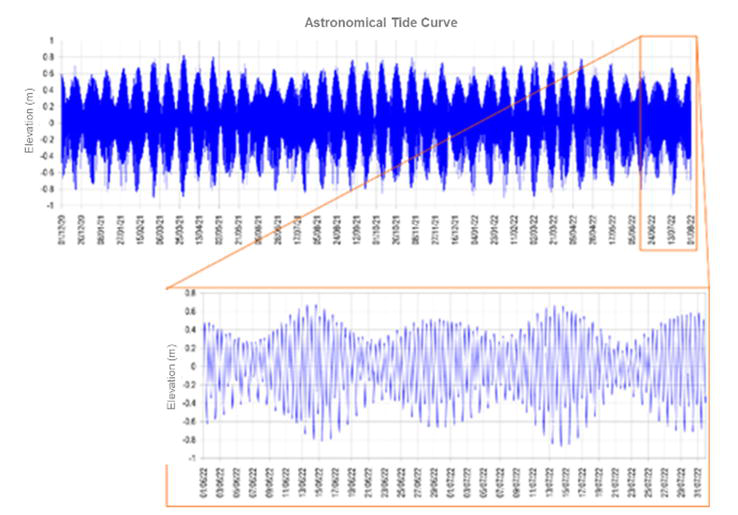
Figure 10.
Elevation of the astronomical levels imposed on the model at the open boundary of the modeling domain.
In the modeling process, described sea level variations attributable to non-astronomical factors, commonly referred to as meteorological tides, were mapped along approximately 200 km of maritime boundary. This distribution was performed using data from six Variable Mean Level (NMV) stations, obtained from HYCOM (Figure 11). These data were integrated with astronomical tidal data, strengthening the model’s accuracy in predicting sea level variations.
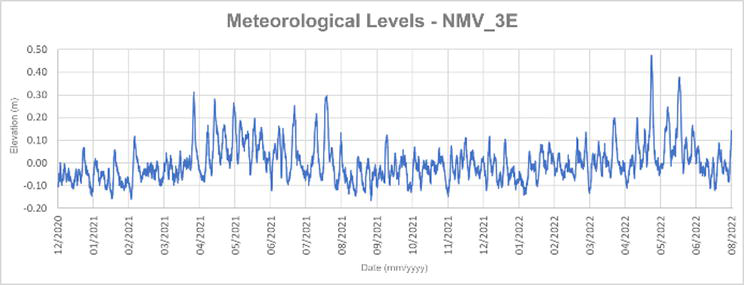
Figure 11.
Meteorological levels imposed on the model at the open boundary of the modeling domain. The above series refers to station ‘NMV_3E’ only. Similar graphs can be produced for all variable medium level stations.
The induction of drift currents due to meteorological effects was performed by incorporating HYCOM data from two SGNMD stations located on the continental shelf (Figure 9). This process involved the weighted assimilation of these data, introducing them into the Hydrodynamic Model of SisBaHiA as boundary conditions of Differential Mean Level. The coastal drift currents resulting from this methodology were characterized by distinct directions, positive to the east and negative to the west, reflecting the coastal dynamics influenced by meteorological variations (Figure 12).
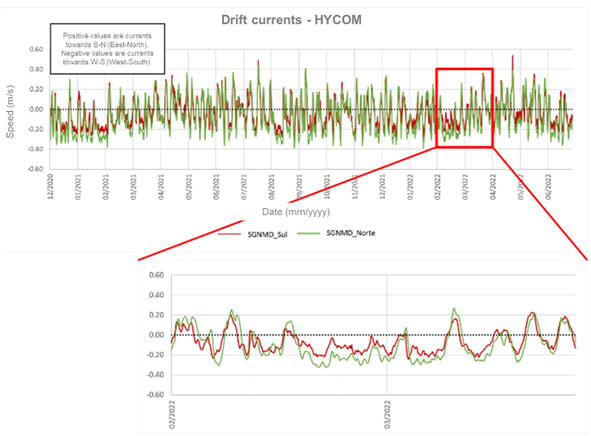
Figure 12.
Coastal drift currents obtained from HYCOM and inserted as differential mean level boundary conditions in the SisBaHiA hydrodynamic model. Positive values indicate currents to the east and negative values to the west. See position of SGNMD inductors in
Salinity and temperature data were collected using the HYCOM model for the study period. These data, which are important for the analysis of oceanographic conditions, were extracted at the specific points of Mean Variable Level (NMV). The graphical representation of these data, as illustrated in Figure 13, reflects the mean values in the water column, providing a clear view of thermohaline variations over time.
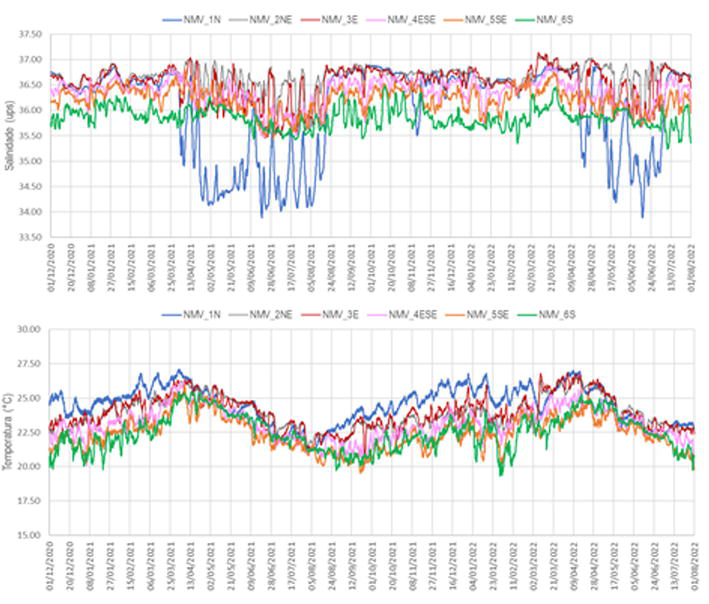
Figure 13.
Salinity and temperature series at the stations illustrated in
To incorporate the dynamic effects of winds into the oceanographic study, we used ERA5 reanalysis data [33], detailing the intensity and direction of the winds as shown in Figure 14. This procedure significantly enriches the modeling, allowing a more accurate simulation of meteorological conditions and their influences on maritime dynamics. The data, sourced from the ECMWF (European Centre for Medium-Range Weather Forecasts) through the ERA-Interim and ERA5 reanalysis, cover the years 2021 and 2022, providing a solid basis for the analysis of wind impacts on oceanographic conditions.
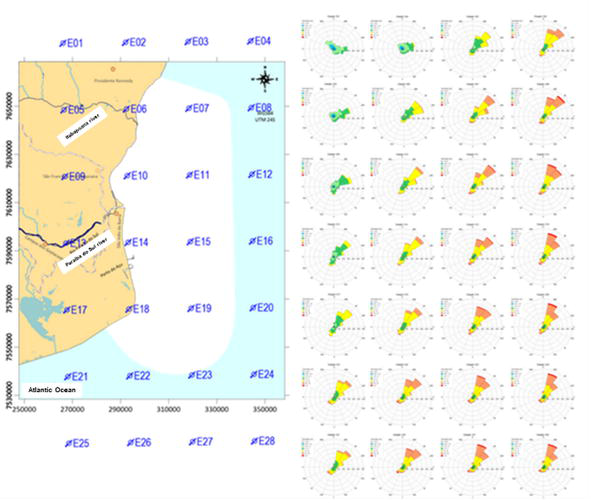
Figure 14.
Map indicating wind positions and compass rose patterns for each season, based on wind data sourced from ECMWF reanalysis—ERA-Interim and ERA5, covering the years 2021 and 2022.
The action of winds in the modeling domain acts on the induction of drift currents and the generation of waves. The waves, in turn, induce radiation voltages that act on the current field in the shallower coastal zone, especially in the surf zone. Wave data were extracted from the ERA5 reanalysis model, run by ECMWF [33].
The data obtained constitute a time series of significant wave height, peak period, and average wave direction, with information every 1 hour, so the model minimally considers the interference of tidal level oscillation in wave propagation.
Analyzing the wave data, it can be seen that the waves with the highest probability of occurrence are from the southeast and south quadrants, between 110° and 200°, with a peak period predominantly between 8 and 12 s and a significant height between 1.5 and 2.0 m.
2.3 Calibration and validation of computational models
The calibration and validation of computational models represent fundamental steps in the development of reliable and accurate simulations of hydrosedimentological processes. In them, we ensure that the models are able to reproduce natural processes with fidelity, considering the complex interactions between the hydrological and sedimentary components of the systems of interest [34]. Calibration involves adjusting model parameters until the outputs match as closely as possible to the observed data, while validation tests the model’s ability to predict conditions different from those used in calibration [35].
Below we present the methodologies applied in the calibration and validation of the computational models used in this study, SWAT and SisBaHiA.
2.3.1 SWAT
Calibration and validation were performed automatically using the Calibration and Uncertainty Procedures (SWAT-CUP) program [36], specifically the Sequential Uncertainty Fitting (SUFI2) algorithm. Further details on the calibration and validation procedures are detailed in the user manual of the aforementioned program—SWAT-CUP: SWAT Calibration and uncertainty programs—A user manual [37]. In Figure 15, it is possible to observe the connection of the hydrodynamic modeling domain, SisBaHiA, with the hydrological modeling domain, SWAT, for each hydrographic basin of interest—Paraíba do Sul and Itabapoana.
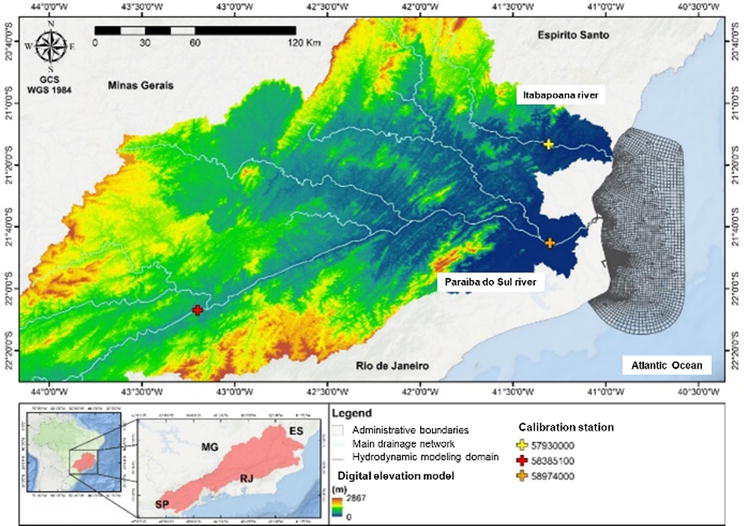
Figure 15.
Connection of the hydrodynamic modeling domain, SisBaHiA, with the hydrological modeling domain, SWAT, for each watershed of interest—Paraíba do Sul and Itabapoana. And location of the calibration stations for liquid flow—57930000, Santa Cruz in Mimoso do Sul on the Itabapoana River; 58974000, Campos—Municipal Bridge in Campo dos Goytacazes on the Paraíba do Sul River and for comparison of the concentration of OSH—58385100, Simplício Montante HPP in Três Rios on the Paraíba do Sul River, National Water Agency (ANA).
In SWAT, the maximum simulation period is determined by the comprehensiveness of the climate data. In the study in question, for the liquid flows, the most consistent data to perform the calibration and validation were those of the stations: 57930000, Santa Cruz in Mimoso do Sul on the Itabapoana River and 58974000, Campos—Municipal Bridge in Campo dos Goytacazes on the Paraíba do Sul River, cf. illustrated in Figure 15. The calibration period was from 01/01/2012 to 12/31/2015 and the validation period from 01/01/2016 to 12/31/2018.
For TSS concentrations, the analyzed data available from ANA at the calibration stations showed inconsistent results, as described by [38]. In order to compare the modeled TSS concentrations, the station used as a reference was the 58385100 code HPP, Simplício Montante HPP of the National Water Agency (ANA) located in Três Rios in the Paraíba do Sul River Basin. The suspended sediment transport curve used was
In order to evaluate the efficiency of the simulations, the following performance statistics were used: Nash-Sutcliffe Efficiency Coefficient (COE), Coefficient of Determination (R2), Ratio between the Mean Standard Error and the Standard Deviation of the Observations (RRR), and Percentage Trend (PBIAS) [39].
The parameters adjusted in the calibration of the liquid flow of the hydrological model were: Value of the Number Curve for the humidity condition II (NC2); Limit depth of the water level above which the base flow is released by the channel (GWQMIN); Time interval for aquifer recharge (GWDelay); and Recession Constant for Base Flow (AlphaBF).
From Figures 16–21, it is possible to observe that the model simulated, in general, very well the values of net flows for the BH of the Paraíba do Sul River. For the Itabapoana river basin, the simulated period can be considered satisfactory; however, the statistics present worse classified values than in the previously mentioned watershed.
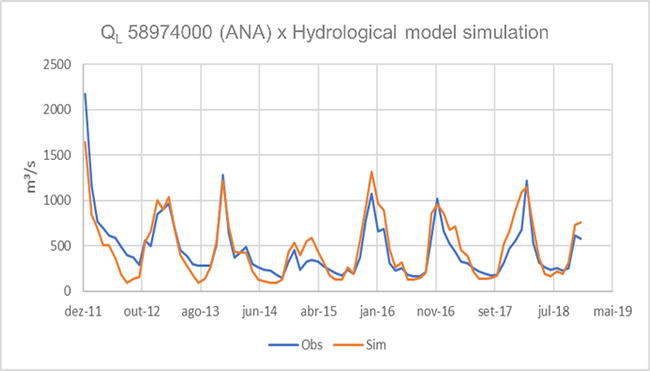
Figure 16.
Calibration: Illustration of the hydrograph of the liquid flow of the calibration station 58974000, Campos—Municipal Bridge in Campo dos Goytacazes—National Water Agency (ANA) and calibrated hydrograph obtained by the hydrological model (SWAT).
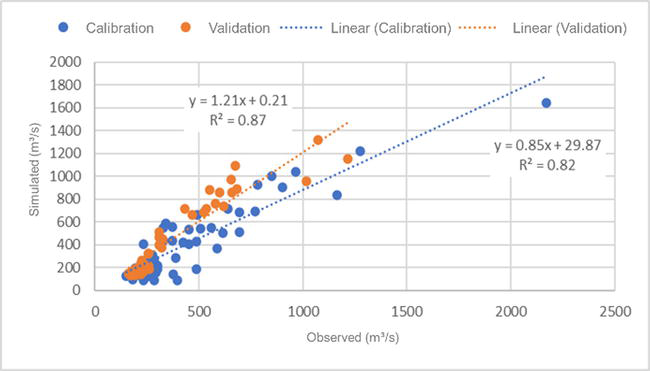
Figure 17.
Monthly net flow (m3/s) simulated and observed for the calibration and validation periods, Paraíba do Sul River.
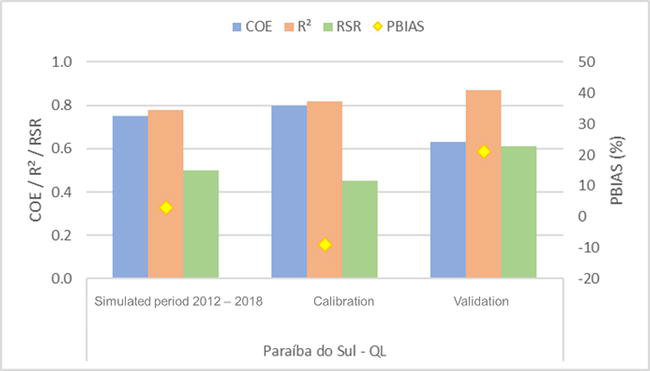
Figure 18.
Performance statistics of the calibrated and validated model, Paraíba do Sul River.
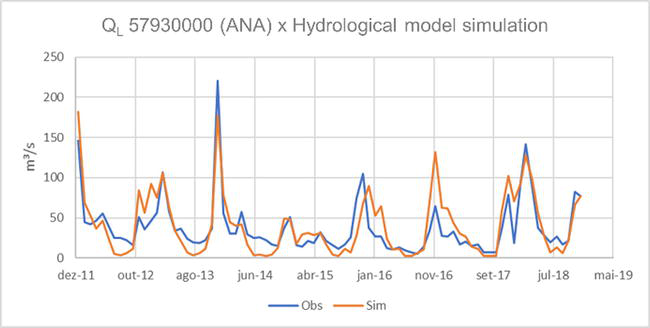
Figure 19.
Hydrograph of the liquid flow of calibration station 57930000, Santa Cruz in Mimoso do Sul—National Water Agency (ANA) and calibrated hydrograph obtained by the hydrological model (SWAT).
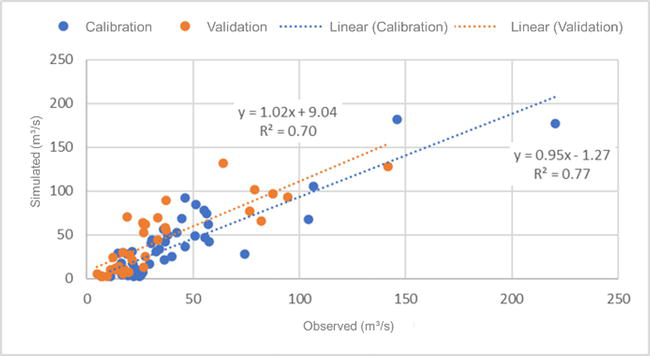
Figure 20.
Monthly net flow (m3/s) simulated and observed for the calibration and validation periods, Itabapoana River.
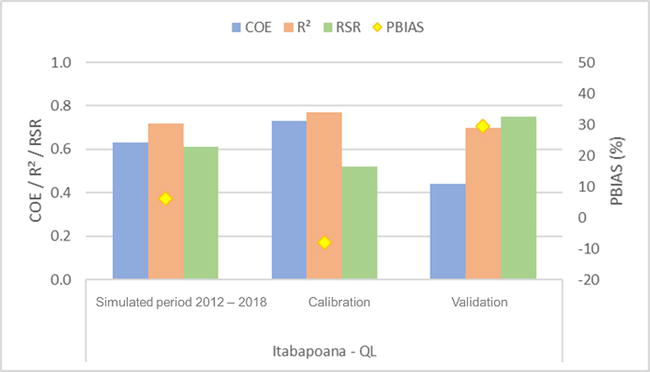
Figure 21.
Performance statistics of the calibrated and validated model, Itabapoana River.
Figure 22 illustrates the comparison of the daily TSS concentration calculated based on the key curve of [38] applied to the net flow of the 58385100 comparison station, HPP Simplício Montante in Três Rios, and the daily flow simulated by SWAT after calibration.
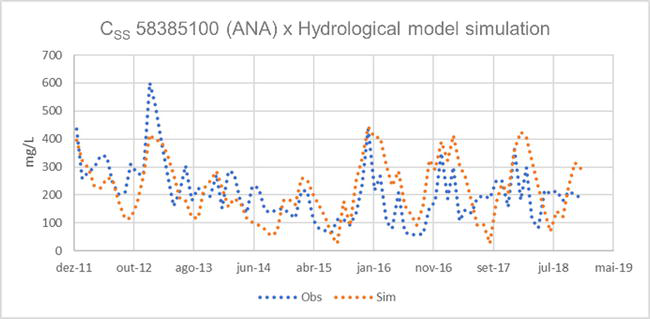
Figure 22.
Hydrograph of the TSS concentration calculated based on the key curve of the preliminary diagnosis of the hydrosedimentological conditions of the Paraíba do Sul River and its main tributaries (1998) applied to the net flow of the 58385100 comparison station, HPP Simplício Montante em Três Rios—Agência Nacional de Águas (ANA) and calibrated hydrograph obtained by the hydrological model (SWAT).
Under the conditions exposed, the results presented, as well as previous studies described, we consider that the result of the TSS concentrations obtained by the hydrological model and its variability are coherent. Therefore, utilizing their findings as input for the SisBaHiA hydrosedimentological model.
2.3.2 SisBaHiA
The critical analysis of model calibration and validation procedures, as outlined by [29], highlights the importance of the accuracy of the input data for the reliability of the modeling results. SisBaHiA models demonstrate high coherence with field data in multiple aspects, including shoreline geometry, bathymetry, water levels, and current velocity, with significant improvements after calibration. Accuracy in modeling sedimentological processes and wave propagation depends on correct formulation and accurate particle size data. The conditions to achieve high coherence involve the accuracy of the geometry of the water body, flow forcings, intensities of contaminant sources, and sedimentological variables.
The calibration of the environmental hydrodynamics models in SisBaHiA was a process that followed the following order:
Level 1. Geometric calibration
Comparative maps of Level 1 calibration are omitted, related to geometry, bathymetry, and roughness amplitudes, since they result from direct data interpolation and are duly verified. As exposed, the domain of interest is geometrically adequate, as well as the discretization of the mesh is sufficiently refined to capture effects of interest.
Level 2. Hydrodynamic and sedimentological calibration
The first step in the level verification process focuses on defining the boundary conditions at the open border. The record made at station T1—Access Bridge [40] was adopted as the basis for generating records of tide levels along the open border nodes. The station was used to check tide levels from 21/12/2020 to 31/10/2022.
Figure 23 shows that, despite the small discrepancies between the measured Average Daily Levels (NMDia) and those calculated at the T1—Access Bridge station, they do not significantly influence the astronomical tidal amplitudes. These variations are attributed to the Variable Mean Level (NMV) conditions at the open frontier, derived from the HYCOM results. In addition, Figure 24 reveals that the tidal amplitudes, both measured and modeled, have great similarity, although punctual variations in the maximum or minimum elevations may occur due to meteorological tides, affecting the NMDia.
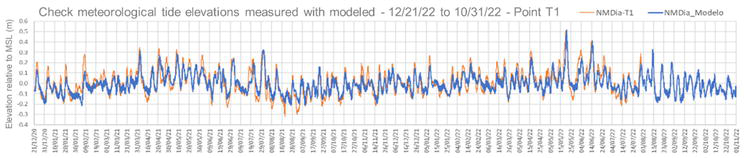
Figure 23.
Verification of meteorological tides that modify the average daily level (NMDia) obtained from measurements at the T1 station—Access bridge and values calculated by the model, between 12/21/20 and 10/31/22. The measured data available was up to 07/31/2022. Inequalities in NMDia cause the small differences on some days between measured and modeled tidal elevations shown in
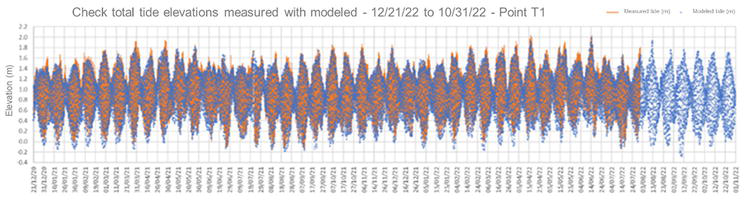
Figure 24.
Verification of measured and modeled tide levels at station T1—Access bridge, between 12/21/20 and 10/31/22. The measured data available were up to 07/31/2022. Analyzing the graphs, it is evident that the modeling results are visually very close to the measured values. The slight differences are due to inaccuracies in meteorological tidal variations obtained from HYCOM results.
3. Results
In this segment of the book, we devote attention to the analysis of the results from the modeling and analysis of data that illustrate the hydrological and sedimentological processes acting in the hydrographic basins of the Paraíba do Sul River, Itabapoana, and in the adjacent coastal region, with special focus on the terminals of the Port of Açu.
The Port of Açu is a port and industrial complex, operating since 2014 in deep waters. It plays an important role in operations related to oil and gas, mining, logistics, and the energy sector, standing out for its ability to accommodate large ships thanks to its considerable depth. In the environmental context, the maintenance of its navigability and the expansion of its activities imply dredging procedures, which are essential for the control of siltation and the guarantee of adequate depth for port operations.
The results presented show the dynamics of water flows and suspended sediments in the period from 01/01/2021 to 10/31/2022, highlighting how watersheds respond to extreme events and the influence of meteorological phenomena, especially the South Atlantic Convergence Zone (SACZ). This analysis allows us to understand the silting and erosion processes that impact the terminals of the Port of Açu. Throughout this chapter, we have emphasized the observed impacts, highlighting the importance of using integrated models in the efficient management of water resources and in the mitigation of adverse environmental impacts.
The results obtained in the SWAT hydrological modeling, both for the net river flows and the TSS concentrations, were used as input data for the hydrosedimentological modeling carried out by SisBaHiA for the period from 01/01/2021 to 10/31/2022. These net flows and TSS concentrations for the rivers of interest, Paraíba do Sul and Itabapoana, are illustrated cf. Figures 7 and 8.
We will proceed with the identification of extreme events and hydrological disasters that occurred between 01/01/2021 and 10/31/2022, an essential step to understand the responses of the river basins and the Port of Açu to such events. Hydrological modeling plays a significant role in the analysis of these responses, directly influencing the management and sustainability of the port. This discussion aims to elucidate how hydrological processes affect both sedimentary dynamics and port operations, emphasizing the importance of integrating hydrological modeling and environmental management practices.
In order to understand the dynamics of extreme precipitation events and their evolution to hydrological disasters in the northern region of the state of Rio de Janeiro, it is essential to analyze the relationship between the recorded precipitation and the variations in the levels of the Paraíba do Sul and Itabapoana rivers. The choice of the station 58974000 Campos—Ponte Municipal as the focal point allows us to adequately illustrate the rainfall and hydrological behavior of the Paraíba do Sul River during the period studied (Figure 25).
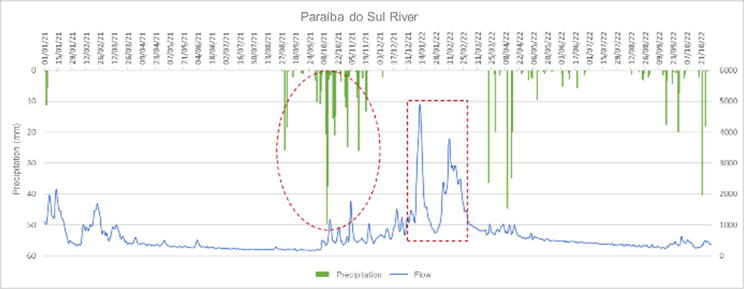
Figure 25.
Precipitation (mm) and flow (m3/s) records recorded at the 58974000 Campos—Ponte Municipal station, from 01/01/2021 to 10/31/2022.
The data collected indicate that the extreme rainfall event that occurred at the end of 2021 was the most significant in the analyzed interval. However, it is interesting to note that the maximum flows, which culminated in a hydrological disaster in the region, were recorded in the months of January and February 2022, demonstrating an apparent disconnect with the immediate local precipitation.
This observation suggests that the hydrological disaster must be associated with a broader event, involving the Paraíba do Sul River basin as a whole. It is important to highlight that this basin extends through the states of Minas Gerais, Rio de Janeiro, and São Paulo, covering a considerable and complex area. Therefore, the analysis of extreme events and hydrological disasters requires an integrated view that considers the contributions of the entire watershed, reflecting on the interactions between the various climatic and geographic factors that influence the behavior of rivers in this region.
The analysis of meteorological information provided by the National Institute of Meteorology [41] through the Technical Note on the extreme events of February 2022 in Brazil provides a solid basis for understanding the hydrological disasters in the northern region of the ERJ and their connection with the Paraíba do Sul River basin. The intense rains, with episodes concentrated in the states of Rio de Janeiro and Minas Gerais, both integral parts of the watershed, highlight the regional interconnection in the observed impacts.
The events described resulted in severe consequences, including loss of life, flooding, and landslides. The role of the South Atlantic Convergence Zone (SACZ) was unique, with episodes that provided rainfall accumulations above the historical average, in line with the significant flows observed. Specifically, the exceptional accumulated rainfall in Itaperuna, with 436.7 mm with a significant deviation of 325.9 mm from the normal February average in the state, which is 110.8 mm, illustrates the magnitude of the events and their direct influence on river dynamics and subsequent disasters.
This set of evidence reinforces the conclusion that the observed hydrological disasters are linked to comprehensive meteorological phenomena and their influence on the Paraíba do Sul River basin, evidencing the need for an integrated management of water resources that considers the complex meteorological and hydrological interactions.
The analysis of the Itabapoana River basin, using the station 57836000 PCH Pedra do Garrafão Downstream, reveals a hydrological response that is directly aligned with the local rainfall accumulations, in contrast to the observations made for the Paraíba do Sul River basin. This behavior indicates a more immediate correlation between local rainfall and hydrological variations in the Itabapoana basin, as illustrated by Figure 26. In addition, the influence of the SACZ on the accumulated rainfall in February 2022 was significant, evidencing the impact of this meteorological phenomenon in this region as well.
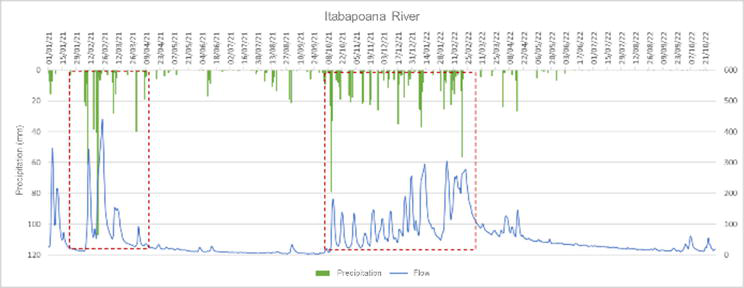
Figure 26.
Precipitation (mm) and flow (m3/s) records recorded at the 57836000 PCH Pedra do Garrafão downstream station, from 01/01/2021 to 10/31/2022.
In February 2021, the Itabapoana basin experienced a period of intense rainfall, corroborated by the Joint Alert for Heavy Rainfall in the Southeast Region [42] issued by INMET for the Southeast Region of Brazil, which was under the influence of the SACZ. The persistent, stationary nature of the SACZ, coupled with the associated rainfall pattern, resulted in heavy rainfall in a short period of time, accumulating high volumes of water over the days.
These extreme precipitation events were efficiently captured by the hydrological modeling performed, as shown in Figures 7 and 8. This observation underlines the relevance of employing comprehensive watershed modeling, which considers not only local variables but also the impacts of broader meteorological phenomena such as the SACZ. Such an approach is indispensable for a holistic understanding of hydrological dynamics and for the development of effective strategies for water resource management and disaster mitigation related to extreme precipitation events.
The results obtained by SisBaHiA offer a detailed view of the silting and erosion processes in the study area, covering the period from 12/21/2020 to 10/31/2022. It is possible to analyze sediment dynamics considering several classes of sediments, from TSS to carbonate gravel, with updates every 3 hours. This detailing capability allows for the production of specific maps, such as the one mentioned in Figure 27, making it easier to understand sedimentological changes over time and between different types of sediments.
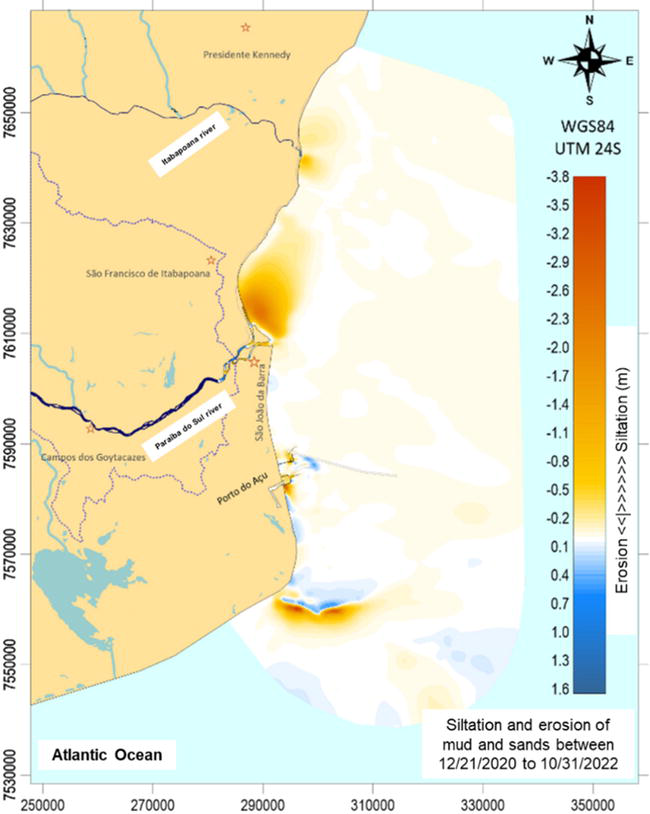
Figure 27.
Map of bathymetry alteration isolines due to silting and erosion from 12/21/2020 to 10/31/2022, considering existing sediments at the bottom and the TSS brought by the Paraíba do Sul and Itabapoana rivers. The T1 and T2 regions are zoomed in in the following figure. See siltation figures in T1 and T2 on the previous page.
The analysis of Figure 27 highlights the detailed visualization of the silting and erosion processes in the studied area of Porto do Açu, using isolines to represent bathymetric variations. Negative values indicate depth loss due to siltation, while positive values indicate depth gain resulting from erosive processes. This differentiation is important to understand sedimentological changes and their implications for the maintenance of navigability and the management of port infrastructures.
Figure 28 details the bathymetric variations in the areas of terminals T1 and T2, using colors to indicate erosion (blue tones) and siltation (brown tones). This allows for a visual understanding of depth changes, which is essential for assessing navigability and sedimentary management needs specific to each port region. At terminals T1 and T2 of the Port of Açu, there is significant siltation, with a predominance of fluid mud. In T1, about 676,000 m3 of sediments were deposited, with 88% of fluid mud. In T2, silting totaled approximately 938,300 m3, 76% of which was also fluid mud. These data indicate the need for specific strategies for sediment management and maintenance of the depth of navigation channels.
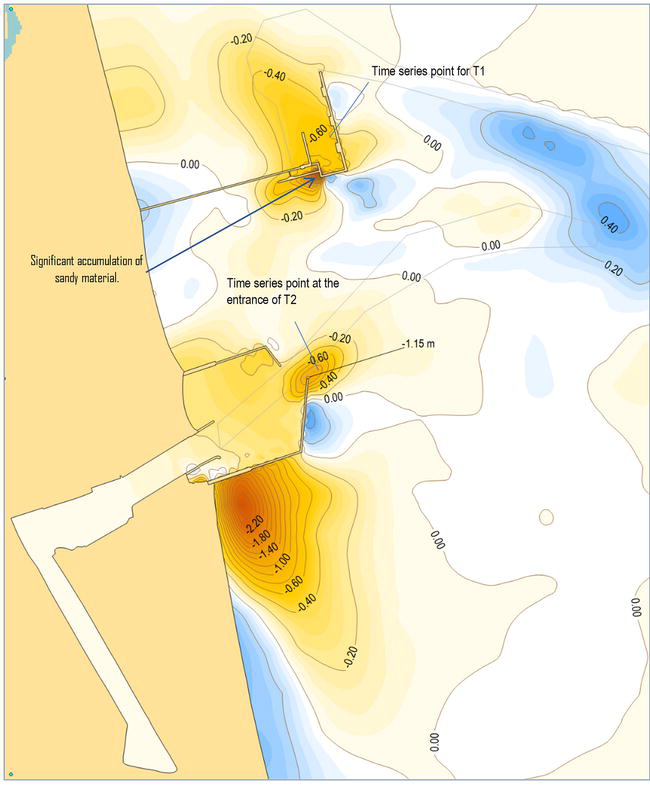
Figure 28.
Zoom in on the region of T1 above and T2 below, with detailed siltation and erosion isolines, including change values, according to the color scale of the general map in
The analysis in Figure 29 reveals a direct correlation between the peak concentration of Total Suspended Sediments (TSS) and the increase in the siltation rate in the T1 and T2 areas. This indicates that TSS has a significant contribution to the silting process compared to sand, suggesting the need to monitor and manage these sediments to maintain the navigability and operational efficiency of the port.
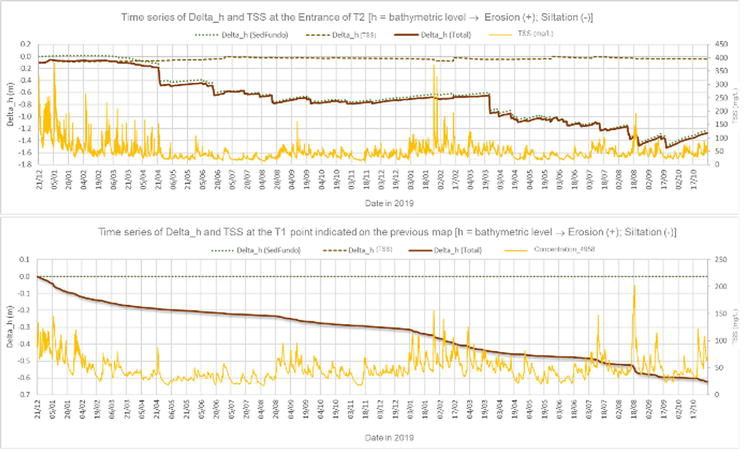
Figure 29.
Time series of bathymetry variation, Delta h (m), and TSS concentration (mg/L), at the entrance of the jetties of T2 and in the internal area of T1, according to the points indicated in the zoom maps of
4. Discussion
The analysis reveals a direct connection between water and sediment dynamics and port infrastructure management, showing how extreme events impact navigability and safety. The use of integrated models, such as SWAT and SisBaHiA, is essential to predict and minimize environmental impacts, corroborating the idea of their importance in the sustainable management of water resources and coastal zones.
The Port of Açu assesses climate-related risks and their impacts on operations, focusing on sea level changes, winds, waves, and precipitation. Forecasts indicate that climate change will have modest impacts on the port environment by the end of the century, but uncertainties grow for longer periods, emphasizing the need for continuous monitoring and updates [43].
The evaluation of the data between January 2021 and October 2022 identified significant temporal patterns in sediment movement and in the behavior of water flows in the Port of Açu, correlated with rainfall episodes. A clear link was observed between heavy rains and increased siltation and erosion, pointing to the vulnerability of port operations to such conditions. In addition, the hydrological response to precipitation was complex, with a time lag between heavy rainfall and the highest flows, evidencing the complexity of the processes within the watershed. These results agree with the literature on the importance of an integrated modeling approach in water management and climate change response, also suggesting the need for specific approaches to sediment management and climate adaptation in ports.
The influence of heavy rains and flow variations in rivers has a direct impact on port infrastructure due to siltation, highlighting dredging as an essential practice to preserve the depth of navigation channels and, consequently, the ability to receive ships of great draft. Effective sediment management, including regular dredging, is critical to maintaining port operations, taking into account the environmental effects of these activities [44].
The results reinforce the need for holistic mitigation approaches, integrating monitoring, modeling, and environmental management practices, offering valuable contributions to the literature for the development of public policies and adaptive management strategies. Sustainability in sediment management demands a synergy between the maintenance of navigation channels and the conservation of marine ecosystems, encouraging the reuse of sediments in ecological restoration and construction. The continued use of monitoring and predictive technologies reduces the need for dredging, decreasing the environmental impact [45].
Adaptation to climate change is essential for long-term port management, given the expected increase in extreme precipitation events. Implementing resilient strategies, improving hydrological forecasting and monitoring, and strengthening port infrastructures are vital to ensuring sustainable operations by mitigating adverse effects on port activities and nearby ecosystems [46, 47, 48].
The integration of hydrological and sedimentological modeling and meteorological data analysis are critical for informed decision-making, anticipating extreme events and their effects on port operations. This approach facilitates risk management by promoting port expansion in a sustainable and resilient manner [49, 50].
The practical implications of these results are important for stakeholders in the port industry and water resource management, underscoring the importance of proactive approaches to address siltation and water change, including:
Modernization of port infrastructure to resist extreme events and mitigate siltation.
Implementation of advanced monitoring and modeling systems.
Formulation of public policies focused on sustainability and climate adaptation.
Promotion of cross-sectoral collaboration for the development of integrated environmental strategies.
These recommendations are aimed at optimizing port operations, minimizing risks, and promoting sustainability.
5. Conclusions
The study achieved its objectives by illustrating the effectiveness of integrated modeling in the studies of hydrological and sedimentological processes, showing how this methodology can improve the accuracy of predictions and inform adaptive management strategies. The incorporation of advanced modeling techniques, which take into account variables ranging from meteorological to aspects of the physical geography of the region to oceanographic aspects, represents an advance, filling an important gap in the literature. This innovative approach provides an in-depth understanding of the impacts of heavy rainfall events on port areas and introduces methods that improve the prediction and mitigation of risks related to sediment and water dynamics, contributing significantly to the area of hydrology and water resource management.
The research identified a significant connection between extreme precipitation events and changes in sediment dynamics and water flows, with a particular focus on the Port of Açu. It was observed that heavy rains resulted in increased silting and modifications in water flows, compromising the efficiency of port operations. The application of integrated models, such as SWAT and SisBaHiA, has emerged as essential to analyzing and managing these effects. The results of this study enrich the field of integrated modeling of hydrological and sedimentological phenomena, underlining the need for comprehensive strategies to anticipate and reduce the impacts of rainfall events in port areas.
The results of the research are in line with the chosen theoretical framework, highlighting the relevance of integrated modeling for the understanding of hydrological and sedimentological systems. This study not only confirms the significant influence of extreme precipitation events on port areas, as theoretically predicted, but also extends existing knowledge by detailing the specific impacts and assessing the effectiveness of diverse mitigation strategies. Thus, the findings enrich the theoretical framework, illuminating the complexity of the phenomena studied and underlining the importance of integrated management strategies.
Limitations of the study may include the scale of data used, the representativeness of the modeled climatic conditions, and the applicability of the models in different geographic contexts. These limitations may influence the generalization of the results and the accuracy of the forecasts in different port areas. To overcome such limitations, future research could expand the database, include a wider range of climate scenarios, and test the applicability of the models in different environments. Acknowledging these limitations is important for the validity and continuous improvement of research in the field.
It is recommended for future investigations to explore models based on artificial intelligence (AI) and machine learning (ML) in the prediction of extreme precipitation events and in the analysis of their effects on sediment dynamics and water flows. Analysis of the interaction between global climate change and local water resource management strategies can reveal efficient adaptation approaches. In addition, the incorporation of interdisciplinary studies that combine socioeconomic factors with hydrological and sedimentological modeling could deepen the understanding of the challenges faced by port areas, contributing to the development of sustainable and integrated solutions.
Practical recommendations based on the results of the study include strategies for port resilience and sustainability, such as:
Advanced modeling integration: adopt predictive modeling that encompasses meteorological, hydrological, and oceanographic variables to anticipate and mitigate climate impacts.
Adaptive infrastructure development: build infrastructure that is aligned with the latest climate forecasts to ensure efficient and safe port operations.
Enhanced monitoring: increase the resolution of environmental monitoring to collect detailed data that support predictive modeling.
Future research: investigate the complex interaction among climatic and human factors and hydrosedimentological dynamics.
Implementing innovative policies: create public policies that reflect the latest scientific insights for effective sediment management and environmental conservation.
Adaptive management: adopt a proactive approach to port and environmental management, based on risk assessments and integrated modeling.
Among the challenges faced during the study, large-scale data collection and analysis and the modeling of complex systems are highlighted. However, the application of innovative methodologies, which incorporated the integration of multidisciplinary data, the use of advanced modeling technologies, and interdisciplinary collaboration, proved to be successful. The insights gained highlight the importance of methodological flexibility, adaptability to emerging findings, and the relevance of effectively communicating results to relevant stakeholders. These lessons are critical to enhance future research and practice in the field.
The research emphasizes the role of integrated modeling of hydrological and sedimentological processes in overcoming the challenges associated with extreme precipitation events in port areas. Advances in predictive modeling have been shown to offer significant contributions to water resource management and port infrastructure, providing valuable data for climate adaptation policymaking. This study represents a breakthrough in hydrological knowledge, encouraging the development of innovative solutions to address current and emerging challenges, and highlights the need for holistic and collaborative approaches in research and practical application.
Acknowledgments
We would like to express our gratitude to all those who have contributed in several ways to the realization of this work, whose support has been indispensable for the development of this book chapter. A special thanks is directed to the project participants and to the SisBaHiA Laboratory, as well as to the Coastal and Oceanographic Engineering Program of the Federal University of Rio de Janeiro, whose expertise and dedication significantly enriched this study. We extend our thanks to the managers of the Port of Açu, whose funding not only made this research possible, but also demonstrates their commitment to scientific advancement and environmental sustainability. The collaboration of everyone and institution was essential for us to achieve our goals and contribute to port resilience and environmental assessment for decision-making.
References
- 1.
da Costa Sanches Galvão JR et al. Mobilization towards an integrated research network for studying runoff, sediment transport and climate of the Paraiba do Sul Basin. In: Frota MN et al., editors. Proceedings of the 1st International Conference on Water Energy Food and Sustainability (ICoWEFS 2021). Cham: Springer; 2021 - 2.
Gorodetskaya Y. Modelos hidrológicos híbridos para a bacia do rio Paraíba do Sul: acoplando redes neurais artificiais com transformada wavelet para previsão de vazão em curto prazo com ênfase na previsão de vazões extremas. Tese. s.l.: Universidade Federal de Juiz de Fora (UFJF); 2022 - 3.
Dunn RJK et al. Hydrodynamic and sediment modelling within a macro Tidal Estuary: Port Curtis Estuary, Australia. Journal of Marine Science and Engineering. 2015; 3 :720-744 - 4.
Guarnieri A et al. Effects of marine traffic on sediment erosion and accumulation in ports: A new model-based methodology. Ocean Science. 2021; 17 :411-430 - 5.
Izaguirre C et al. Climate change risk to global port operations. Nature Climate Change. 2021; 11 :14-20 - 6.
Mutombo K e ÖA. Towards port infrastructure adaptation: A global port climate risk analysis. WMU Journal of Maritime Affairs. 2017; 16 :161-173 - 7.
Janjić J, e Tadić, Lidija. Fields of application of SWAT hydrological model – A review. Earth. 2023; 4 (2):331-344 - 8.
Manisha KC et al. Application of SWAT hydrological model to simulate flow of Seti-Gandaki Basin. Jalawaayu. 2023; 3 (1):43-62 - 9.
Marmontel CVF et al. Aplicabilidade do Modelo Hidrológico SWAT Na Bacia Hidrográfica do Rio Paraibuna, SP - Brasil. IRRIGA. 2019; 24 :594-609 - 10.
Liping C, Yujun S e S. Monitoring and predicting land use and land cover changes using remote sensing and GIS techniques – A case study of a hilly area, Jiangle, China. PLoS ONE. 2018; 13 (7):1-23 - 11.
Darbra R, Maria R, Journée H, Wooldridge C. Environmental management tools for ports. 2011 - 12.
Pereira SP. Modelagem da Qualidade Bacteriológica das Águas Costeiras de Fortaleza (Nordeste do Brasil) [Tese, D.Sc]. 2012 - 13.
Ishikawa AK et al. Projeto Baías do Brasil - Porto do Açu, RJ. 2019 - 14.
Guannel G et al. The power of three: Coral Reefs, Seagrasses and Mangroves Protect Coastal regions and increase their resilience. PloS One. 2016; 11 (7):1-22 - 15.
Capozzoli C, Cardoso AO. Effects of land use change on discharge of the Paraíba do Sul river. Ciência e Natura. 2021; 42 (53):1-13 - 16.
Mukherjee A et al. Comparison of soil quality index using three methods. PLoS ONE. 2014; 9 (8):1-15 - 17.
Ribeiro AS et al. Reporting climate change impacts on Coastal Ports (NW Iberian Peninsula): A review of flooding extent. Journal of Marine Science and Engineering. 2023; 11 (3):477 - 18.
Shin ET et al. Integrated inundation modeling of flooded water in Coastal Cities. Applied Sciences. 2019; 9 (7):1313 - 19.
Maurya SP, Singh AKY. Agent-Based Modeling for Integrated Urban Water Management. Modeling and Simulation of Environmental Systems: A Computation Approach. 1st ed. CRC Press (Boca Raton); 2022 - 20.
SisBaHiA. Sistema Base de Hidrodinâmica Ambiental. SisBaHiA, COPPE|UFRJ [Online]. 2024. Available from: https://www.sisbahia.coppe.ufrj.br/ - 21.
SWAT. SWAT. Soil & Water Assessment Tool. [Online] 2024. Available from: https://swat.tamu.edu/ - 22.
Neitsch SL et al. Soil and Water Assessment Tool Theoretical Documentation Version 2009. College Station, Texas: Grassland, Soil and Water Research Laboratory, Agricultural Research Service and Blackland Research Center, Texas Agricultural Experiment Station; 2011 - 23.
NASA/METI/AIST/Japan Spacesystems and U.S./Japan ASTER Science Team. ASTER Global Digital Elevation Model V003 [Data set]. 2019. NASA EOSDIS Land Processes Distributed Active Archive Center - 24.
INDE. Infraestrutura Nacional de Dados Espaciais. Portal brasileiro de dados geoespaciais – SIG Brasil. [Online] 2022. Available from: https://visualizador.inde.gov.br/ - 25.
Embrapa Solos. Correlação com WRB/FAO e Soil Taxonomy. Sistema Brasileiro de Classificação de Solos (SiBCS). [Online] 2022. Available from: https://www.embrapa.br/solos/sibcs/correlacao-com-wrb-fao-e-soil-taxonomy - 26.
POWER Data Access Viewer. NASA POWER. NASA Prediction of Worldwide Energy Resources. [Online] 2022. Available from: https://power.larc.nasa.gov/data-access-viewer/ - 27.
NASA. POWER Data Methodology. NASA POWER | Docs. [Online] 2022. Available from: https://power.larc.nasa.gov/docs/methodology/ - 28.
NASA POWER. POWER Docs. NASA POWER | Docs. [Online] 2022. Available from: https://power.larc.nasa.gov/docs/ - 29.
Rosman PCC. Referência técnica do SisBaHiA. Rio de Janeiro: Laboratório SisBaHiA, Programa de Engenharia Oceânica da COPPE, Universidade Federal do Rio de Janeiro; 2024 - 30.
Figueiredo AG et al. Geomorfologia e sedimentologia da plataforma continental. In: Kowsmann RO, editor. Geologia e Geomorfologia. Vol. 1. 2015. pp. 13-32 - 31.
AVISO+. FES2014. FES (Finite Element Solution)- Global tide. [Online] 2016. Available from: https://www.aviso.altimetry.fr/en/data/products/auxiliary-products/global-tide-fes/description-fes2014.html - 32.
HYCOM. HYbrid Coordinate Ocean Model (HYCOM). Center for Ocean-Atmospheric Prediction Studies (COAPS). [Online] 2022. Available from: https://www.hycom.org/ - 33.
Hersbach H et al. ERA5 hourly data on single levels from 1940 to present. Copernicus Climate Change Service (C3S) Climate Data Store (CDS). 2023 - 34.
Refsgaard JC. Parameterisation, calibration and validation of distributed hydrological models. Journal of Hydrology. 1997; 198 (1–4):69-97 - 35.
McMillan HK, Booker DJ, e Cattoën, C. Validation of a national hydrological model. Journal of Hydrology. Part B. 2016; 541 :800-815 - 36.
SWAT. SWAT-CUP. Soil & Water Assessment Tool. [Online] 2024. Available from: https://swat.tamu.edu/software/swat-cup/ - 37.
Abbaspour KC. SWAT-CUP, SWATCalibration and Uncertainty Programs. 2015 - 38.
Hora MAGM. Diagnóstico preliminar das condições hidrossedimentológicas do rio Paraíba do Sul e seus principais afluentes. Água em Revista. 1998; 10 :27-35 - 39.
Moriasi DN et al. Model evaluation guidelines for systematic quantification of accuracy in watershed simulations. American Society of Agricultural and Biological Engineers. 2007, 900; 50 (3):885 - 40.
Porto do Açu Operações. Dados dos níveis de maré de 21/12/2020 a 31/10/2022. Estação T1 – Ponte de Acesso. 2022 - 41.
INMET. Eventos extremos de fevereiro de 2022 no Brasil. Brasília, DF: IMMET; 2022 - 42.
INMET. Alerta conjunto chuvas intensas região Sudeste. Brasília, DF: IMMET; 2021 - 43.
Porto do Açu Operações S.A. Porto do Açu: Avaliação dos riscos climáticos – Resumo Executivo. Rio de Janeiro: Porto do Açu; 2022 - 44.
Delanoy RA, Díaz-Asencio M, Méndez-Tejeda R. Effect of extreme weather events on the sedimentation of the Bay of Samaná, Dominican Republic (1900–2016). Journal of Geography and Geology. 2019; 11 (3):56-73 - 45.
Pellegrini M et al. Sustainable sediment management in coastal infrastructures through an innovative technology: Preliminary results of the MARINAPLAN PLUS LIFE project. Journal of Soils and Sediments. 2020; 20 :2685-2696 - 46.
Loza P, Veloso-Gomes F. Literature review on incorporating climate change adaptation measures in the design of New Ports and Other Maritime Projects. Sustainability. 2023; 15 (5):4569 - 47.
Devendran L et al. Adapting to the impacts of climate change on port operation. Australian Journal of Maritime & Ocean Affairs. 2023; 15 (2):107-126 - 48.
Zheng S et al. Seaport adaptation to climate change disasters: Subsidy policy vs. adaptation sharing under minimum requirement. Transportation Research Part E: Logistics and Transportation Review. 2021; 155 :102488 - 49.
Omran ES, Dandrawy ME. Integrated hydrological modeling and geoinformatics for harvesting and simulating Mountain Torrents on the Area Stretching Between Port Sudan and Ras Bennas, Red Sea. In: Omran ES, Negm AM, editors. Egypt’s Strategy to Meet the Sustainable Development Goals and Agenda 2030: Researchers’ Contributions. Cham: Springer; 2022 - 50.
Merico E, Dinoi A, Contini D. Development of an integrated modelling-measurement system for near-real-time estimates of harbour activity impact to atmospheric pollution in coastal cities. Transportation Research Part D: Transport and Environment. 2019; 73 :108-119