Open Access is an initiative that aims to make scientific research freely available to all. To date our community has made over 100 million downloads. It’s based on principles of collaboration, unobstructed discovery, and, most importantly, scientific progression. As PhD students, we found it difficult to access the research we needed, so we decided to create a new Open Access publisher that levels the playing field for scientists across the world. How? By making research easy to access, and puts the academic needs of the researchers before the business interests of publishers.
We are a community of more than 103,000 authors and editors from 3,291 institutions spanning 160 countries, including Nobel Prize winners and some of the world’s most-cited researchers. Publishing on IntechOpen allows authors to earn citations and find new collaborators, meaning more people see your work not only from your own field of study, but from other related fields too.
This chapter presents experimental and industrial experience with the use of steel slag and air-cooled blast furnace slag in the production of concrete as a new sustainable and environmentally friendly building material. Steel slag and air-cooled blast furnace slag replace 100% of the natural aggregate fractions 0/32 mm. The strength characteristics of the sustainable concrete placed in laboratory and outdoor environments and its pictorial analysis are presented.
Faculty of Mining and Geology, Department of Environmental Engineering, VSB-Technical University of Ostrava, Czech Republic
*Address all correspondence to: vojtech.vaclavik@vsb.cz
1. Introduction
Most of the production and non-production activities of today’s society are accompanied by the generation of by-products and waste. The issue of their disposal or rational use is, therefore, a primary task today in terms of environmental protection and circular economy.
The various industries are looking for ways of producing with little or no by-products and waste. Where this cannot be achieved, the use of by-products and waste in other production sectors is being addressed.
Recycling and use of by-products and waste enables savings to be made in primary raw materials and energy resources, delays the depletion of natural resources and contributes to the protection of the environment, which is threatened by the accumulation of waste, its dust, water contamination and land occupation.
In the construction industry, the use of by-products and waste from the metallurgical industry, the energy and mining industries, waste produced by building materials plants and some waste from other production and collection facilities is also an option. To date, some by-products of metallurgical production, energy by-products and some components of construction and demolition waste have been processed to the greatest extent in this sector.
The production of iron and steel is always accompanied by the generation of by-products which are either returnable, reusable materials for the whole production process or material that is unusable in further production and is wasted. Reducing this wasted, non-returnable material to minimum values is currently an urgent challenge, given the price of raw materials, the promotion of a circular economy and the sustainable development of society.
Even though by-product producers (steel slag and blast furnace slag) try to minimize the amount that is landfilled and process it as much as possible into secondary raw materials, a significant proportion is still landfilled.
Sustainable steel slag-based building materials are now known. Steel slag from electric arc furnaces fr. 0/5, 5/12 and 12/25 mm can be used as a partial substitute for natural aggregate in concrete production [1, 2, 3, 4], similar to mechanically treated steel slag [5]. Modified steel slag is also used as a substitute for natural aggregate in asphaltic concrete [6, 7]. Modified steel slag by mechanical activation can be used as an addition in the production of concrete [8]. The results of a research that investigated the use of recycled steel slag in the production of Portland cement concrete are presented in [9].
Granulated blast furnace slag has a wide range of long-term applications in cement production. A prospective regional application of finely ground blast furnace slag is alkali-activated concrete [10, 11, 12]. Finely ground granulated blast furnace slag in combination with fly ash can be used as an addition in the production of concrete [13]. Finely ground granulated blast furnace slag can be combined with recycled concrete to produce concretes with defined properties [13]. Research results are also known which address the substitution of natural coarse aggregate in quantities of 25, 50 and 100% granulated blast furnace slag and electric arc furnace slag (EAFS) in concrete production [14].
Concrete prepared with steel and air-cooled blast furnace slag is one of the sustainable construction materials. Sustainable building materials include materials prepared based on by-products and/or wastes from industrial production. These are building materials that have the same or better mechanical and transformation properties than building materials based on natural raw materials. The purpose of using sustainable building materials is to conserve natural resources and reduce the carbon footprint.
In this chapter, we present our results and experience with steel and air-cooled blast furnace slag-based concrete. These by-products from a metallurgical plant were used as a 100% substitute for natural aggregates in concrete production [15, 16].
Steel slag is formed as a by-product in the treatment of pig iron in primary and secondary metallurgy [17]. Slag produced in different steel plants has different properties. The main chemical components include CaO, SiO2, Fe2O3, MgO, Al2O3, MnO, P2O5. The chemical composition of steel slag varies according to the type of furnace, the quality of steel and the method of preparation. Table 1 presents the chemical composition of steel slag from BOFS (Basic Oxygen Furnace Slag) and EAFS (Electric Arc Furnace Slag). The mineralogical composition of steel slag is variable. The proportion of crystalline phase and glass depends on the crystallization rate of the slag. The following minerals are present in steel slags: dicalcium silicate C2S, tricalcium silicate C3S, dicalcium ferrite C2F, tetracalcium aluminoferrite C4AF, acermanite, gehlenite, periclase MgO and free CaO [18, 19].
Converter steel slag of fr. 0/8 mm was used for our experimental design. The chemical composition of steel slag is presented in Table 2.
Analyte
Unit
Result
Uncertainty
Analyte
Unit
Result
Uncertainty
Na2O
weight %
0.46
±0.10
V
mg/kg
570
—
MgO
weight %
10.2
±1.2
Cr
mg/kg
3.900
—
Al2O3
weight %
2.43
±0.27
Ni
mg/kg
25
—
SiO2
weight %
13.7
±1.3
Cu
mg/kg
38
—
P2O5
weight %
0.91
±0.09
Zn
mg/kg
63
—
SO3
weight %
0.50
±0.06
Sr
mg/kg
130
—
K2O
weight %
<0.003
Zr
mg/kg
140
—
CaO
weight %
38
± 2
Nb
mg/kg
67
—
TiO2
weight %
0.29
± 0.02
Mo
mg/kg
36
—
MnO
weight %
3.02
± 0.13
Ba
mg/kg
200
—
Fe total
weight %
22
Ta
mg/kg
110
—
CaO free
weight %
2.34
± 0.24
W
mg/kg
86
—
—
—
—
—
Loss by annealing
weight %
−0.74
—
Table 2.
Chemical composition of converter steel slag (CSS) fr. 0/8 mm [16].
Air-cooled blast furnace slag (ACBFS) is one of the basic types of artificial aggregates. It is formed as a waste product in the production of iron. It is similar to natural igneous rocks. It is included in European technical standards together with natural resources aggregates and is subject to the same normative requirements. Coarse artificial aggregate of fr. 8/16 and 16/32 mm was used for our experimental research. The chemical composition is given in Table 3.
Table 4 presents the average values of properties of converter steel slag (CSS) of fr. 0/4 mm and fr. 4/8 mm and air-cooled blast furnace slag (ACBFS) of fr. 8/16 mm and fr. 16/32 mm. Specific weight and absorption were determined according to EN 1097-6 [20], specific weight in tapped state and the void content were determined according to EN 1097-3 [21].
Artificial aggregate
CSS fr. 0/4 mm
CSS fr. 4/8 mm
ACBFS fr. 8/16 mm
ACBFS fr. 16/32 mm
Specific weight (kg/m3)
3.294
3.421
2.636
2.640
Loose bulk density—unshaken state (kg/m3)
2.047
1.700
1.479
1.529
Loose bulk density—shaken state (kg/m3)
2.380
1.970
1.667
1.767
Voids—unshaken state (%)
37.9
50.3
43.9
42.1
Voids—shaken state (%)
27.7
42.4
36.8
33.1
Water absorption (%)
2.36
2.41
1.36
0.86
Table 4.
Properties of converter steel slag (CSS) and air-cooled blast furnace slag (ACBFS) [16].
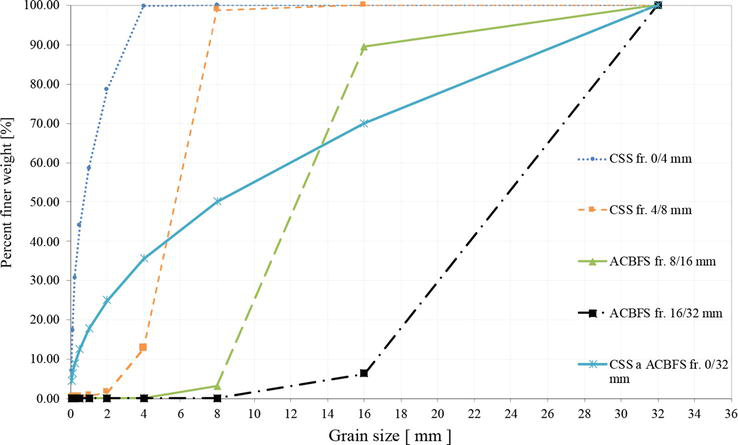
All these fractions of converter steel slag (CSS) and air-cooled blast furnace slag (ACBFS) shown in Table 4 were subjected to a granulometric analysis according to EN 933-1 [22]. Based on the performed tests and with the help of C-Packing software, the optimal grain size curve of the combination of CSS and ACBFS fr. 0/32 mm was developed, which consists of CSS fr. 0/4 mm (32.0%), CSS fr. 4/8 mm (18.0%), ACBFS fr. 8/16 mm (20.0%) and ACBFS fr. 16/32 (30.0%). It follows from the above that the ratio of the filler CSS and ACBFS is 50:50%. Based on the results of the granulometric analysis (see Figure 1), the mean grain size was determined as d50 from individual grain size curves (see Table 5).
Two types of cement have been used as a binder for the production of steel & air-cooled blast furnace slag-based concrete. These were Portland blended cement CEM II/B-S 42.5N and hybrid cement marked as H-CEMENT. Both types of cements are produced in the company Považská cementáreň, a.s. Table 6 presents the chemical composition of the cements used and Table 7 presents their physical and mechanical properties.
Physical and mechanical properties of cements [16].
A superplasticizer based on modified polycarboxylates Sika ViscoCrete-4035 was used as an admixture for the production of a concrete mixture based on artificial aggregates.
Water from the tap water system was used as mixing water.
2.3 Concrete mix designs
In order to verify the possibility of using converter steel slag (CSS) and air-cooled blast furnace slag (ACBFS) from blast furnace slag as a 100% substitute for natural aggregates of fr. 0/32 mm, three concrete mix designs were developed marked as [16]:
C—mix based on converter steel slag (CSS), which is represented by fr. 0/4 mm (32%) and fr. 4/8 mm (18%) and air-cooled blast furnace slag (ACBSF) fr. 8/16 mm (20%) and air-cooled blast furnace slag fr. 16/32 mm (30%). CEM II/B-S 42.5 N (360 kg/m3), water (181 kg/m3) and superplasticizer in the amount of 1% of the weight of cement.
CH—mix based on converter steel slag (CSS), which is represented by fr. 0/4 mm (32%) and fr. 4/8 mm (18%) and air-cooled blast furnace slag (ACBFS) fr. 8/16 mm (20%) and fr. 16/32 mm (30%). CEM II/B-S 42.5 N (360 kg/m3) is used as a binder, which is replaced in 30% by the PUZZOLANIT (H-CEMENT 108 kg/m3) addition, water (181 kg/m3) and plasticizer in the amount 1.1% of the weight of cement.
H—mix based on converter steel slag (CSS), which is represented by fr. 0/4 mm (32%) and fr. 4/8 mm (18%) and air-cooled blast furnace slag (ACBFS) fr. 8/16 mm (20%) and fr. 16/32 mm (30%). H-CEMENT 360 kg,m3), water (191 kg/m3) and plasticizer in the amount of 1.4% of the weight of cement.
2.4 Production of test specimens
The production of test specimens, according to concrete mix designs (see Chapter 2.3.), took place in two stages (stage I and II). From each design, 4 mixtures with a volume of 20 dm3 were mixed. Within two stages of the production of concrete test specimens, 160 dm3 of concrete mixture, 32 cubes with an edge of 150 mm and 6 prisms with dimensions of 100 × 100 × 400 mm were prepared from each concrete mix design. Thus, a total of 480 dm3 of concrete mixture, 96 cubes and 18 prisms were produced. A forced mixer (cyclone mixer) M80 from FILAMOS, s.r.o. CZ was used for the production of the concrete mixture.
2.5 Placement of test specimens
Test specimens from stage I of the production were placed in a container in an aqueous environment with temperature control, where heating was provided by a heating cable. The water temperature in the test tank with the test specimens was 20°C ± 2.0°C during the whole process. The specimens were placed in the tank for 7, 28 and 90 days in accordance with EN 12390-2 [23]. Test specimens made in stage II were placed in an outdoor environment of the company Považská cementáreň, a.s. in August, September and October 2017. Temperature characteristics and precipitation totals for these months are given in [16].
Two methods of placing the test specimens were chosen in order to determine whether the environment in which the test specimens are placed affects the resulting properties of steel & air-cooled blast furnace slag-based concrete.
The third method of placement of test specimens (dimensions 40x40x160 mm, which were cut out from a cube with an edge of 150 mm) was chosen in sewage wastewater (in a septic tank) in the company Považská cementáreň, a.s. [16].
2.6 Methodology of concrete properties tests
The properties of the fresh concrete mixture were determined in accordance with applicable normative regulations. Determination of the specific weight of a fresh concrete mixture was performed according to EN 12350-6 [24], determination of the consistency of a fresh concrete mixture according to EN 12350-5 [25] and determination of the air content in a fresh concrete mixture according to EN 12350-7 [26]. Determination of strength characteristics of hardened concrete was performed according to EN 12390-3 [23] and the dynamic modulus of elasticity according to CSN 731371 [27]. A Non-Destructive 3D X-Ray Computed Tomography method was used to visualize the structure and basic porosity analysis of steel & air-cooled blast furnace slag-based concrete. The analyzed specimens were scanned on a Nikon Metrology XT H 450 2D/3T X-Ray Computed Tomography.
To determine the optimal amount of PUZZOLANIT (H-CEMENT) in combination with Portland blended cement CEM II/B-S 42.5N, tests of the rheological properties of the cements used were performed. The rheological properties were determined on a Viskomat NT Schleibinger. The result of the measurement is the measured torque (Nmm) over time. The comparative cement was Portland blended cement CEM II/B-S 42.5N. It was found that with a 20 and 40% replacement of CEM II/B-S 42.5N by H-CEMENT, the workability was the least affected [16]. Based on the obtained results of rheology of cements used for the production of the concrete mixture based on CSS and ACBFS, a 30% replacement of CEM II/B-S 42.5N by H-CEMENT was chosen, where H-CEMENT was used as a mineral addition II of the kind marked PUZZOLANIT. Determination of the rheology of the used cement was done according to the methodology of Považská cementáreň, a.s.
3.2 Properties of a fresh concrete mixture
Determination of the properties of the fresh concrete mixture (consistency, air content and specific weight) was performed in stages I and II of the production of test specimens. Within one stage, 4 mixtures were always made, within two stages, 8 mixtures were made, i.e. the average value of the properties of the fresh concrete mixture was calculated from 8 values. The results are presented in Table 7.
The pouring values of the fresh concrete mixture correspond to a consistency F2 of 350–410 mm for mix C and CH and a consistency F1 ≤ 340 mm for mix H. From the above, it is clear that when using H-CEMENT as a binder in the production of concrete based on CSS and ACBFS, it is necessary to take into account the reduction of the workability value of the fresh concrete mixture if H-CEMENT dosing is in the same amount as CEM II/B-S 42.5N. When using H-CEMENT as an addition (PUZZOLANIT) in the amount of 30% in concrete, the consistency of the fresh concrete mixture will not be significantly affected.
Replacement of CEM II/B-S 42.5N cement with H-CEMENT as an addition (PUZZOLANIT) at 30% and 100% has no effect on the air content of fresh concrete mix with CSS and ACBFS. The change of the binder does not affect the air content in the fresh concrete mixture.
The values of the specific weight of the fresh concrete mixture demonstrate the suitability of using CSS and ACBFS as a 100% substitute for natural aggregates and various types of binder, without the specific weight of the fresh concrete mixture being significantly affected by the repeatability of the concrete mixture production.
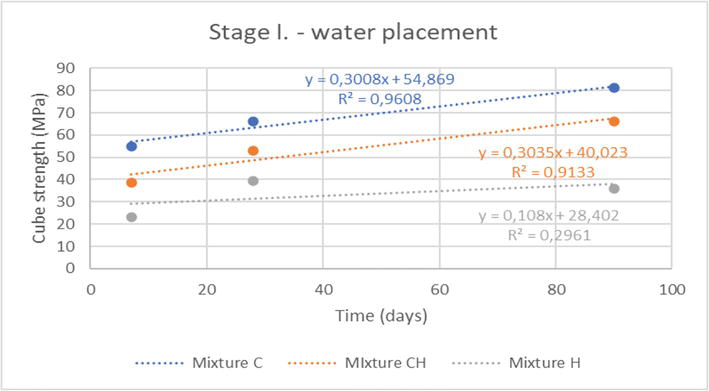
Figure 2 shows the results of cube strengths after 7, 28 and 90 days of age of test specimens from the first stage of production of the test specimens, which were placed in a water environment.
Figure 2.
Cube strength of concrete according to experimental mixes—placement in water [16].
From the above picture, it can be seen that the placement in water suits the test specimens that were prepared using CEM II/B-S 42.5N (mix C) and CEM II/B-S 42.5N in combination with H-CEMENT (mix CH). These test specimens show a gradual increase in cube strength after 7, 28 and 90 days of age of the test specimens. This is also confirmed by the value of the coefficient of determination, which is R = 0.98 (mix C) and R = 0.96 (mix CH). A very low and gradual increase in the strength of concrete of test specimens placed in a water environment was demonstrated for formula H, the coefficient of determination R = 0.55.
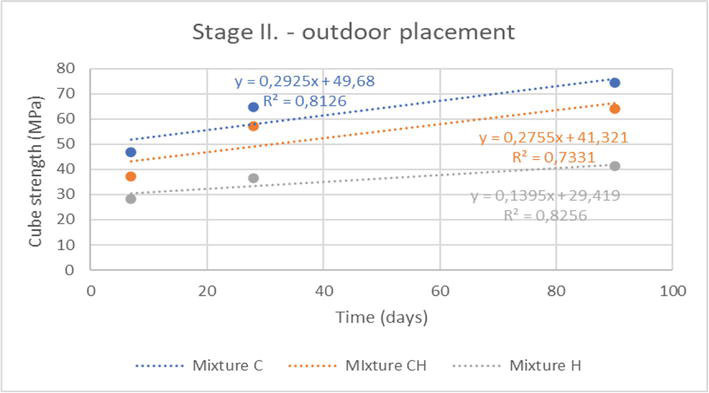
Figure 3 shows the results of cube strengths after 7, 28 and 90 days of age of test specimens from the second stage of production of test specimens, which were placed outdoors. An increase in cube strengths is evident in all test specimens prepared according to experimental mixes. However, when comparing the coefficient of determination of the experimental mixes, where the test specimens were placed in aqueous and outdoor environments, it is clear that the outdoor environment for placing test specimens caused the value of the coefficient of determination to decrease for mix C to R = 0.90, for mix CH to R = 0.86. On the contrary, an increase of the coefficient of determination was found in test specimens made from the H-CEMENT-based mix H to the value R = 0.91.
Figure 3.
Cube strength of concrete according to experimental mixes—outdoor installation [16].
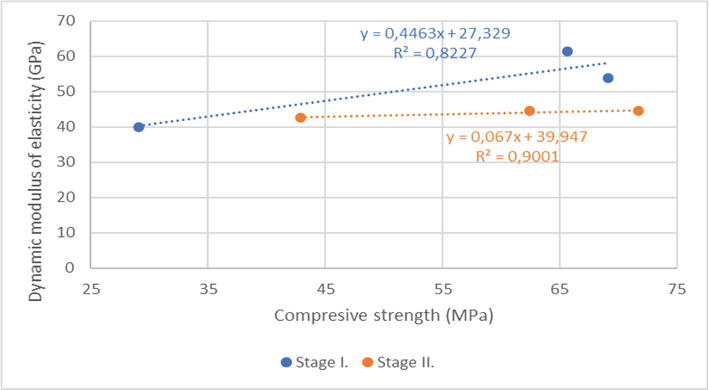
Figure 4 presents the dependence of the dynamic modulus of elasticity on the cube strength. The dynamic modulus of elasticity was determined after 28 days on prisms with the dimensions of 100 × 100 × 400 mm. The research found that the test specimens, which were placed in an aqueous environment, show a dependence where the increase in compressive strength is accompanied by an increase in the value of the dynamic modulus of elasticity with the value of the coefficient of determination R = 0.91. For the test specimens that were placed outdoors, a slight increase in the dynamic modulus of elasticity with the value of the coefficient of determination R = 0.95 is evident.
Figure 4.
Dependence of the dynamic modulus of elasticity on cube strength (water and outdoor placement).
3.4 Structure of concrete
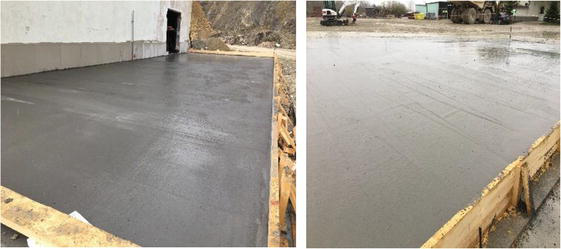
In order to analyze the concrete structure using 3D X-Ray Computed Tomography, test bodies in the shape of a cylinder with a diameter of 43 mm and a height of 100 mm (marked as 1A, 2A, 3A and 2B) were prepared from the semi-operational verification of the production of concrete based on CSS and ACBFS (formulation H) at the concrete plant for the subsequent production of pavement in the industrial area of Považská cementáreň, a.s. (see Figure 5). For the CT analysis itself, only a part of the bodies in the area of the upper base of the cylinder (without specimen description) was scanned in order to achieve the most detailed CT scan of the analyzed object, i.e. the projection of the diameter of the analyzed test body onto the width of the X-ray detector. The scanned and analyzed fragment of the test body was represented by a cylinder with a height of approximately 50 mm.
Figure 5.
View of the CSS and ACBFS concrete pavement.
3.4.1 Visualization of the internal structure of concrete specimens
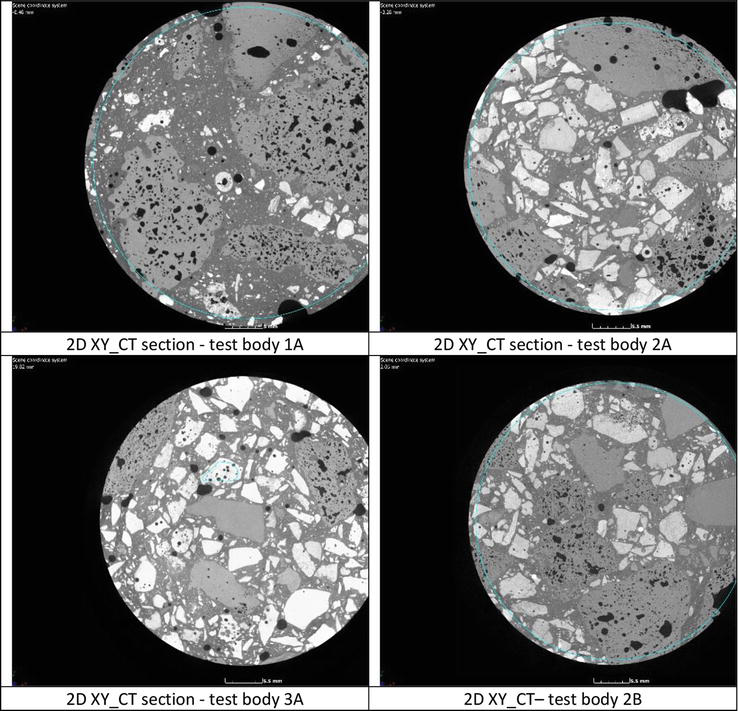
After reconstructing the tomographic (CT) volumes of the individual test bodies in the “3D CT Pro” software, the individual tomographic volumes of the same concrete test body were imported into the “VGStudio MAX” software. In this software, the individual tomographic volumes and 2D CT sections were visualized. The visualization of the internal structure of the concrete was performed using 2D CT sections at 8-bit resolution, representing a range of 256 shades of gray (0—black, 256—white). Darker shades represent low density materials, lighter shades represent denser materials in the analyzed concrete specimens (see Figure 5). The characteristic structure of the analyzed concrete is evident from Figures 6 and 7.
Figure 6.
Example of visualization of the internal structure of the analyzed concrete in the CT section of the XY plane.
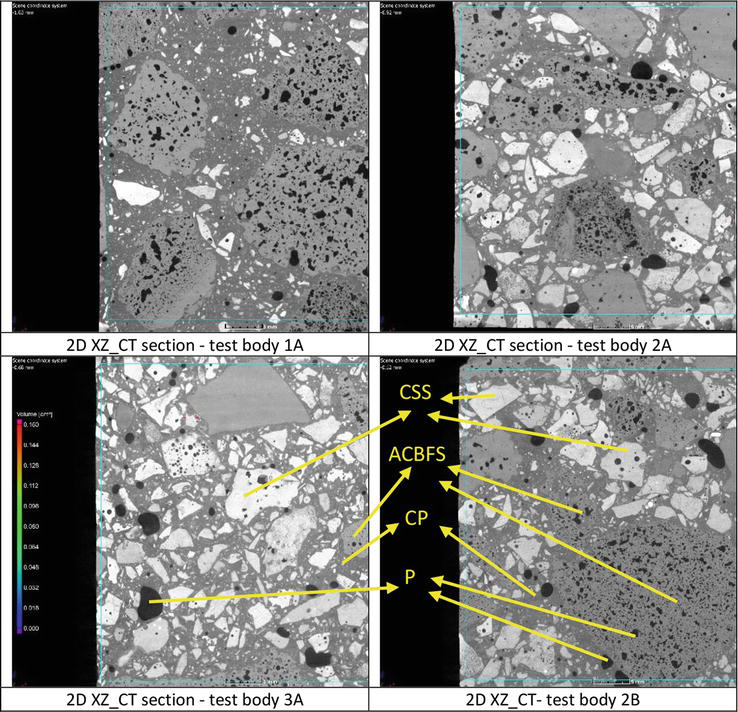
Figure 7.
Example of visualization of the internal structure of the analyzed concrete in the CT section of the XZ plane, with marking of the individual concrete components (CSS: converter steel slag; ACBFS: and air-cooled blast furnace slag, CP: cement paste, and P: pore).
From the reconnaissance of the internal structure of the concrete under review based on the CT sections of each test body, it can be concluded (see Figures 6 and 7) that in the analyzed concrete, its four basic components of concrete can be identified, namely:
Cement paste (CP),
A fraction formed by the sharp-edged grains of steel slag of fr. 0/8 mm (abbreviated to CSS), it is the densest component of concrete, represented by the lightest shades of gray,
A concrete fraction represented mainly by sub-oval grains of air-cooled blast furnace slag (ACBFS) of fr. 8/32 mm, it is the second densest concrete component,
The last component of the concrete consists of pores (P) represented by the darkest shades of gray (black color), identifiable as technologically mixed bubble pores, mostly pseudo-spherical to ellipsoidal in appearance and irregularly shaped pores, which are significantly represented in ACBFS grains, and to a lesser extent in OC grains.
The tomographic CT sections show concrete that does not visibly exhibit contraction-type inhomogeneities and other mechanical cracks in the cement binder at a given resolution level. The grains are well anchored in the cement paste with no visible circumferential separation cracks. Significant inhomogeneities are represented by mixed technological bubbles (pores). A high proportion of pores is also evident in the ACBFS grains. From the tomographic 2D sections, only the primary disturbances in the form of cracks localized in the grains of the different aggregate fractions (CSS and ACBFS) are visible, probably caused by their processing, for instances (see Figures 6 and 7).
3.4.2 An analysis of the pore space in the concrete under review
The porosity analysis was performed using the software “VGStudio Max 3.3.2”. In the first part of the porosity analysis, a region of interest (ROIall) in the shape of a cylinder with a volume of about 55–59 cm3 was selected in each tomographic volume of the test body. The total porosity was measured including the pores located within the grains of each fraction of the concrete under review. In all porosity analyses, the smallest pores analyzed were assumed to have a volume of approx. 0.0001 mm3 (the lower limit of the filter setting of the software module “Defect detection”).
The segmentation of the pore space was performed using a threshold value representing the gray level of individual voxels in the tomographic sections at eight-bit resolution. This threshold for the analysis of the primary pore space was determined manually using the means in the software module “Defect detection/only threshold/voids/define manualy”, i.e. a region was selected from which the average value of voxels representing the pores was determined. An average voxel value was also determined in the adjacent area of the analyzed pore matrix of concrete with aggregate, from which a value was set for the concrete material. Based on these two values, a threshold value was determined for the pore segmentation algorithm in the software module used.
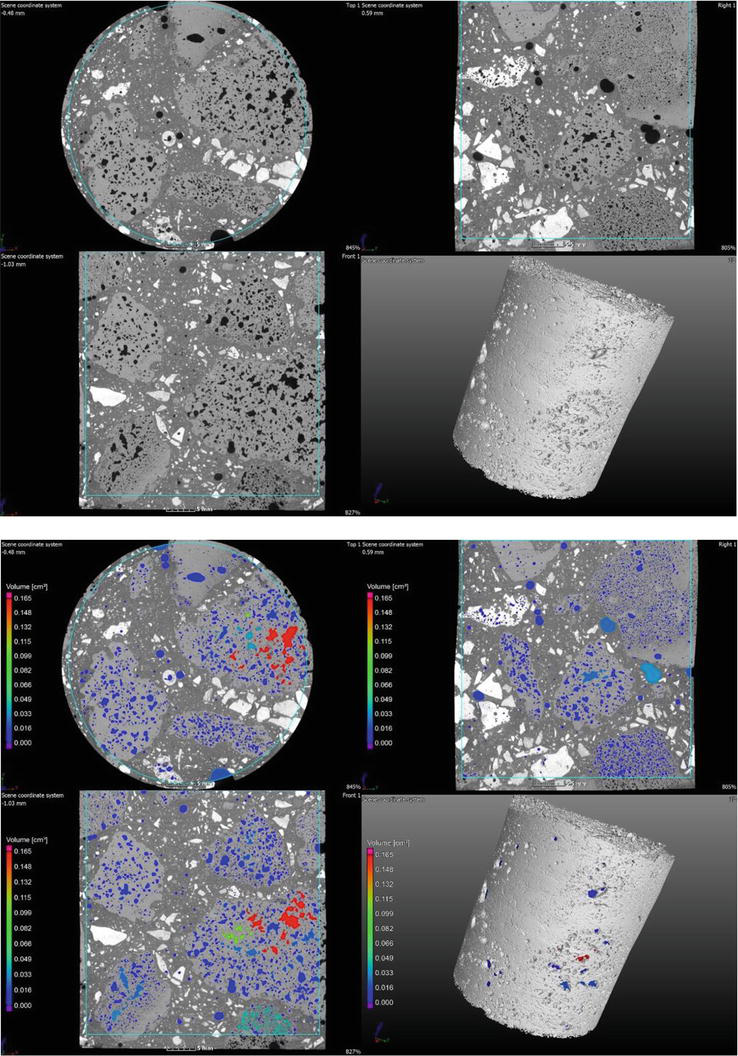
Figure 8 shows an illustrative and typical example of the pore space segmentation result of concrete specimen 1A.
Figure 8.
An illustrative example of pore space segmentation results—Test body 1A, the cylindrical ROI is shown as the light blue line.
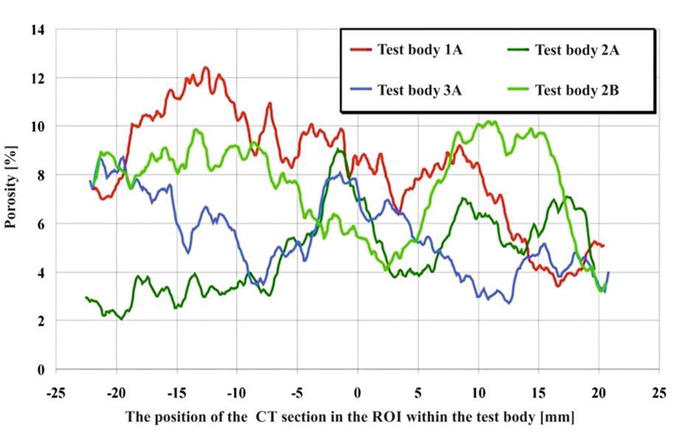
From the analysis performed on the concrete specimens (1A, 2A, 3A and 2B), it is clear that the analyzed concrete exhibits heterogeneity in terms of the distribution and frequency of individual pores in the volume of the test bodies (mainly influenced by the presence of ACBFS grains), as well as in terms of their size. The different pore sizes are particularly evident in the case of the technological mixed bubbles (pores), for example, in concrete specimen 2A and 3A, where the pore size reaches up to about 3–5 mm. These facts can be documented graphically in Figure 9, showing the porosity pattern in the direction of the longitudinal “Z” axis of the cylindrical test bodies evaluated from tomographic volumes with a thickness of 0.1 mm. The graph shows that the porosity values vary in the direction of the longitudinal axis of the test bodies within a range of approximately 2–12% (Note: The 0 mm position represents the centre of the test body region of interest in the direction of the “Z” axis).
Figure 9.
Trend in porosity values in the concrete test bodies along the Z-axis (CT sections in the XY plane with a thickness of 0.1 mm).
The average porosity of the analyzed concrete determined from the results of the measurements on all four test bodies is represented by the value of 6.5 ± 1.52% (coefficient of variability of about 24%). Furthermore, the porosity in the individual fractions of the analyzed concrete was determined using irregular ROIs placed in the individual grains of the CSS and ACBFS fraction. The resulting porosity values show a high variability, which is due to the limited choice of ROI size in the individual grains. The average porosity value from the measurements on all test bodies for the CSS fraction is 5.5 ± 3.38% (coefficient of variability of about 62%), whilst for the ACBFS fraction, the average porosity value is 16 ± 9.53% (coefficient of variability of about 62%).
3.4.3 Determination of the volume and visualization of the individual components of the analyzed concrete in 3D view
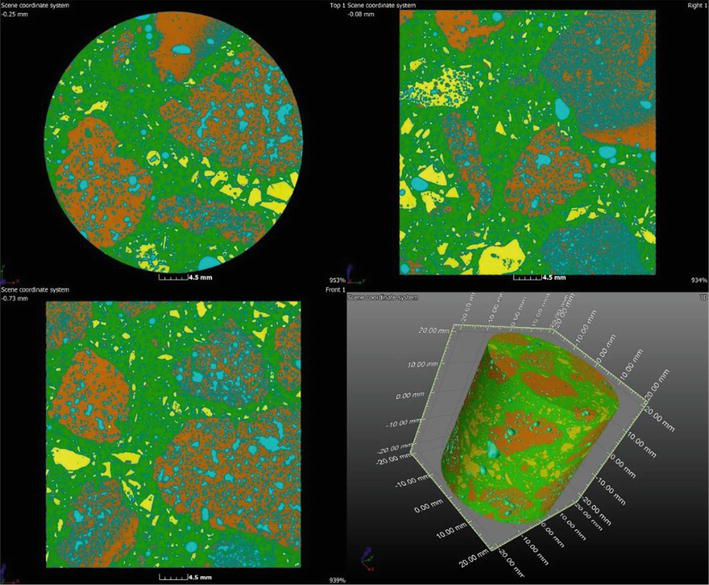
In the analyzed concrete, four basic components can be identified:
Cement paste (CP),
A fraction formed by the sharp-edged grains of steel slag steel (CSS),
A concrete fraction represented mainly by sub-oval grains of artificial dense aggregate (ACBFS),
A component of the concrete consisting of pores (P) represented by the darkest shades of gray (black color).
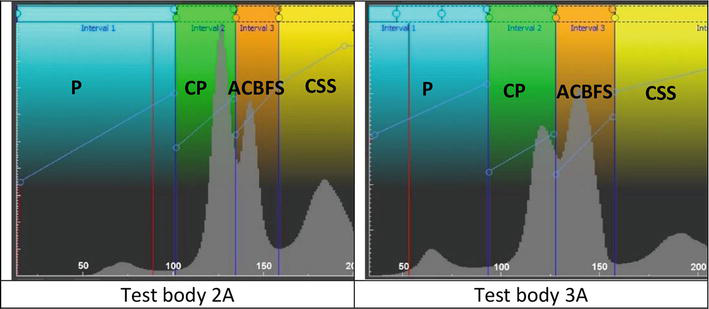
These concrete components also correspond to the distribution of the values of the individual voxels in the tomographic volume, which are also (not only visually) well distinguishable (identifiable) in the histogram of the values of the individual gray shades. The histograms were developed based on the filtered tomographic data. The filtering was performed to eliminate the influence of noise in the tomographic data on the distribution of values in the CT volumes of the test bodies. By filtering the CT data, a more significant interface between the different components of the tested concrete was achieved. Figure 10 then shows the way of segmenting the different concrete components for their 2D and 3D representation and determining their volumetric representation in the test body volume. Figure 11 shows the visualization of the individual components by coloring the intervals of gray values corresponding to the identifiable concrete components.
Figure 10.
An illustrative example of the distribution of gray level values in a CT volume of analyzed concrete, segmentation of individual concrete components using the coloring method (CSS: converter steel slag; ACBFS: and air-cooled blast furnace slag, CP: cement paste, and P: pore).
Figure 11.
Visualization of the segmentation of the individual components of the analyzed concrete test body 1A.
The volume of the individual components in the test bodies of the analyzed concrete specimen is shown in Table 9. This volume corresponds to the volume of all voxels belonging to a given segmentation interval. It is important to note that, for all solid components (CSS and ACBFS), this volume corresponds only to the volume of their material (“skeleton”) without including the volume of their pores. The volume of all pores is included in the P component.
Specimen
1A
2A
3A
2B
Average
Standard deviation
Coeff. var.
Total volume of component (cm3)
Total volume of component (cm3)
Total volume of component (cm3)
Total volume of component (cm3)
CSS_without pores
4.427
18.455
14.517
11.672
—
—
—
P
4.496
2.482
3.074
4.300
—
—
—
CP_without pores
22.889
20.177
21.401
16.573
—
—
—
ACBFS _without pores
23.374
14.521
17.085
26.407
—
—
—
Total analysis volume (cm3)
55.186
55.635
56.077
58.952
56.5
1.47
2.6
Share of CSS (%)
8.02
33.17
25.89
19.80
21.7
9.22
42.4
Share of P (%)
8.15
4.50
5.57
7.79
6.5
1.52
23.4
Share of CP (%)
41.48
36.56
38.78
30.03
36.7
4.23
11.5
Share of ACBFS (%)
42.35
26.31
30.96
47.85
36.9
8.62
23.4
Table 9.
Volume of the individual components in the test bodies of the tested concrete.
In the volumetric analysis of the individual components of concrete on the four test bodies (see Table 9), cement paste is represented by about 36.7%. This material shows the least variability in all the test bodies of concrete, i.e. about 11.5%. A similar volumetric representation of 36.9% is also attributed to the ACBFS fraction but with about twice the coefficient of variability, i.e. 23%. The porosity value shows an identical variability with a pore volume representation of 6.5% in concrete. The CSS fraction accounts on average for 21.7% of the concrete volume, but, in this case, the highest variability in the occurrence of this fraction in the analyzed bodies was found. The value of the coefficient of variability for the CSS fraction was approximately 42%. The values of the volume representation of the individual fractions ACBFS, CP and CSS correspond only to the volume of their material (“skeleton”) without including the volume of their pores. The volume of all pores in the concrete is included in the P component.
Our chapter presents experiences and results from research on the use of by-products from metallurgical production in concrete production. On the basis of industrial experience, we can draw the following conclusion:
The combination of converter steel slag (CSS) of fr. 0/8 mm and air-cooled blast furnace slag (ACBFS) of fr. 8/32 mm can be used as a 100% substitute for natural aggregate in concrete production.
Converter steel slag (CSS) of fr. 0/8 mm and air-cooled blast furnace slag (ACBFS) of fr. 8/32 mm does not affect the air content of fresh concrete. For the proposed formulations (C, CH and H), the air content ranged from 2.0 to 2.2%.
In the production of fresh concrete with CSS and ACBFS of fr. 8/32 mm, the repeatability of fresh concrete production was demonstrated without a significant change in fresh concrete specific weight values. The fresh concrete specific weight was in the range of 2620–2660 kg/m3.
The consistency of fresh concrete based on CSS fr. 0/8 mm and ACBFS fr. 8/32 mm can be adjusted to the desired value with the help of a plasticizing admixture, whilst maintaining the value of the water coefficient.
On the basis of our designed formulations for concrete based on CSS fr. 0/8 mm and ACBFS fr. 8/32 mm (see Chapter 2.3), we can prepare concrete with a cube strength of 40–80 MPa after 90 days and a flexural strength of 5–8 MPa after 28 days.
It has been shown that the placement of test bodies in a water and outdoor environment has a significant effect on the strength characteristics of concrete based on converter steel slag (CSS) fr. 0/8 mm and air-cooled blast furnace slag (ACBFS) fr. 8/32 mm). Outdoor placement of the test bodies will cause a reduction in strength compared to the aqueous environment. This applies to the cube strengths determined after 90 days for formulations C (an 8% reduction) and CH (a 3% reduction).
The use of H-CEMENT (see formulation H, Chapter 2.3) has proven to be successful for test bodies that have been stored in an outdoor environment. There was a 14% increase in cube strength after 90 days and a 37% increase in flexural strength after 28 days compared to the cube strength and flexural strength of the test bodies stored in an aqueous environment.
3D X-Ray Computed Tomography can be used to analyze the structure of concrete based on by-products of industrial production by identifying the grains of converter steel slag (CSS), air-cooled blast furnace slag (ACBFS), cement paste and the contact zone between the aggregate grain and cement paste.
The results of 3D X-ray computed tomography of concrete show that:
Concrete does not exhibit contraction-type inhomogeneities and other mechanical cracks in the cement paste.
Steel and air-cooled blast furnace slag grains are well anchored in the cement paste. The contact zone between the aggregate grains and the cement paste is not disturbed.
Significant inhomogeneities in the structure are represented by technological bubbles (air pores).
Air-cooled blast furnace slag has a high proportion of pores, average porosity value of 16 ± 9.53%.
Steel slag shows a porosity value of 5.5 ± 3.38%.
The average porosity value of concrete prepared on the basis of converter steel slag (CSS) fr. 0/8 mm and air-cooled blast furnace slag (ACBFS) fr. 8/32 mm) accounts for 6.5 ± 1.52%.
In the production of concretes based on converter steel slag (CSS) fr. 0/8 mm and air-cooled blast furnace slag (ACBFS) fr. 8/32 mm), it is advisable to use alkali-activated H-CEMENT as a binder, which will increase the strength of concrete placed outdoors and also help to reduce CO2 emissions compared to CEM II/B-S 42,5N.
The use of a potentially expansive converter steel slag with air-cooled blast furnace slag and a potential combination of binders did not produce the frequently published volumetric changes in concrete with the formation of destructive cracks.
The potential uses of concrete with steel and air-cooled blast furnace slag may be as follows:
Production of precast concrete elements e.g. road panels, concrete fences, protective concrete elements against terrorist attacks by vehicles in areas where large numbers of people are present;
This article has been written in collaboration with the laboratory of Považská cementáreň, a.s., ul. Janka Kráľa, 018 63 Ladce, Slovakia, thanks to Ing. Katarína Martauzová and Mrs. Helena Habánková.
References
1.Faleschini F, Alejandro Fernández-Ruíz M, Zanini MA, Brunelli K, Pellegrino C, Hernández-Montes E. High performance concrete with electric arc furnace slag as aggregate: Mechanical and durability properties. Construction and Building Materials. 2015;101:113-121. DOI: 10.1016/j.conbuildmat.2015.10.022
2.Pellegrino C, Gaddo V. Mechanical and durability characteristics of concrete containing EAF slag as aggregate. Cement and Concrete Composites. 2009;31:663-671. DOI: 10.1016/j.cemconcomp.2009.05.006
3.Abu-Eishah SI, El-Dieb AS, Bedir MS. Performance of concrete mixtures made with electric arc furnace (EAF) steel slag aggregate produced in the Arabian gulf region. Construction and Building Materials. 2012;34:249-256. DOI: 10.1016/j.conbuildmat.2012.02.012
4.San-José JT, Vegas I, Arribas I, Marcos I. The performance of steel-making slag concretes in the hardened state. Materials & Design. 2014;60:612-619. DOI: 10.1016/j.matdes.2014.04.030
5.Yi H, Xu G, Cheng H, Wang J, Wan Y, Chen H. An overview of utilization of steel slag. Procedia Environmental Sciences. 2012;16:791-801. DOI: 10.1016/j.proenv.2012.10.108
6.Kourounis S, Tsivilis S, Tsakiridis PE, Papadimitriou GD, Tsibouki Z. Properties and hydration of blended cements with steelmaking slag. Cement and Concrete Research. 2007;37:815-822. DOI: 10.1016/j.cemconres.2007.03.008
7.Zhang T, Yu Q , Wei J, Li J, Zhang P. Preparation of high performance blended cements and reclamation of iron concentrate from basic oxygen furnace steel slag. Resources, Conservation and Recycling. 2011;56:48-55. DOI: 10.1016/j.resconrec.2011.09.003
8.Kriskova L, Pontikes Y, Cizer Ö, Mertens G, Veulemans W, Geysen D, et al. Effect of mechanical activation on the hydraulic properties of stainless steel slags. Cement and Concrete Research. 2012;42:778-788. DOI: 10.1016/j.cemconres.2012.02.016
9.Dong Q , Wang G, Chen X, Tan J, Gu X. Recycling of steel slag aggregate in Portland cement concrete: An overview. Journal of Cleaner Production. 2021;282:124447. DOI: 10.1016/j.jclepro.2020.124447
10.Mengasini L, Mavroulidou M, Gunn MJ. Alkali-activated concrete mixes with ground granulated blast furnace slag and paper sludge ash in seawater environments. Sustainable Chemistry and Pharmacy. 2021;20:100380. DOI: 10.1016/j.scp.2021.100380
11.Wei X, Li D, Ming F, Yang C, Chen L, Liu Y. Influence of low-temperature curing on the mechanical strength, hydration process, and microstructure of alkali-activated fly ash and ground granulated blast furnace slag mortar. Construction and Building Materials. 2021;269:121811. DOI: 10.1016/j.conbuildmat.2020.121811
12.Kranthi Vijaya S, Jagadeeswari K, Lal Mohiddin S, Srinivas K. Stiffness determination of alkali activated ground granulated blast furnace slag based geo-polymer concrete. Materials Today: Proceedings. 2020. DOI: 10.1016/j.matpr.2020.10.775
13.Gholampour A, Zheng J, Ozbakkaloglu T. Development of waste-based concretes containing foundry sand, recycled fine aggregate, ground granulated blast furnace slag and fly ash. Construction and Building Materials. 2021;267:121004. DOI: 10.1016/j.conbuildmat.2020.121004
14.Etxeberria M, Pacheco C, Meneses JM, Berridi I. Properties of concrete using metallurgical industrial by-products as aggregates. Construction and Building Materials. 2010;24:1594-1600. DOI: 10.1016/j.conbuildmat.2010.02.034
15.Martauz P, Vaclavik V, Cvopa B. The use of steel slag in concrete. IOP Conference Series: Earth Environmental Science. 2017;92:012041. DOI: 10.1088/1755-1315/92/1/012041
16.Martauz P, Václavík V, Cvopa B. The influence of the environment on the properties of hybrid cement-based concrete with steel and air-cooled slags. Crystals. 2021;11:1087. DOI: 10.3390/cryst11091087
17.Shi C. Steel slag—Its production, processing, characteristics, and cementitious properties. Journal of Materials in Civil Engineering. 2004;16:230-236. DOI: 10.1061/(ASCE)0899-1561(2004)16:3(230)
18.Abhishek P, Ramachandra P, Niranjan PS. Use of recycled concrete aggregate and granulated blast furnace slag in self-compacting concrete. Materials Today: Proceedings. 2020. DOI: 10.1016/j.matpr.2020.10.239
19.Marinković S, Radonjanin V, Malešev M, Ignjatović I. Comparative environmental assessment of natural and recycled aggregate concrete. Waste Management. 2010;30:2255-2264. DOI: 10.1016/j.wasman.2010.04.012
20.EN 1097-6. Tests for mechanical and physical properties of aggregates—Part 6: Determination of particle density and water absorption; 2014
21.EN 1097-3. Tests for mechanical and physical properties of aggregates—Part 3: Determination of loose bulk density and voids; 1999
22.EN 933-1. Tests for geometrical properties of aggregates—Part 1: Determination of particle size distribution—Sieving method; 2012
23.EN 12390-2. Testing hardened concrete—Part 2: Making and curing specimens for strength tests; 2020