
Abstract
Accurate measurement of intraocular pressure (IOP) is a vital part of ocular hypertension management to prevent progression toward glaucoma. IOP remains as one of the only significantly treatable risk factors for glaucoma, thus illustrating the importance of tonometry. Our chapter intends to compare the various modalities of tonometry, including applanation, indentation, rebound, dynamic contour, and transpalpebral scleral palpation. Moreover, we will discuss advances that enable continuous 24-h IOP monitoring, including contact lens sensors and implantable microsensors and review implications for glaucoma diagnosis and management. We will consider aspects, such as mechanisms, accuracy and precision, ease of use, and possible limitations or complications of each modality.
Keywords
- intraocular pressure
- tonometry
- applanation
- noncontact
- indentation
- rebound
- dynamic contour
1. Introduction
Intraocular pressure (IOP) remains at the core of the ophthalmologic physical exam. As a careful balance between production and outflow of aqueous humor, disruptions to the equilibrium can lead to many pathologies, such as retinal detachment, uveitis, and glaucoma. IOP remains an important method of assessing the severity and progression of glaucoma, as well as efficacy of glaucoma treatments. With an appreciation of the biology that underlies aqueous humor dynamics, several instruments have been developed to obtain IOP measurements. The accuracy and precision of IOP readings have significant clinical implications and must be considered in the context in which the reading was taken, including the methodology used to obtain it. From a single reading through Tono-Pen tonometry to surgically implanted suprachoroidal microsensors with continuous IOP monitoring, each modality carries its own set of strengths and weaknesses. In this chapter, the various modalities to measure IOP are reviewed to provide the clinician with an understanding of the principles that enable IOP measurement and evidence regarding instrument use. In addition to evaluating conventional techniques of IOP measurements, an assessment of emerging techniques with the potential to revolutionize IOP monitoring and glaucoma management is discussed.
2. IOP principles: A function of aqueous humor production and outflow
IOP represents the magnitude of force exerted by the aqueous humor (AH) on the inner surface of the anterior eye. This relationship is shown in the Goldmann equation, which states that IOP = (F/C) + P, where F is aqueous flow rate, C is aqueous outflow, and P is the episcleral venous pressure. In effect, IOP indicates the balance between AH production and exit. Dysfunction in the balance between AH production and drainage can lead to increased IOP and subsequent pathology. Thus, an appreciation of the anatomy and physiology that dictates these aspects of aqueous humor is critical in the understanding of principles underlying IOP measurement.
2.1 AH production
Aqueous humor is produced by the cells in the ciliary body. Specifically, the anterior-most portion of the ciliary body constitutes the pars plicata, which contains the fingerlike projections of the ciliary process. The ciliary processes, in comparison to other regions of the ciliary body, contain higher amounts of interdigitations, mitochondria, rough endoplasmic reticulum, and gap junctions consistent with the function of aqueous humor production.
The process of AH production is conventionally broken into three steps. First, blood flows into the ciliary processes. Next, the hydrostatic and oncotic pressure gradient between the blood flow and the ciliary interstitium enables ultrafiltration of the plasma into the interstitium. Finally, the ciliary epithelium actively transports plasma ultrafiltrate from the basal side to the apical membrane and into the posterior chamber of the eye.
The ciliary body receives both sympathetic and parasympathetic innervation. The parasympathetic fibers arise from the Edinger–Westphal nucleus and the pterygopalatine ganglion. The sympathetic fibers arise from cervical superior ganglion and the carotid plexus. Hydrodynamic studies [1] have shown that the rate of AH turnover is around 1.0–1.5% of the anterior chamber volume per minute. Moreover, diurnal variations in AH production create a pattern referred to as the circadian rhythm of AH flow, with flow typically highest (3.0 μl/min) in the morning and lowest (1.5 μl/min) at night [2]. The mechanism underlying this patten is not well studied, but the actions of epinephrine on the ciliary epithelium are thought to mediate such effects [3].
2.2 Aqueous humor outflow
After production in the ciliary body, AH traverses from the posterior chamber to the anterior chamber around the lens and through the pupil (Figure 1). Two pathways—the conventional and nonconventional outflow routes—comprise AH exit from the anterior chamber. In the conventional pathway, AH traverses the trabecular meshwork to enter Schlemm’s canal. From Schlemm’s canal, AH enters the collector channels to join the episcleral venous system and, ultimately, systemic circulation. The nonconventional outflow pathway utilizes the uveal meshwork instead of the trabecular meshwork, with AH draining into the ciliary muscle interstitium.
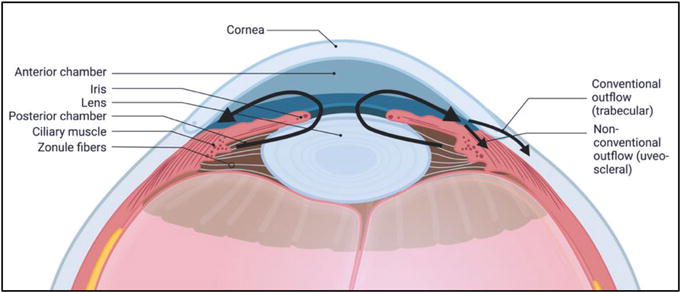
Figure 1.
Aqueous humor flow and outflow, depicting conventional outflow pathway
The relative contribution of the two principal outflow pathways is difficult to determine, but studies [5, 6, 7] suggest that the conventional pathway accounts for 70–90% of total outflow. However, a key difference is that conventional outflow
The different pathways can be selectively targeted by medications and surgery to reduce production and increase outflow of aqueous in the management of glaucoma.
3. Key clinical trials
Key clinical trials have informed management of glaucoma and the utility of IOP measurement in clinical practice. In 1999, results from the Early Manifest Glaucoma Trial (EMGT) evaluated whether immediate IOP reduction in early, previously untreated open-angle glaucoma affected disease progression [10]. Participants were randomized to combined medical and laser therapy or no initial treatment, with follow-up for a median of 6 years. The treatment group saw an average IOP reduction of 5.1 mmHg (25%), with a decreased frequency of disease progression (45% versus 62%; p = 0.007) that occurred much later. Treatment was found to have a protective effect in all patients, including those with high and low IOP, young and old age, and early and late disease stage. Analysis showed that a 1 mmHg reduction in IOP from baseline was associated with a 10% reduced risk of disease progression, with later analysis suggesting central corneal thickness as a risk factor in POAG and low blood pressure as a risk factor in normal tension glaucoma (IOP less than 21 mmHg). EMGT was the first large randomized clinical trial to demonstrate the utility of immediate IOP reduction in preventing glaucomatous progression.
Prior to data from the Collaborative Normal Tension Glaucoma Study (CNTGS), it was unclear whether IOP contributed to glaucomatous optic nerve damage and visual field loss in patients whose IOPs were within the normal range. This study [11, 12], however, showed that reductions in IOP by 30% slowed the rate of 5-year glaucomatous damage in this population, similar to primary open-angle glaucoma (POAG). Higher benefit was observed in females, those with a family history of glaucoma, with mild disc excavation, without a personal history of cardiovascular disease, and without family history of stroke. Key limitations, however, were that the definition of normal tension glaucoma in this study (24 mmHg) was higher than typically defined in clinic and that central cornea thickness was not measured.
The Ocular Hypertension Treatment Study (OHTS) [13, 14, 15] sought to assess the efficacy of IOP-reduction topical pharmacotherapy in preventing initial POAG onset. Adults with an elevated IOP (24–32 mmHg) without glaucomatous damage were randomly assigned to either the observation group or the topical ocular hypotensive group, which had a goal of 20% or more IOP reduction. Over the 5-year study period, the observation group had an IOP reduction of 4.0% ± 11.6%, while the pharmacotherapy group had an IOP reduction of 22.5% ± 9.9%. At 5 years, the observation group had a 9.5% probability of progression to POAG, compared to 4.4% in the pharmacotherapy group (hazard ratio, 0.40; P < .0001). Thus, this study established that topical pharmacotherapy in those with IOP greater than 24 mmHg reduced the risk of POAG development by 60%. Besides IOP, other factors predicting POAG development in the trial were older age, African American race, male sex, larger vertical and horizontal cup–disc ratio, greater Humphrey visual field pattern standard deviation, heart disease, and thin central corneal thickness (thickness was 553.1 ± 38.8 μm in patients who developed POAG, versus 574.3 ± 37.8 μm in those who did not).
The Advanced Glaucoma Intervention Study (AGIS) [16, 17] reinforced the importance of IOP control in preventing glaucoma progression and visual field deterioration in eyes that had exhausted maximally tolerated pharmacotherapy and underwent surgery. After argon laser trabeculoplasty or trabeculectomy, eyes with IOP greater than 17.5 mmHg (based on three 6-month follow-up visits) had a greater visual field defect (scored from 0 to 20) at follow-up than those with an IOP less than 14.5 (p = 0.002), with a greater degree of defect at 7 years (1.89 units; P < .001) than at 2 years (0.64 units; P = .071). A separate analysis in the same trial showed that eyes with less than 50% of IOP readings less than 18 mmHg (based on 6-month follow-up visits over 6 years post-surgery) had a greater degree of visual field deterioration compared to those with 100% of IOP readings less than 18 mmHg (P = .083), with the level of deterioration worse at 7 years (1.93 units; P < .001) than at 2 years (0.25 units; P = .572). Together, these findings highlighted the role of IOP management in preventing visual field worsening for glaucoma patients, especially those with a more progressed disease state.
While these trials only offer a glimpse into the history and development of glaucoma, they demonstrate the importance of IOP in clinical practice. Whether monitoring for glaucoma onset or effectiveness of intervention, measurement of IOP offers clinicians a critical data point that holds significant predictive value.
4. Measuring IOP
There are many considerations when designing devices to measure IOP. Accuracy and reliability compared to true IOP, which is only measurable by invasive manometry, are understandably two of the most important aspects of a device design. However, ease of use for the practitioner as well as tolerability for the patient are crucial factors for devices to be widely accepted for use in the clinical setting. This section will explore the many forms of tonometry invented over the years and discuss the advantages and disadvantages of each modality.
4.1 Applanation tonometry
Applanation tonometry is widely considered the most accurate and reliable form of IOP quantification. These instruments work by controlling the amount of force required to flatten a discrete area of cornea, which is used to calculate a corresponding eye pressure using the Imbert–Fick law. This law states that the pressure inside an ideal, dry, thin-walled sphere is equal to the force needed to flatten its surface divided by the area of flattening, or P = F/A, where P = pressure, F = force, and A = surface area of the flattened cornea [18].
4.1.1 Goldmann applanation tonometer
First invented in 1948 by Hans Goldmann [19], the Goldmann applanation tonometer (GAT) (Figure 2) is still currently considered the gold standard of tonometry to this day. As a truncated cone positioned on a slit lamp, the GAT makes contact with the cornea with a flattened surface area of about 7.35 mm2. This is the area at which the tear film meniscus for the tonometer head counterbalances the resistance of the cornea to flattening. The flattening force (in grams) multiplied by 10 is what calculates the IOP (in mmHg). When using GAT in the clinic, the cornea must first be anesthetized for patient comfort. Fluorescein dye is then applied to the patient’s eye so that the tear film is highlighted when blue light is shined. A dual prism embedded in the cone is used to divide the image of the tear meniscus into a superior and an inferior arc. After using peripheral knobs to adjust the force so that the two arcs align under slit lamp, the intraocular pressure can be read in mmHg. Although a very precise device, the GAT must be checked for calibration intermittently by checking whether the feeler arm is balanced at given dial positions to ensure accurate pressure readings [20]. While it is the most commonly used device due to its relative ease of use, accuracy (when calibrated properly), reproducibility, and affordability, there are a few disadvantages of this method. Various corneal parameters may affect measurement accuracy, including central corneal thickness (CCT), corneal curvature, axial length, hysteresis, and so forth. CCT most greatly impacts measurements, as the device was originally designed using the estimated average corneal thickness of 520–540 μm [21]. A study measured IOP with GAT in the central and temporal regions of the cornea before and after photorefractive keratectomy (PRK). It was found that after the central areas of the cornea were thinned by PRK, they measured an IOP 2–3 mmHg lower than the temporal regions [22]. Such studies demonstrate that thin corneas can lead to artificially low IOP measurements, whereas thick corneas may overestimate IOP by GAT. This is significant as thin corneas are a risk factor for glaucoma [23, 24]. When CCT is greater than 600 microns, a steep corneal curvature begins to have a significant impact on GAT measurements due to hysteresis and distribution of the tear film [25]. For corneas with vastly different radii between flat and steep meridians, GAT readings are recommended to be taken at both the steepest and flattest corneal axes or vertical and horizontal axes if unknown. The two readings are then averaged for the final IOP measurement [26]. Other possible limitations and errors to GAT include the tear film getting too little or too much fluorescein, having an irregular or scarred cornea, patient positioning with the slit lamp, GAT disinfection and calibration between patients, and physician experience [27].
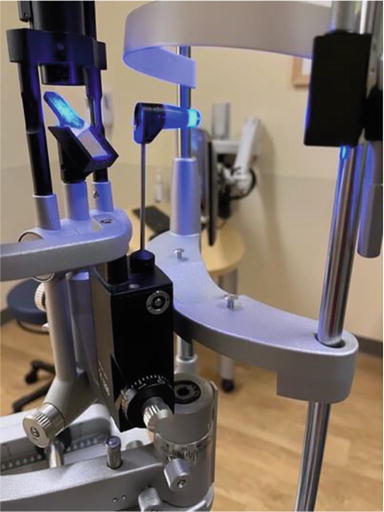
Figure 2.
The Goldmann applanation tonometer on the slit lamp.
There are also portable versions of GAT, such as Perkins and Draeger tonometers, which forgo the need for a slit lamp, allowing for supine IOP measurements for bed-bound patients.
4.1.2 Applanation resonance tonometry
Applanation resonance tonometry (ART) (Figure 3) also uses the principles of applanation but takes continuous measurements of force and contact area using a piezoelectric sensor. Similar to GAT, it is mounted on a slit lamp and requires anesthetic drops for the patient prior to use. The sensor contains a piezoelectric element that vibrates at a certain resonance frequency. When the sensor makes contact with the cornea using a constant force, a shift in frequency is generated, which is proportional to the contact area. This shift can then be used to calculate IOP using the Imbert–Fick law given the constant force and measured contact area [28, 29]. Multiple points are measured, and the median measurement and a quality index reflecting standard deviation are given. This feature of the device theoretically makes ART more accurate and precise than GAT. However, past studies [30, 31] seem to indicate that ART overestimates IOP compared to GAT. This device has many of the same disadvantages as GAT in practice, including measurements being influenced by CCT and corneal biomechanics, use of the slit lamp and anesthetics, and the need to sanitize the probe between patients.
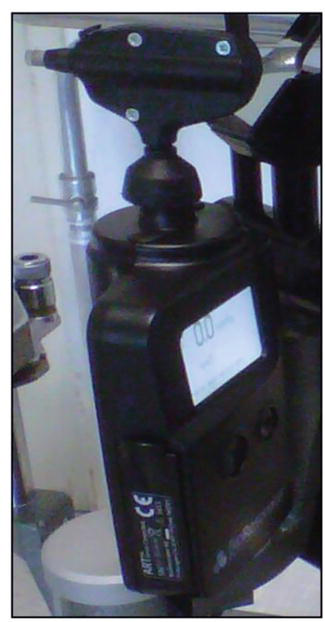
Figure 3.
The bioresonator Applanation resonance tonometer. Photo from Brusini and colleagues [
4.1.3 Noncontact tonometry
Noncontact tonometry (NCT) or air-puff tonometry (Figure 4) uses the principles of applanation but does not require anesthesia or fluorescein drops. NCT works by gradually pulsing air at an increasingly strong force until the cornea is flattened [32]. At that point, the production of air is stopped, and the force required to flatten is recorded and used to calculate IOP. The disadvantages of the NCT are that it becomes less accurate at higher subject IOPs, especially with IOP > 20 mmHg [33]. It is also influenced by corneal properties, similar to GAT [34]. Results also seem increasingly variable depending on the device brand and model and require regular calibration [35]. Airborne infections could also be greater with this mode of tonometry, although it limits risk of infection in the forms of contaminated drops or device surfaces [36]. The advantages of NCT lie in its ease of use and portability of many devices. It can be more easily used by medical staff without slit-lamp experience and more tolerable for patients who are less compliant with slit-lamp positioning, such as children or patients with disabilities. This modality could be more useful as a screening tool for patients without suspicion or risk factors of increased IOP or glaucoma undergoing routine checkups. It can be a useful alternative when GAT measurements may be difficult or skewed, such as for patients with limited cooperation, ocular pain, increased tear film meniscus size, or postoperative patients with lid edema.
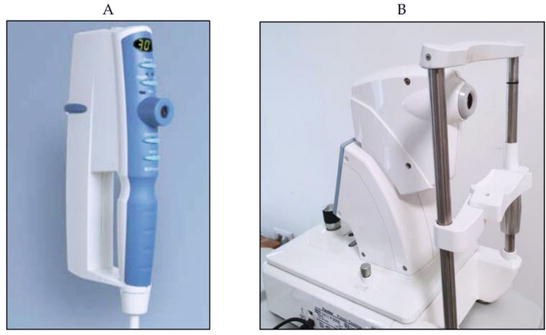
Figure 4.
The Pulsair EasyEye and Pulsair desktop tonometer. Photo from Brusini and colleagues [
4.1.4 Ocular response Analyzer
The Ocular Response Analyzer (ORA) (Figure 5) is a new version of the NCT. It utilizes an optical electrical system to additionally measure corneal elasticity or hysteresis to calculate a “corrected” IOP less dependent on CCT and other corneal parameters. The corneal elasticity is measured by taking the difference between the initial applanation force measured and a second applanation force [37]. The second applanation point is measured after fully indenting the cornea with stronger air columns and then slowly decreasing the air pressure to allow the cornea to “reinflate” until it reaches the second applanation point [37]. The pros of the ORA are its ease of use of noncontact nature and it had also been shown to be less influenced by corneal biomechanics and more accurately measures IOP after refractive surgery of the cornea when compared to GAT [38]. It has also been shown to better predict rates of glaucoma progression. This is due to the fact that corneal hysteresis is related to various glaucoma factors, including high cup-to-disc ratio and visual field defects [39, 40]. It can even help detect patients with corneal pathologies, such as keratoconus, or those at risk for corneal ectasia after refractive LASIK surgery [41, 42]. In terms of cons, the ORA seems to overestimate IOP, particularly at high IOP values [43, 44]. It is also a rather expensive device.
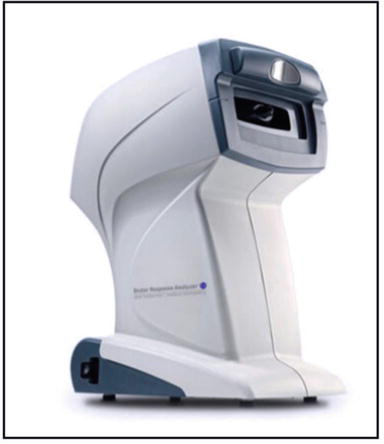
Figure 5.
The ocular response Analyzer G3. Photo from Brusini and colleagues [
4.2 Indentation tonometry
Indentation tonometry is based on the principle that a force will sink into a soft eye further than into a hard eye.
4.2.1 Schiøtz tonometer
The first instrument that applied this principle was the Schiøtz tonometer (Figure 6), which is no longer in use in the modern-day clinical setting. To use this instrument, the patient had to lie in a supine position and have their cornea indented by a plunger loaded with weights ranging from 5 to 15 grams. The depth of indentation into the cornea, ranging from 0 to 10 mm, is indirectly proportional to and converted to IOP. Additionally, the coefficient of ocular rigidity, unique to an individual’s eye, had to be accounted for to measure a more accurate IOP. The rudimentary measurement method using weights makes accurate IOP measurements difficult. It is cumbersome to use, and improper positioning of the eye, variability of ocular rigidity, and instrument variability all make the precision and reliability of this device questionable. Furthermore, this instrument is not practical without anesthesia due to patient tolerability. Although it is relatively affordable, simple, and does not require electronics, the development of more accurate, precise, and tolerable instruments has made the Schiøtz tonometer obsolete in modern-day clinics and only used in remote, low-resource settings [45].
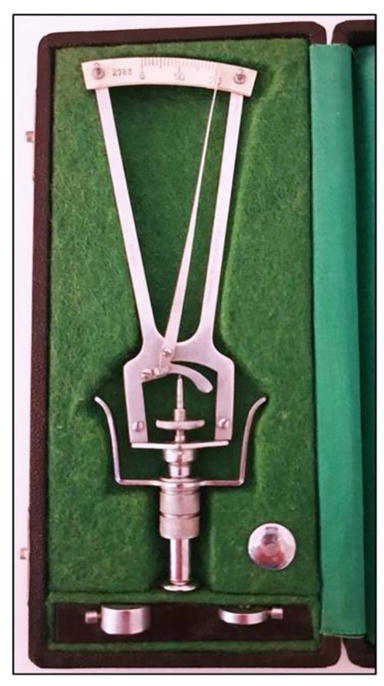
Figure 6.
The Schiøtz tonometer. Photo from Brusini and colleagues [
4.2.2 Corvis ST
The Corvis ST (Figure 7) is a more novel noncontact device that uses indentation tonometry principles using a jet of air. It has a Scheimpflug camera that monitors an 8.5 mm diameter at the center of the corneal surface. It visualizes with a high resolution of more than 4300 frames per second the corneal deformation and its return to normal shape as the air-jet indents the cornea. It then characterizes corneal deformation parameters to produce a “biomechanically corrected” IOP [46]. As a result, it has shown to be less impacted by CCT and corneal properties and more accurate when measuring patients who had previously undergone refractive surgery [47]. It has also proven to be a precise method of measuring IOP in healthy subjects [48]. It has similar advantages as NCT and ORA due to its noncontact nature, and it further characterizes corneal parameters. Its disadvantages include its need for specialized training for use, table mount setup, and high cost.
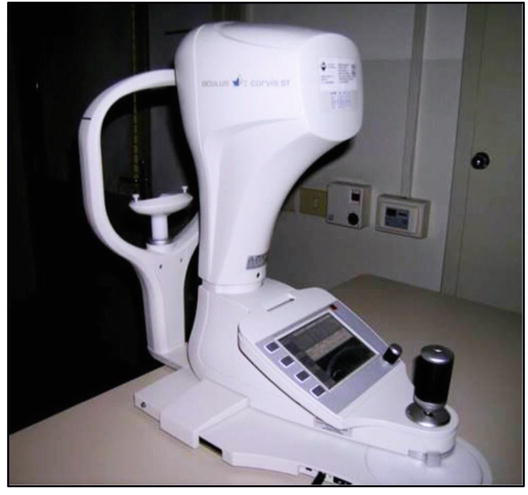
Figure 7.
The Corvis ST tonometer. Photo from Brusini and colleagues [
4.3 Combined applanation and indentation tonometry
4.3.1 Pneumotonometer
The pneumotonometer (Figure 8) combines indentation tonometry with applanation principles. To applanate the cornea, a 5 mm diameter silicone tip indents the cornea using pressure of a controlled flow of air. IOP is measured at the equilibrium point at which both the tip and cornea are flat [49]. Pneumotonometry has been shown to be quite accurate and precise for glaucoma screening with greater reliability than even GAT after corneal procedures, such as PRK and LASIK [50, 51, 52]. Its pros include its portability, minimal contact with the cornea, and ease of use. Unfortunately, the silicone tip can be difficult to disinfect, and it requires anesthetics for use and calibration for reliable readings. The pneumotonometer was also found to underestimate IOP at lower values and overestimate IOP at higher values compared to GAT and can also be easily influenced by CCT [53, 54].
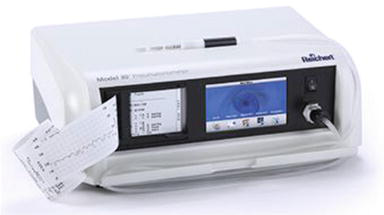
Figure 8.
The Reichert Pneumotonometer. Photo from Brusini and colleagues [
4.3.2 Tono-pen
Another device that applies both applanation and indentation tonometry is the Tono-Pen (Figure 9). The Tono-Pen is a small portable battery-powered device that uses a footplate with a tiny plunger connected to a strain gauge on its applanation surface. As the plunger makes contact with the cornea, it experiences increasing resistance due to the IOP, which is recorded as force on the strain gauge. When applanation occurs, the steadily increasing force decreases momentarily because the force is shared by the footplate and the plunger. This force value is then recorded and used to calculate IOP with the known applanation area. Multiple readings are recorded and averaged to produce the final reading in mmHg with a standard deviation value displayed as its reliability. This device is popular in the modern setting because it is handheld, can be used in any position, and does not require special training [49]. Because of its small area of contact, it can reliably measure irregular corneas and eyes with therapeutic contact lenses without removing the lenses [55, 56]. It also uses a disposable latex cap to reduce risk of infection between patients. Despite its convenience, the Tono-Pen is significantly impacted by CCT and seems to underestimate or overestimate IOP [31, 54, 57].
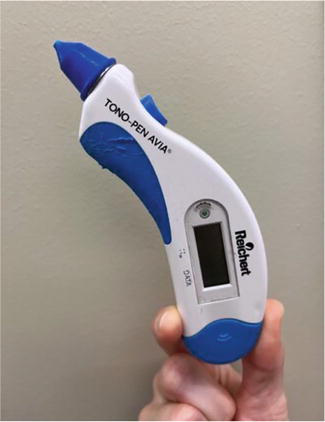
Figure 9.
The Tono-pen AVIA handheld tonometer.
4.4 Rebound tonometry
Rebound tonometry measures IOP as a function of a probe’s deceleration as it contacts the cornea.
4.4.1 iCare
The main rebound tonometer in use is the iCare tonometer (Figure 10). It uses a magnetized probe that is propelled toward the cornea and decelerates as it makes contact. The probe decelerates more quickly if the IOP is high and more slowly if the IOP is low. The motion of the probe generates a voltage in an internal solenoid that is then used to calculate IOP by a microprocessor [27]. The final IOP is averaged from several consecutive measurements. iCare has shown to have strong concordance with GAT of within 2–3 mmHg for both normal and glaucoma patients [58, 59]. Some studies do show, however, that iCare may underestimate pressures for IOPs greater than 23 mmHg [60]. It is also influenced by corneal parameters, particularly estimating higher IOP with thicker corneas [61, 62, 63, 64]. Positioning of the tip may also influence measurements. It seems to be most accurate for mid-range levels of IOP, ranging from 16 to 23 mmHg [62]. This device has also been demonstrated to make reliable and repeatable measurements with an intraclass correlation of >0.9 [65, 66]. Overall, the iCare tonometer is quick, affordable, easy to use, portable, and can be used in any position. It does not require anesthetics and is well tolerated by patients. It has minimal contact and disposable tips, reducing the risk of infection or corneal damage and allowing for postoperative measurements. Newer versions have even been marketed with the intention of allowing self IOP measurements at home.
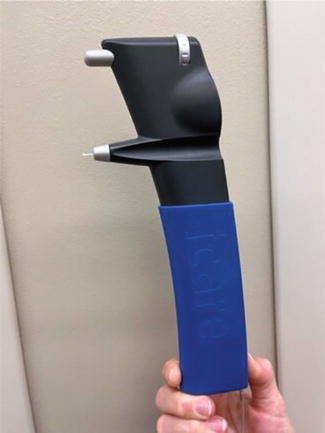
Figure 10.
iCare rebound tonometer, with attached disposable probe.
4.4.2 Transpalpebral scleral palpation
Transpalpebral scleral palpation (Figure 11) applies the principles of rebound tonometry through the upper eyelid to estimate IOP. The Diaton tonometer is one such device that releases a metal rod that decelerates as it contacts the eyelid, superior tarsal plate, and superior sclera. Its advantages are its noninvasive nature, reduced risk of infection, lack of need for anesthesia, and portability, which may make IOP measurements possible at home. The downside is its accuracy, only seeming to be a better alternative to finger palpation and tactile tonometry, which are subjective and qualitative measures of pressure [68]. Transpalpebral scleral palpation seems to better estimate IOP in thinned cornea after photorefractive surgeries compared to GAT [69]. However, it seems to be less sensitive overall than GAT in measuring IOP for patients with glaucoma [70, 71]. It overestimates IOP in the lower IOP ranges and underestimates in higher ranges. There is also poor precision and increased variability between readings for this modality, which make it questionable for legitimate clinical evaluation of IOP [68].
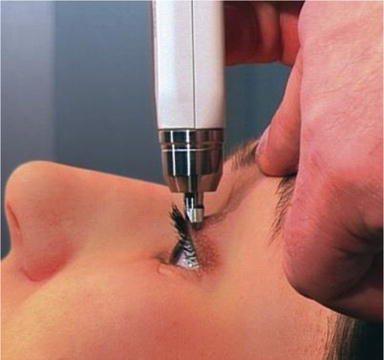
Figure 11.
Diaton tonometer for transpalpebral sceral palpation. Figure from Berg and colleagues [
4.5 Dynamic contour tonometry
The Dynamic Contour Tonometer (DCT) (Figure 12) implements the Pascal principle to calculate IOP [72]. According to the Pascal principle, in an enclosed space, changes in pressure are applied to all parts of a fluid. The device is mounted on a slit-lamp and measures pressure directly with a small piezoelectric sensor [73] as it touches the corneal surface, theoretically uninfluenced by corneal properties [74, 75, 76, 77]. As a result, it can be used for patients who have had photorefractive surgeries. It can also measure ocular pulse amplitude, which can indirectly characterize choroidal perfusion, an important factor in the onset and progression of glaucoma [78]. The DCT has even been shown to have higher reproducibility and precision compared to GAT. It generates a quality score from 1 (optimal) to 5 (unacceptable) to indicate the quality of IOP measured with a score of 1 or 2 being reliable for clinical practice [79, 80]. While largely concordant, DCT measurements do seem to measure much higher than GAT, particularly at low CCT [81]. The main disadvantages of the DCT include the training necessary for use and complexity for the patient, as cooperation with optimal head and eye positioning for a minimum of 8 seconds is needed. The device also requires anesthetic drops, corneal contact, and a slit lamp. Fortunately, the sensor tip is protected by disposable sensor caps to reduce the risk of infection.
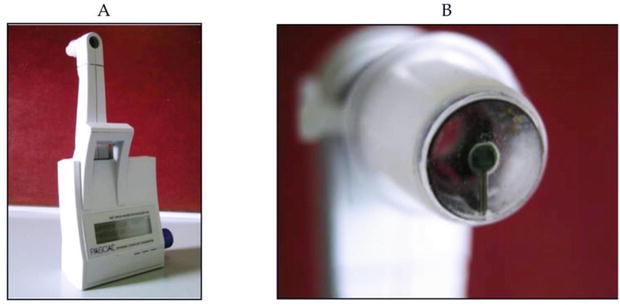
Figure 12.
The dynamic contour tonometer. Photo from Brusini and colleagues [
5. Measuring IOP: Looking ahead
While advances in technology have supported innovation in implantation and indentation tonometry, a key shortcoming is that these methods are instantaneous—only IOP at a singular point in time is measured. It is well noted, however, that IOP can fluctuate. This fluctuation can be 4–5 mmHg in healthy individuals and even higher in glaucomatous eyes. The role of long-term IOP variation as a glaucoma risk factor has been well established in clinical trials, as previously discussed. Several studies [82, 83, 84, 85] suggest that diurnal-nocturnal IOP fluctuations may be also indicative of glaucoma progression. In assessing the role of 24-h IOP changes using a contact lens sensor on the rate of visual field progression in glaucomatous eyes, a 2016 investigation [85] found that IOP parameters—which included the number of large IOP peaks and the mean peak ratio, which accounts for the magnitude of the peaks and time to peak—could predict the rate of glaucoma progression. Static IOP measurements do not enable measurement of these parameters and may misdiagnose patients. This can be particularly problematic for normo-tensive glaucoma patients, who demonstrate significant damage and progression despite normal IOP values in clinic. For this group, an elevated IOP may be found during non-clinic hours, such as at night or early in the morning. Although clinical methods gain partial insight into diurnal IOP variations by obtaining static IOP measurement in the morning and at night, the appreciation of IOP as a dynamic measure has enhanced interest in continuous tonometry to monitor disease. Several devices have been developed for continuous IOP monitoring, ranging from contact lens sensors to surgical implants. With only a few studies to assess the accuracy and precision of these monitors, a thorough evaluation of evidence is needed to ascertain indications for and limitations of use.
5.1 Contact lens sensors: Sensimed triggerfish
The Sensimed Triggerfish (Figure 13) is a CE-marked and FDA-approved contact lens sensor (CLS) designed for 24-h IOP monitoring. At 14.1 mm in diameter and 585 um in central thickness, the Sensimed Triggerfish silicone contact lens contains a microprocessor, two strain gauges, and an antenna. The strain gauges detect changes in corneal shape, for which a correlation between corneal curvature and IOP has been demonstrated in animal models [86, 87]. Strain gauge readings are taken for a 30-second period every 5 minutes for the duration of the 24 h. The strain gauge transmits data to a wireless periorbital antenna attached to the patient, which then further transmits data to a portable recorder. The IOP data is recorded in millivolts and is measured relative to the first measurement, which is taken as zero.
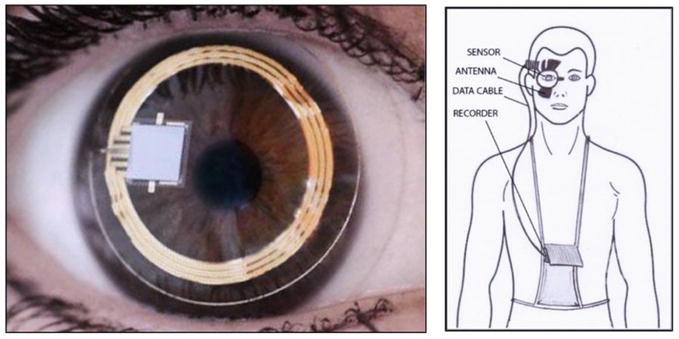
Figure 13.
(left) – Sensimed Triggerfish contact lens sensor worn in sample eye; (right) – The contact lens sensor wirelessly transmits data to an adhesive periorbital patch that includes the antenna.
Studies suggest that the Triggerfish device provides reproducible data. Mansouri and colleagues [88] spaced 24-h IOP readings one week apart in 40 patients, with a Pearson correlation coefficient of 0.59 between sessions, interpreted by the authors as fair reproducibility. Hollo and colleagues [89] reported a Pearson coefficient of 0.729 between CLS curves in their study of 9 patients. While data of reproducibility is promising, a major limitation of this device is that the correlation between device output in millivolts and IOP, in mmHg, is not established. No algorithm has been able to convert CLS output directly into IOP, even in animal models, as different rates of CLS output were noted per IOP change in different eyes. In enucleated pig eyes, Leonardi and colleagues [86] noted changes in CLS output ranging from 0.067 mV to 0.124 mV per mm Hg change in IOP. It is even more difficult to assess validity in human eyes, as insertion of the CLS precludes traditional tonometry. Researchers have attempted to circumvent this by utilizing the CLS in one eye and measuring IOP in the other eye. In one study [87] of 33 patients utilizing the CLS in one eye and IOP measured every 2 h
The principal advantage of this device is its noninvasive ease of use, as many patients are familiar with traditional contact lenses. Accordingly, it is generally well-tolerated by both glaucomatous and non-glaucomatous patients. Typically, two short clinic visits are required for Triggerfish use, one visit to apply the device and one to remove the device. Studies using the visual analog scale (VAS), where 0 represents no discomfort and 100 represents severe discomfort, suggest high levels of patient tolerability. For example, a study [90] of 20 glaucoma and 20 non-glaucoma patients showed a VAS score of 21.82 and 26.8, respectively. Clinical studies [88, 90] show 75–95% of patients had a device-related adverse event, though the majority of complications were mild. Complications associated with Sensimed Triggerfish use were hyperemia, blurred vision, and punctate keratitis [89, 91]. In one study [88], only 3% of patients had severe complications, all of which were conjunctival hyperemia. All complications resolved within 24 h of device removal. Moreover, artificial tears may be utilized in the event of mild ocular pruritus.
5.2 Implantable microsensors: Eyemate-IO and eyemate-SC
While 24-h IOP monitoring
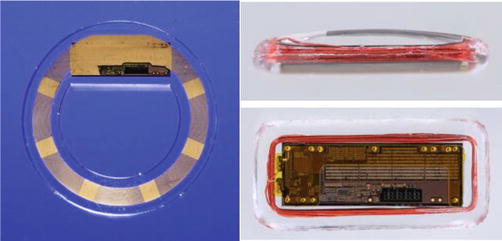
Figure 14.
(left) – EYEMATE-IO, for implantation into the ciliary sulcus; (right, top and bottom) – EYEMATE-SC, for implantation into the suprachoroidal space. Photos from Choritz et al. [
The ARGOS-01 study evaluated the Eyemate-IO device in six patients with POAG or normotensive glaucoma receiving cataract surgery. Upon implantation, four of the patients developed perioperative inflammation that was well controlled with steroids. One-year results [95] showed that all participants maintained glaucoma control. Mild pupillary distortion that remained stable over time was reported in all patients, but no other adverse events were noted. Furthermore, central corneal thickness and endothelial cell count were stable in all six patients. However, results of the ARGOS-01 trial showed that IOP as measured by the implanted sensor may drift higher.
This prompted the creation of a second-generation Eyemate device, whose 12-month outcomes were evaluated in the ARGOS-02 trial [92]. This trial of 22 patients demonstrated minimal surgical complication (most commonly, a floppy iris) with an incision size of 5.5 to 6 mm required. Compared to the first-generation design, decreases in pigment dispersion and transillumination defects were seen. Like the first iteration, all implantation-related adverse events resolved promptly with appropriate treatment. 12 months of follow-up showed correlation between device readings and GAT results, with an interclass correlation coefficient of 0.783. However, Eyemate-IO IOP outputs were on average 3.2 mmHg higher than GAT readings.
While the second-iteration Eyemate-IO had several improvements, key limitations still existed due to device placement in the ciliary sulcus: iris chafing, iris atrophy, pupillary distortion, and pigment dispersion [92]. Moreover, implantation was limited to pseudophakic patients, thus excluding many patients. Accordingly, an IOP monitor for suprachoroidal implantation, the Eyemate-SC (Figure 14), was developed with the major advantage that the anterior chamber remains intact with readings still independent of corneal mechanics. More compact than the Eyemate-IO, the Eyemate-SC showed promising results in animal models [96]. Implantation of the device in six rabbit eyes showed no adverse outcomes, with histological analysis demonstrating mild fibrosis without any pathology. Importantly, there was strong correlation with device IOP and intracameral IOP up to 30 weeks following implantation with strong biocompatibility. In humans, Szurman and colleagues [97] evaluated safety and performance of the Eyemate-SC in 23 eyes that underwent canaloplasty or deep sclerectomy. Implantation was successful in all eyes without major complication, choroid injury, or bleeding. Touch-sensitivity was the only device-related adverse event during the first six months, reported in three patients. Temporary increases in corneal astigmatism were reported in the early postoperative period. While device IOP and GAT IOP did show transient deviations in agreement in the first few weeks after implantation, these discrepancies normalized after three months with an agreement of −0.15 mm Hg ± 2.28 between GAT IOP and Eyemate-SC IOP after six months. It is likely that this increased initial discrepancy is due to corneal astigmatism caused by device implantation of the device, which has been shown to affect GAT IOP values [98]. 2023 results [93] of the 12-month follow-up period of the same cohort continued to show promise, with no evidence of device migration or major adverse events from the device. In terms of Eyemate-SC accuracy, mean IOP difference between GAT and Eyemate-SC was 0.8 mmHg, with 8.3% of measurements showing a discrepancy of >5 mmHg. As the eye healed following surgery, readings improved in accuracy. From three months to twelve months, the mean difference between GAT and device telemetry readings was −0.2 mmHg, with all device measurements within 5 mmHg of GAT. Overall, one-year outcomes of the Eyemate-SC point toward promising outcomes in safety, tolerability, and efficacy.
5.3 Injectable microsensor: IOP connect
While the Eyemate devices require surgical implantation, IOP Connect by Injectsense is developed for outpatient implantation
6. Conclusion
The importance of IOP in ophthalmologic practice cannot be understated. Investigations into the physiology of aqueous humor dynamics and several clinical trials have identified IOP measurement and monitoring as the mainstay for knowing when to intervene for numerous pathologies, such as glaucoma. Appreciation of applanation principles enabled development of the GAT, which became the gold standard for IOP measurement. Over time, numerous instruments have been developed using the principles of applanation and indentation. As data-driven medicine evolves, continuous IOP monitoring will better illuminate variations in IOP over time. Several continuous IOP sensors have been developed, including contact lens sensors for 24-h use and suprachoroidal implants for long-term monitoring. While significant clinical trials are still needed to validate continuous IOP monitors, they represent a promising therapeutic tool that may revolutionize the management of glaucoma. Of the many devices that have been developed, each has their distinct strengths and weaknesses in terms of accuracy, reliability, practicality, and cost. Ultimately, it is up to the clinician to choose the device that best suits the unique circumstances of their practice and their patients.
References
- 1.
Goel M, Picciani RG, Lee RK, Bhattacharya SK. Aqueous humor dynamics: A review. Open Ophthalmology Journal. 2010; 47 :52-59 - 2.
Maus TL, Brubaker RF. Measurement of aqueous humor flow by fluorophotometry in the presence of a dilated pupil. Investigative Ophthalmology & Visual Science. 1999; 40 (2):542-546 - 3.
Brubaker RF. Chapter 9 clinical measurements of aqueous dynamics: Lmplications for addressing Glaucoma. In: Current Topics in Membranes. Elsevier; 1997. pp. 233-284. Available from: https://linkinghub.elsevier.com/retrieve/pii/S007021610860249X - 4.
Sunderland DK, Sapra A. Physiology, Aqueous Humor Circulation. Treasure Island (FL): StatPearls Publishing; 2023. Available from: http://www.ncbi.nlm.nih.gov/books/NBK553209/ - 5.
Fautsch MP, Johnson DH. Aqueous humor outflow: What do we know? Where will it lead us? Investigative Ophthalmology & Visual Science. 2006; 47 (10):4181-4187 - 6.
Weinreb RN. Uveoscleral outflow: The other outflow pathway. Journal of Glaucoma. 2000; 9 (5):343-345 - 7.
Alm A, Nilsson SFE. Uveoscleral outflow: A review. Experimental Eye Research. 2009; 88 (4):760-768 - 8.
Brubaker RF. Measurement of uveoscleral outflow in humans. Journal of Glaucoma. 2001; 5 (Suppl. 1):S45-S48 - 9.
Johnson M, McLaren JW, Overby DR. Unconventional aqueous humor outflow: A review. Experimental Eye Research. 2017; 158 :94-111 - 10.
Heijl A. Reduction of intraocular pressure and glaucoma progression: Results from the early manifest glaucoma trial. Archives of Ophthalmology. 2002; 120 (10):1268 - 11.
Anderson DR, Normal Tension Glaucoma Study. Collaborative normal tension glaucoma study. Current Opinion in Ophthalmology. 2003; 14 (2):86-90 - 12.
Anderson DR, Drance SM, Schulzer M, Collaborative Normal-Tension Glaucoma Study Group. Factors that predict the benefit of lowering intraocular pressure in normal tension glaucoma. American Journal of Ophthalmology. 2003; 136 (5):820-829 - 13.
Kass MA, Heuer DK, Higginbotham EJ, Johnson CA, Keltner JL, Miller JP, et al. The Ocular Hypertension Treatment Study: A randomized trial determines that topical ocular hypotensive medication delays or prevents the onset of primary open-angle glaucoma. Archives of Ophthalmology. 2002; 120 (6):701-713 discussion 829-830. - 14.
Higginbotham EJ, Gordon MO, Beiser JA, Drake MV, Bennett GR, Wilson MR, et al. The Ocular Hypertension Treatment Study: Topical medication delays or prevents primary open-angle glaucoma in African American individuals. Archives of Ophthalmology. 2004; 122 (6):813-820 - 15.
Budenz DL, Anderson DR, Feuer WJ, Beiser JA, Schiffman J, Parrish RK, et al. Detection and prognostic significance of optic disc hemorrhages during the ocular hypertension treatment Study. Ophthalmology. 2006; 113 (12):2137-2143 - 16.
Ederer F, Gaasterland DE, Sullivan EK, Investigators AGIS. The advanced Glaucoma intervention Study (AGIS): 1. Study design and methods and baseline characteristics of study patients. Controlled Clinical Trials. 1994; 15 (4):299-325 - 17.
The Advanced Glaucoma Intervention Study (AGIS): 7. The relationship between control of intraocular pressure and visual field deterioration.The AGIS Investigators. American Journal of Ophthalmology. 2000; 130 (4):429-440 - 18.
Allingham RR. Shields Textbook of glaucoma. Seventh ed. Philadelphia: Wolters Kluwer; 2021 - 19.
Goldmann H, Schmidt T. Applanation tonometry. Ophthalmologica. 1957; 134 (4):221-242 - 20.
Cordero I. How to verify the calibration of Goldmann tonometers. Community Eye Health. 2012; 25 (79-80):65 - 21.
Ehlers N, Bramsen T, Sperling S. Applanation tonometry and central corneal thickness. Acta Ophthalmologica. 1975; 53 (1):34-43 - 22.
Schipper I, Senn P, Niesen U. Are we measuring the right intraocular pressure after excimer laser photorefractive laser keratoplasty in myopia? Klinische Monatsblätter für Augenheilkunde. 1995; 206 (5):322-324 - 23.
Brandt JD, Beiser JA, Kass MA, Gordon MO. Central corneal thickness in the ocular hypertension treatment Study (OHTS). Ophthalmology. 2001; 108 (10):1779-1788 - 24.
Doughty MJ, Zaman ML. Human corneal thickness and its impact on intraocular pressure measures: A review and meta-analysis approach. Survey of Ophthalmology. 2000; 44 (5):367-408 - 25.
Matsumoto T, Makino H, Uozato H, Saishin M, Miyamoto S. The influence of corneal thickness and curvature on the difference between intraocular pressure measurements obtained with a non-contact tonometer and those with a Goldmann Applanation tonometer. Japanese Journal of Ophthalmology. 2000; 44 (6):691 - 26.
Mark HH, Mark TL. Corneal astigmatism in applanation tonometry. Eye (London, England). 2003; 17 (5):617-618 - 27.
Brusini P, Salvetat ML, Zeppieri M. How to measure intraocular pressure: An updated review of various tonometers. Journal of Clinical Medicine. 2021; 10 (17):3860 - 28.
Stamper RL. A history of intraocular pressure and its measurement. Optometry and Vision Science. 2011; 88 (1):E16-E28 - 29.
Eklund A, Hallberg P, Lindén C, Lindahl OA. An applanation resonator sensor for measuring intraocular pressure using combined continuous force and area measurement. Investigative Ophthalmology & Visual Science. 2003; 44 (7):3017-3024 - 30.
Ottobelli L, Fogagnolo P, Frezzotti P, De Cillà S, Vallenzasca E, Digiuni M, et al. Repeatability and reproducibility of applanation resonance tonometry: A cross-sectional study. BMC Ophthalmology. 2015; 15 :36 - 31.
Salvetat ML, Zeppieri M, Tosoni C, Brusini P. Repeatability and accuracy of applanation resonance tonometry in healthy subjects and patients with glaucoma. Acta Ophthalmologica. 2014; 92 (1):e66-e73 - 32.
Grolman B. A new tonometer system. American Journal of Optometry and Archives of American Academy of Optometry. 1972; 49 (8):646-660 - 33.
Stock RA, Ströher C, Sampaio RR, Mergener RA, Bonamigo EL. A comparative Study between the Goldmann Applanation tonometer and the non-contact air-puff tonometer (Huvitz HNT 7000) in Normal eyes. Clinical Ophthalmology. 2021; 15 :445-451 - 34.
Kyei S, Assiamah F, Kwarteng MA, Gboglu CP. The association of central corneal thickness and intraocular pressure measures by non-contact tonometry and Goldmann Applanation tonometry among glaucoma patients. Ethiopian Journal of Health Sciences. 2020; 30 (6):999-1004 - 35.
Atkinson PL, Wishart PK, James JN, Vernon SA, Reid F. Deterioration in the accuracy of the pulsair non-contact tonometer with use: Need for regular calibration. Eye (London, England). 1992; 6 (Pt 5):530-534 - 36.
Britt JM, Clifton BC, Barnebey HS, Mills RP. Microaerosol formation in noncontact “air-puff” tonometry. Archives of Ophthalmology. 1991; 109 (2):225-228 - 37.
Luce DA. Determining in vivo biomechanical properties of the cornea with an ocular response analyzer. Journal of Cataract and Refractive Surgery. 2005; 31 (1):156-162 - 38.
Zhang H, Sun Z, Li L, Sun R, Zhang H. Comparison of intraocular pressure measured by ocular response analyzer and Goldmann applanation tonometer after corneal refractive surgery: A systematic review and meta-analysis. BMC Ophthalmology. 2020; 20 (1):23 - 39.
Lascaratos G, Garway-Heath DF, Russell RA, Crabb DP, Zhu H, Hirn C, et al. Intraocular pressure (IOP) measured with the ocular response analyzer is a better predictor of glaucoma progression than Goldmann IOP in the United Kingdom Glaucoma treatment Study (UKGTS). Investigative Ophthalmology & Visual Science. 2014; 55 (13):128-128 - 40.
Susanna BN, Ogata NG, Daga FB, Susanna CN, Diniz-Filho A, Medeiros FA. Association between rates of visual field progression and intraocular pressure measurements obtained by different tonometers. Ophthalmology. 2019; 126 (1):49-54 - 41.
Kirgiz A, Karaman Erdur S, Atalay K, Gurez C. The role of ocular response analyzer in differentiation of Forme Fruste Keratoconus from corneal astigmatism. Eye & Contact Lens. 2019; 45 (2):83-87 - 42.
Randleman JB. Post-laser in-situ keratomileusis ectasia: Current understanding and future directions. Current Opinion in Ophthalmology. 2006; 17 (4):406-412 - 43.
Kynigopoulos M, Schlote T, Kotecha A, Tzamalis A, Pajic B, Haefliger I. Repeatability of intraocular pressure and corneal biomechanical properties measurements by the ocular response analyser. Klinische Monatsblätter für Augenheilkunde. 2008; 225 (5):357-360 - 44.
Martinez-de-la-Casa JM, Garcia-Feijoo J, Fernandez-Vidal A, Mendez-Hernandez C, Garcia-Sanchez J. Ocular response analyzer versus Goldmann applanation tonometry for intraocular pressure measurements. Investigative Ophthalmology & Visual Science. 2006; 47 (10):4410-4414 - 45.
Albert DM, Keeler R. The pressure: Before and after Schiøtz. Ophthalmology Glaucoma. 2020; 3 (6):409-413 - 46.
Ambrósio R Jr, Ramos I, Luz A, Faria FC, Steinmueller A, Krug M, et al. Dynamic ultra high speed Scheimpflug imaging for assessing corneal biomechanical properties. Revista Brasileira de Oftalmologia. 2013; 72 (2):99-102 - 47.
Bao F, Huang W, Zhu R, Lu N, Wang Y, Li H, et al. Effectiveness of the Goldmann applanation tonometer, the dynamic contour tonometer, the ocular response Analyzer and the Corvis ST in measuring intraocular pressure following FS-LASIK. Current Eye Research. 2020; 45 (2):144-152 - 48.
Lopes BT, Roberts CJ, Elsheikh A, Vinciguerra R, Vinciguerra P, Reisdorf S, et al. Repeatability and reproducibility of intraocular pressure and dynamic corneal response parameters assessed by the Corvis ST. Journal of Ophthalmology. 2017; 2017 :8515742 - 49.
Aziz K, Friedman DS. Tonometers-which one should I use? Eye (London, England). 2018; 32 (5):931-937 - 50.
Guildford J, O’Day DM. Applanation pneumotonometry in screening for glaucoma. Southern Medical Journal. 1985; 78 (9):1081-1083 - 51.
Abbasoglu OE, Bowman RW, Cavanagh HD, McCulley JP. Reliability of intraocular pressure measurements after myopic excimer photorefractive keratectomy. Ophthalmology. 1998; 105 (12):2193-2196 - 52.
Zadok D, Tran DB, Twa M, Carpenter M, Schanzlin DJ. Pneumotonometry versus Goldmann tonometry after laser in situ keratomileusis for myopia. Journal of Cataract and Refractive Surgery. 1999; 25 (10):1344-1348 - 53.
Tonnu PA, Ho T, Sharma K, White E, Bunce C, Garway-Heath D. A comparison of four methods of tonometry: Method agreement and interobserver variability. The British Journal of Ophthalmology. 2005; 89 (7):847-850 - 54.
Tonnu PA, Ho T, Newson T, El Sheikh A, Sharma K, White E, et al. The influence of central corneal thickness and age on intraocular pressure measured by pneumotonometry, non-contact tonometry, the Tono-pen XL, and Goldmann applanation tonometry. The British Journal of Ophthalmology. 2005; 89 (7):851-854 - 55.
De Moraes CGV, Prata TS, Liebmann J, Ritch R. Modalities of tonometry and their accuracy with respect to corneal thickness and irregularities. Journal of Optometry. 2008; 1 (2):43-49 - 56.
Scibilia GD, Ehlers WH, Donshik PC. The effects of therapeutic contact lenses on intraocular pressure measurement. The CLAO Journal. 1996; 22 (4):262-265 - 57.
Frenkel RE, Hong YJ, Shin DH. Comparison of the Tono-Pen to the Goldmann applanation tonometer. Archives of Ophthalmology. 1988; 106 (6):750-753 - 58.
Badakere SV, Chary R, Choudhari NS, Rao HL, Garudadri C, Senthil S. Agreement of intraocular pressure measurement of Icare ic200 with Goldmann Applanation tonometer in adult eyes with normal cornea. Ophthalmology Glaucoma. 2021; 4 (1):89-94 - 59.
Brusini P, Salvetat ML, Zeppieri M, Tosoni C, Parisi L. Comparison of ICare tonometer with Goldmann applanation tonometer in glaucoma patients. Journal of Glaucoma. 2006; 15 (3):213-217 - 60.
Gao F, Liu X, Zhao Q , Pan Y. Comparison of the iCare rebound tonometer and the Goldmann applanation tonometer. Experimental and Therapeutic Medicine. 2017; 13 (5):1912-1916 - 61.
Nakakura S, Mori E, Fujio Y, Fujisawa Y, Matsuya K, Kobayashi Y, et al. Comparison of the intraocular pressure measured using the new rebound tonometer Icare ic100 and Icare TA01i or Goldmann Applanation tonometer. Journal of Glaucoma. 2019; 28 (2):172-177 - 62.
Liu J, De Francesco T, Schlenker M, Ahmed II. Icare home tonometer: A review of characteristics and clinical utility. Clinical Ophthalmology. 2020; 14 :4031-4045 - 63.
Chen M, Zhang L, Xu J, Chen X, Gu Y, Ren Y, et al. Comparability of three intraocular pressure measurement: iCare pro rebound, non-contact and Goldmann applanation tonometry in different IOP group. BMC Ophthalmology. 2019; 19 (1):225 - 64.
Nakamura M, Darhad U, Tatsumi Y, Fujioka M, Kusuhara A, Maeda H, et al. Agreement of rebound tonometer in measuring intraocular pressure with three types of applanation tonometers. American Journal of Ophthalmology. 2006; 142 (2):332-334 - 65.
Jose J, Ve RS, Pai HV, Biswas S, Parimi V, Poojary P, et al. Agreement and repeatability of Icare ic100 tonometer. Indian Journal of Ophthalmology. 2020; 68 (10):2122-2125 - 66.
Nakakura S, Asaoka R, Terao E, Nagata Y, Fukuma Y, Oogi S, et al. Evaluation of rebound tonometer iCare IC200 as compared with IcarePRO and Goldmann applanation tonometer in patients with glaucoma. Eye Vision (Lond). 2021; 8 (1):25 - 67.
Berg C, Doniger SJ, Zaia B, Williams SR. Change in intraocular pressure during point-of-care ultrasound. The Western Journal of Emergency Medicine. 2015; 16 (2):263-268 - 68.
Chakraborty AK, Majumder M, Sen S. Comparison of transpalpebral tonometer with Goldmann applanation tonometer. Taiwan Journal of Ophthalmology. 2014; 4 (3):110-115 - 69.
Shemesh G, Man O, Michaeli A, Varssano D, Lazar M. Pressure phosphene tonometry versus Goldmann Applanation tonometry for measuring intraocular pressure before and after LASIK. Journal of Refractive Surgery. 2007; 23 (4):405-409 - 70.
Alvarez T. The proview phosphene tonometer fails to measure ocular pressure accurately in clinical practice*1. Ophthalmology. 2004; 111 (6):1077-1085 - 71.
Danesh-Meyer HV, Niederer R, Gaskin BJ, Gamble G. Comparison of the Proview pressure phosphene tonometer performed by the patient and examiner with the Goldmann applanation tonometer. Clinical & Experimental Ophthalmology. 2004; 32 (1):29-32 - 72.
Kaufmann C, Bachmann LM, Thiel MA. Intraocular pressure measurements using dynamic contour tonometry after laser in situ keratomileusis. Investigative Ophthalmology & Visual Science. 2003; 44 (9):3790-3794 - 73.
Punjabi OS, Kniestedt C, Stamper RL, Lin SC. Dynamic contour tonometry: Principle and use. Clinical & Experimental Ophthalmology. 2006; 34 (9):837-840 - 74.
Katsimpris JM, Theoulakis PE, Vasilopoulos K, Skourtis G, Papadopoulos GE, Petropoulos IK. Correlation between central corneal thickness and intraocular pressure measured by Goldmann Applanation tonometry or Pascal dynamic contour tonometry. Klinische Monatsblätter für Augenheilkunde. 2015; 232 (4):414-418 - 75.
Siganos DS, Papastergiou GI, Moedas C. Assessment of the Pascal dynamic contour tonometer in monitoring intraocular pressure in unoperated eyes and eyes after LASIK. Journal of Cataract and Refractive Surgery. 2004; 30 (4):746-751 - 76.
Lee SY, Kim EW, Choi W, Park CK, Kim S, Bae HW, et al. Significance of dynamic contour tonometry in evaluation of progression of glaucoma in patients with a history of laser refractive surgery. The British Journal of Ophthalmology. 2020; 104 (2):276-281 - 77.
Kandarakis A, Soumplis V, Pitsas C, Kandarakis S, Halikias J, Karagiannis D. Comparison of dynamic contour tonometry and Goldmann Applanation tonometry following penetrating keratoplasty. Canadian Journal of Ophthalmology. 2010; 45 (5):489-493 - 78.
Schwenn O, Troost R, Vogel A, Grus F, Beck S, Pfeiffer N. Ocular pulse amplitude in patients with open angle glaucoma, normal tension glaucoma, and ocular hypertension. The British Journal of Ophthalmology. 2002; 86 (9):981-984 - 79.
Fogagnolo P, Figus M, Frezzotti P, Iester M, Oddone F, Zeppieri M, et al. Test-retest variability of intraocular pressure and ocular pulse amplitude for dynamic contour tonometry: A multicentre study. The British Journal of Ophthalmology. 2010; 94 (4):419-423 - 80.
Wang AS, Alencar LM, Weinreb RN, Tafreshi A, Deokule S, Vizzeri G, et al. Repeatability and reproducibility of Goldmann applanation, dynamic contour, and ocular response analyzer tonometry. Journal of Glaucoma. 2013; 22 (2):127-132 - 81.
Francis BA, Hsieh A, Lai MY, Chopra V, Pena F, Azen S, et al. Effects of corneal thickness, corneal curvature, and intraocular pressure level on Goldmann applanation tonometry and dynamic contour tonometry. Ophthalmology. 2007; 114 (1):20-26 - 82.
Kim SH, Lee EJ, Han JC, Sohn SW, Rhee T, Kee C. The effect of diurnal fluctuation in intraocular pressure on the evaluation of risk factors of progression in Normal tension Glaucoma. PLoS One. 2016; 11 (10):e0164876 - 83.
Hasegawa K, Ishida K, Sawada A, Kawase K, Yamamoto T. Diurnal variation of intraocular pressure in suspected normal-tension glaucoma. Japanese Journal of Ophthalmology. 2006; 50 (5):449-454 - 84.
Renard E, Palombi K, Gronfier C, Pepin JL, Noel C, Chiquet C, et al. Twenty-four hour (Nyctohemeral) rhythm of intraocular pressure and ocular perfusion pressure in normal-tension glaucoma. Investigative Ophthalmology & Visual Science. 2010; 51 (2):882-889 - 85.
De Moraes CG, Jasien JV, Simon-Zoula S, Liebmann JM, Ritch R. Visual field change and 24-hour IOP-related profile with a contact Lens sensor in treated Glaucoma patients. Ophthalmology. 2016; 123 (4):744-753 - 86.
Leonardi M, Pitchon EM, Bertsch A, Renaud P, Mermoud A. Wireless contact lens sensor for intraocular pressure monitoring: Assessment on enucleated pig eyes. Acta Ophthalmologica. 2009; 87 (4):433-437 - 87.
Mansouri K, Weinreb RN, Liu JHK. Efficacy of a contact lens sensor for monitoring 24-H intraocular pressure related patterns. Lin H, editor. PLoS One. 2015; 10 (5):e0125530 - 88.
Mansouri K, Medeiros FA, Tafreshi A, Weinreb RN. Continuous 24-hour monitoring of intraocular pressure patterns with a contact lens sensor: Safety, tolerability, and reproducibility in patients with glaucoma. Archives of Ophthalmology. 2012; 130 (12):1534-1539 - 89.
Holló G, Kóthy P, Vargha P. Evaluation of continuous 24-hour intraocular pressure monitoring for assessment of prostaglandin-induced pressure reduction in glaucoma. Journal of Glaucoma. 2014; 23 (1):e6-e12 - 90.
Lorenz K, Korb C, Herzog N, Vetter JM, Elflein H, Keilani MM, et al. Tolerability of 24-hour intraocular pressure monitoring of a pressure-sensitive contact lens. Journal of Glaucoma. 2013; 22 (4):311-316 - 91.
Tojo N, Abe S, Ishida M, Yagou T, Hayashi A. The fluctuation of intraocular pressure measured by a contact Lens sensor in Normal-tension Glaucoma patients and nonglaucoma subjects. Journal of Glaucoma. 2017; 26 (3):195-200 - 92.
Choritz L, Mansouri K, Van Den Bosch J, Weigel M, Dick HB, Wagner M, et al. Telemetric measurement of intraocular pressure via an implantable pressure sensor—12-month results from the ARGOS-02 trial. American Journal of Ophthalmology. 2020; 209 :187-196 - 93.
Szurman P, Gillmann K, Seuthe AM, Dick HB, Hoffmann EM, Mermoud A, et al. EYEMATE-SC Trial: Twelve-month safety, performance, and accuracy of a Suprachoroidal sensor for telemetric measurement of intraocular pressure. Ophthalmology. 2023; 130 (3):304-312 - 94.
Melki S, Todani A, Cherfan G. An implantable intraocular pressure transducer: Initial safety outcomes. JAMA Ophthalmology. 2014; 132 (10):1221-1225 - 95.
Koutsonas A, Walter P, Roessler G, Plange N. Implantation of a novel telemetric intraocular pressure sensor in patients with glaucoma (ARGOS study): 1-year results. Investigative Ophthalmology & Visual Science. 2015; 56 (2):1063-1069 - 96.
Mariacher S, Ebner M, Januschowski K, Hurst J, Schnichels S, Szurman P. Investigation of a novel implantable suprachoroidal pressure transducer for telemetric intraocular pressure monitoring. Experimental Eye Research. 2016; 151 :54-60 - 97.
Szurman P, Mansouri K, Dick HB, Mermoud A, Hoffmann EM, Mackert M, et al. Safety and performance of a suprachoroidal sensor for telemetric measurement of intraocular pressure in the EYEMATE-SC trial. The British Journal of Ophthalmology. 2023; 107 (4):518-524 - 98.
Meyenberg A, Iliev ME, Eschmann R, Frueh BE. Dynamic contour tonometry in keratoconus and postkeratoplasty eyes. Cornea. 2008; 27 (3):305-310 - 99.
Injectsense. [Internet] 2023. Available from https://www.injectsense.com/technology [Accessed August 15, 2023]