Open Access is an initiative that aims to make scientific research freely available to all. To date our community has made over 100 million downloads. It’s based on principles of collaboration, unobstructed discovery, and, most importantly, scientific progression. As PhD students, we found it difficult to access the research we needed, so we decided to create a new Open Access publisher that levels the playing field for scientists across the world. How? By making research easy to access, and puts the academic needs of the researchers before the business interests of publishers.
We are a community of more than 103,000 authors and editors from 3,291 institutions spanning 160 countries, including Nobel Prize winners and some of the world’s most-cited researchers. Publishing on IntechOpen allows authors to earn citations and find new collaborators, meaning more people see your work not only from your own field of study, but from other related fields too.
We have constructed a highly structured note-taking system that is readily minable because it consists of objective data rather than free text and is free of identifiable, protected health information. Our objective observations automatically enter a backend database collected from patients who have attended our clinic for orofacial pain and oral medicine. We next added two Naive Bayesian algorithms into our encounter process to generate real-time diagnostic suggestions for each patient. The first is a standard Naive Bayesian Inference algorithm that provides the clinician with a dynamic, real-time list of possible diagnoses that the collected data support. The second is a Naive Bayesian Exploration algorithm that provides the clinician with a second list of the critical data that should be collected next to confirm or refute the suggested diagnoses. We are now comparing the algorithm-assisted note-taking system to notes created without the Bayesian algorithms. Our planned outcomes are reduced click burden and concordance between the clinician’s diagnosis and those predicted by the algorithms. This project aims to examine if an algorithm-based clinical decision-support system improves the efficiency and accuracy of the diagnostic process.
Herman Ostrow School of Dentistry, University of Southern California, Los Angeles, California, USA
Anette Vistoso Monreal
Herman Ostrow School of Dentistry, University of Southern California, Los Angeles, California, USA
Nicolas Veas
Herman Ostrow School of Dentistry, University of Southern California, Los Angeles, California, USA
Gerald E. Loeb
Alfred E. Mann Department of Biomedical Engineering, University of Southern California, Los Angeles, California, USA
*Address all correspondence to: gtc@usc.edu
1. Introduction
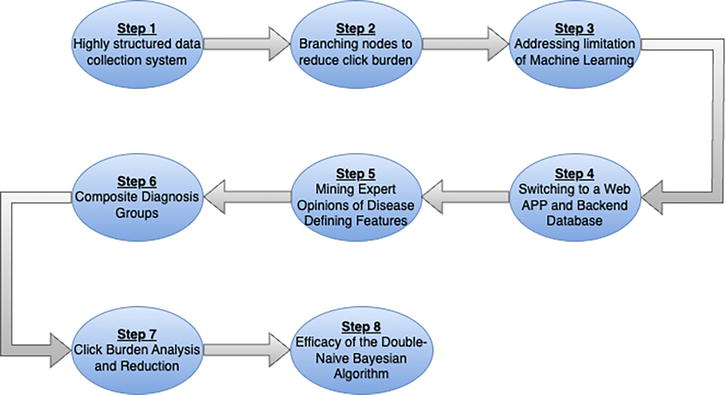
To be useful to a busy clinician, any assistant (machine or human) must be present as decisions are being made, must have access to information that is current, clear and correct, and must provide suggestions (not commands) that are continuously relevant to the unfolding clinical encounter. Unfortunately, so-called diagnostic-assist software to date has been constructed and tested as stand-alone applications into which someone (probably not the busy clinician) curates clinical observations from a completed health record after the fact and then compares the diagnoses suggested by the software to those entered by the clinician [1, 2, 3, 4, 5]. We describe here our journey toward a clinically useful point-of-care system in 8 steps (Figure 1).
Figure 1.
Diagram of the 8-step journey to create a highly structured note-taking system using machine learning and artificial intelligence (ML-AI).
1.1 Step 1. Start with a highly structured data collection system
To create a real-time diagnostic assist tool, you first need accurate clinical data; otherwise, you are dealing with GIGO (garbage in → garbage out). Diagnostic-assist software can be trained on electronic health records (EHRs) of large numbers of patients only if those records are reasonably complete, objective and accurate. A point-of-care diagnostic-assist system can follow a clinical encounter only if the patient’s data are immediately accessible as well as objective and accurate. For this reason, the first step on our journey to assist clinicians in achieving more accurate and efficient diagnoses was to shift our patient encounters from a narrative-style note to a highly structured, check-box-based note. We initially developed this note-taking system – called Smart Note – for the orofacial pain and oral medicine fields in which most diagnoses depend on the details of the clinical history and physical examination rather than specific radiological, histologic, or serological laboratory tests. This note-taking system was designed with multiple pages where a clinician mostly checks YES or NO boxes. It soon became obvious that our system needed some short narrative note fields, making it a hybrid check-box-based note-taking system. This was necessary because no set of checkboxes could anticipate all details of a patient’s story. The clinician user was instructed to keep these narrative notes brief. Currently, the narrative sections of our notes are not used in any algorithmic analysis but are used to fully capture details for the final note placed in the medical record.
Diagnosis of patients in oral medicine is often different from orofacial pain, which is based largely on the medical interview and clinical examination findings. For many oral pathologic entities, a tissue biopsy can be used as a definitive disease biomarker. Still, a biopsy involves expense and delay and will be obtained for only about a third of the oral tissue, infectious and osseous diseases encountered. Another major problem is that many oral tissue and radiologic diseases often do not have patient-based symptoms (e.g., a lucent lesion on a radiograph or a discolored tissue patch in the mouth) and are instead first discovered by a serendipitous clinical examination. In oral medicine, the clinical examination of the lesion’s features rather than the chief complaint or the history of present illness provides key observations that support a diagnosis in non-biopsy cases. For these reasons and our desire to create a valid diagnostic assist algorithmic-driven tool that could be used at the point of care, we decided to create a highly structured note that captured history and examination data. The medical history is often called “subjective” data in the clinical note-taking system with the acronym SOAP (subjective, objective, assessment plan), but it must be reduced to computer-readable (i.e. objective) values. This means that our medical encounter note was populated with predominately Boolean data (YES/NO) and a sparse amount of continuous data as needed. When a definitive diagnostic test is available, the diagnosis at the first encounter is considered a working diagnosis. It is only converted to a final diagnosis and entered into our backend database once confirmed.
The decision to use a check box approach was partly driven by a 2019 systematic review article that examined a set of studies that used natural language processing (NLP) on electronic medical record (EMR) based narrative notes [6]. The study included 106 papers that extracted variable data from narrative notes and then submitted these variables to machine learning (ML) analysis. The ML analyses aimed to find the highly important variables that predicted the outcome of these diseases. To do this, the review first reduced the 43 chronic diseases cataloged in the various articles to a smaller list of 10 disease categories using the International Classification of Diseases, 10th Revision (ICD-10). The authors noted that better results were found only when the clinical records were highly structured. The authors reported that using NLP to examine narrative notes resulted in only a few instances where predictive algorithms worked well, and they suggested that better-structured notes are needed to make text mining with NLP useful.
1.2 Step 2. Branching nodes to reduce click burden
The second step on this journey was to decide where to place our branching nodes. The reason branching nodes are essential with a check-box-based note-taking system is the very real problem of “click burden”. A comprehensive list of all the possible checkboxes needed to capture the medical story and the features that could be checked off during a comprehensive examination is formidable. Each specialty clinic will differ, but in the specialties of Orofacial Pain and Oral Medicine specialty, the number of variables in our Smart Note is now upward of 1500. Because no clinician will check YES/NO for this many variables, logical branching node points were necessary. For example, a branching node would allow the clinician to select the subset of variables appropriate as a follow-up of the patient’s chief complaint or to document a specific examination feature (e.g., the color, margins, or texture of an oral tissue lesion). When the branching path is selected correctly, it also avoids asking questions that are not logical. Elective branching, if done right, prevents the clinician from following a time-consuming, linear lock-step march down the medical records path, collecting hundreds of pieces of information, many of which are of low value. When done incorrectly, this raises the possibility that the clinician will choose the wrong path and not collect crucial disease-defining information. Branching in our system was initially at the clinician’s discretion, but it is sometimes automated via decision trees in other systems. Automated branching trees require substantial time and expertise to develop, are subject to professional disagreements and changing clinical standards, and may need to be overridden based on unusual presentations and/or the subjective judgment of the clinician. To improve the branching process in our Smart Note, as described below, we employed a new algorithm to compute the most promising next observations and present them incrementally as branchpoint suggestions to the clinician during the clinical encounter.
1.3 Step 3. The limitations of machine learning
The third step on our journey was to select a machine learning classification analysis that was logical for our task, which involved small data sets and multi-dimensional classifications. This decision was not easy, and it started with a 2019 article that described our initial attempts to achieve a highly structured, branching, patient encounter note-taking system in a specialty dental clinic [7]. In this article, we examined a variety of ML methods alone and in combination to try to predict our diagnoses. We followed this with another 2021 article describing multiple machine learning analyses, but now on a slightly larger dataset of patient encounters collected with our note-taking system [8]. Finally, with a third article in 2021, we again described our initial efforts to create a highly structured note-taking system. We introduced the concept of using machine learning to create predictive algorithms, and our goal was eventually to add these algorithms into the note-taking system [9]. The largest difference between our first two articles and this third article is that now our dataset contained more variables as we included oral mucosal and osseous diseases in our analysis. All three of these articles employed machine learning classification modeling. Machine learning modeling worked well but only for those orofacial pain-related diagnoses where we had enough cases (n ≥ 100 cases) in the database to train the ML model. This is problematic because our specialty clinic regularly encounters over 341 different diagnoses, some of which occur in our clinic with a prevalence of 1/1000 or even less. The rule of thumb for ML modeling is that you need approximately 100 to 1000 case examples of a diagnosis to adequately train the model [10]. Even though we increased the database size, only five diagnoses met this requirement for a predictive machine learning-based algorithm. To gather enough cases to perform a robust ML analysis on these rare cases, we calculated that we would need close to 100,000 patient encounters. For all the above reasons, we gave up on more traditional machine learning methods and elected instead to use supervised Naïve Bayesian Inference modeling (described below). We are now using this algorithm at the point of care based on over 1500 cases in our database collected with Smart Note.
Of course, machine learning modeling is a powerful tool if you have a very large dataset of accurate data. You can then use it to find the variables of importance and then build an algorithm with these variables. Unfortunately, machine learning is not usually dynamic because its computational burden for training is very large. Machine learning models also only sometimes provide predictions at the point of care, and while it can be updated regularly, it is not generally auto-adapting as new EHRs are added. One example of the value of machine learning analysis of EMR data is a 2022 study [11]. These authors focused their research of what drug produces the best outcome in the management of diabetes mellitus. The authors started with 971,401 drug usage records, and within these records, they discovered 51,009 patients with DM. The analysis included variables such as demographics, visits, and all medication features and tests results. They used a random forest regression modeling to identify features and to see which medication produced the best outcome for these diabetes mellitus patients. After data cleaning, the data included 8729 male and 9115 female cases. They discovered that Metformin medication resulted in the lowest HbA1c score. Less effective drugs were glimepiride, acarbose, pioglitazone, gliclazide, glibenclamide, repaglinide, nateglinide, sitagliptin, and vildagliptin use. They suggested that this analysis and subsequent ranking of medications would help physicians’ decision-making. Unfortunately, the Chien et al., 2022 study is relatively rare as it did have a large dataset of medications prescribed and recognized disease-defining laboratory tests (i.e., HbA1c) that measures the efficacy of the medication.
This combination of large dataset and a simple question is rare. Another 2022 article opined on when an algorithm-supported, clinical decision-making system would be readily available in pediatrics [12]. These authors suggested that a narrow AI or algorithm based CDS system certainly has the potential to help in the diagnosis and treatment planning of pediatric patients, but to achieve this goal, a very large dataset will be needed before machine learning analysis can be conducted. The authors summarized by saying that, at present, a ML-based clinical decision support tool in pediatrics is largely unrealized to date. For all the above reasons, and some we describe in the next paragraph, we elected to use Naïve Bayesian Inference analysis in our highly structured note-taking system.
First, we must consider the completeness of critical data because no algorithm can generate an accurate prediction if the disease-defining critical data elements for a diagnosis are missing. Faced with time constraints, some clinicians may jump to a diagnosis based on only a few clinical observations. This rush to judgment is a major reason for misdiagnoses [13]. Critical data may be missing even if the critical observations were obtained because the data entry system is awkward to use. The issue of missing critical data was examined in a 2017 article on the influence of EMR software design on the diagnosis of dry eye syndrome [14]. The authors selected 30 “critical variables” based on the American Academy of Ophthalmology’s authoritative report on dry eyes. They then analyzed charts of 331 patients examined by residents with varying experience (Year 1, Year 2, Year 3) in the ophthalmology clinic for dry eye syndrome, looking for these 30 variables. They discovered that, on average, these records only contained 67.4 to 73.6% of what they considered critical data. After careful analysis, the authors concluded it was not the experience of the clinician but the design of the electronic health record template that influenced the documentation rate of critical data. Moreover, they blamed “click fatigue” as the main culprit causing the missing data.
Natural Language Processing (NLP) software promises to extract objective data from free-text narrative notes. One recent test of this approach collected millions of deidentified patient encounter records containing billions of words and phrases in the corpus [15]. The authors examined the accuracy of an artificially intelligent, large language model (GatorTron-Large, similar to ChatGPT) and compared it to other biomedical text-mining systems. They demonstrated that the large language model increased the accuracy of the extracted features (between 7–9%), compared to other text mining NLP models. This type of work represents a potential improvement in NLP analysis, but extracting critical features is only the first step. The second step involves creating a list of critical data features associated with a desired outcome and creating a validated predictive algorithm. To truly be useful, the algorithm must then be tested at the point of point-of-care because analysis done on a large corpus of retrospective data demonstrates only the feasibility of a method. It does not prove its validity as a clinical decision support system used to suggest a diagnoses or best treatment approaches during clinical encounters. This is still a huge challenge and will always be problematic if there are missing, ambiguous, or inaccurate data in the target patient’s narrative note. Google’s head scientist Peter Norvig has commented on this, stating that “More data beats clever algorithms, but better data beats more data” [16].
3. Predictions are easier if you have only one end-point
A unidimensional analysis, such as finding what medication best lowers HbA1c, is much easier than asking an algorithm to distinguish among hundreds of medical disorders. The latter is called multi-dimensional analysis. The problem is that with more dimensions, the required size of the database grows exponentially. If anyone tried to create a comprehensive algorithm that could distinguish every diagnosis in the current International Classification of Disease (ICD-10), this would involve about 12,000 diagnoses, and there are well over 5000 history, physical, and test items that might be collected [17]. This produces a matrix with 60 million cells or dimensions. As the number of dimensions increases, the amount of training data required for deep-learning neural networks to make accurate predictions increases exponentially. This problem is called the curse of dimensionality [18]. As we stated earlier, our answer to this dilemma was to implement a point-of-care Naive Bayesian Inference algorithm on incremental collection of discrete, objective observations rather than using machine learning classification analysis based on all keywords extracted by NLP from narrative notes. A Naive Bayesian Inference analysis of EHR data proceeds incrementally as each new datum is input. It is thus naturally suited to providing real-time diagnostic suggestions as the clinical interaction unfolds. As new EHRs become available, it is relatively simple to update the Bayesian probabilities, whereas retraining a neural network is extremely computationally intensive. This incremental approach appears to overcome the curse of dimensionality, enabling a solution for our specialty clinic that must deal with many diagnoses, each with a relatively low number of case examples.
3.1 Step 4. Switching to a web APP and the backend database
The fourth step in our journey involved converting our customized note-taking system, built initially using Microsoft Access database software, to a web APP linked to a SQL backend database. A web APP affords clinicians easy access to our note-taking system without installing or maintaining a database program on their local computer. Moreover, the Naive Bayesian Inference diagnostic classification algorithm was ideal for our note-taking system, providing predictive analysis with a much smaller backend dataset. Some limitations remain, however. Rare diagnoses with few cases in the database may not be suggested when appropriate. Recently added observations with few instances in the database may result in inappropriate suggestions. Both of these should be mitigated as new cases are added automatically to the database, but we still need data on how many such cases and instances are required. Nevertheless, we describe below that the Naive Bayesian Inference algorithm we have implemented can predict the expert’s true positive working diagnosis at the point of care as data are collected. We are using this version of Smart Note in the OFPOM Center of the University of Southern California, where our backend database grows automatically as about 1000 new patients added per year.
3.2 Step 5. Mining expert opinions of disease to identify disease defining features
The fifth step of our journey was ensuring our note-taking system had enough disease-defining variables to allow our algorithm to parse efficiently one diagnosis from another. Currently, expert opinion-based descriptions of diseases form the core of the knowledge a clinician needs to diagnose. These expert opinions are found in textbooks and descriptive articles, but few of these literature sources describe a validated list of variables created using statistical analysis. We aimed to mine these expert descriptions and convert them into a set of Boolean (YES/NO) choices that could be discovered during a medical interview and physical examination conducted at a first patient visit (Table 1). We began by examining textbooks and published case series to find additional disease-defining signs and symptoms. Once cataloged, we then added these features to our check-box system when not redundant. For diseases with enough case examples of a diagnosis, we then examined the data to generate an actual critical data list for our various diagnoses. Our criteria for being a critical data feature was that it had to be present at the rate of at least 50% of the time or higher whenever the expert selected the diagnosis. As expected for Bayesian Inference, if the critical data items that we extract for one diagnosis are common to multiple other diagnoses, then those data items fail to distinguish among those diagnoses. The algorithm works best when a few of the history or examination features are unique or “disease-defining” features. Because Naïve Bayesian modeling is not a black box system, we can examine the algorithm when it underperforms and add, if we can find them, additional features that tune and improve the algorithm. Another immediate application for a critical data list will be to supplement and, ideally, to validate, replace and/or refine the expert opinion descriptions used in our existing Orofacial Pain and Oral Medicine disease classification systems.
Expert Opinion descriptors
Derived Boolean (YES/NO) Descriptors
3 attacks of unilateral facial pain in a trigeminal dermatome
HPI-Nerve Disorder: severity (0–10)
Attack duration should be between 1 second to 2 minutes
HPI-Nerve Disorder: Pattern—Intermittent
Pain attack should be of a severe intensity
HPI-Nerve Disorder: Frequency—several times a day
Pain character should be either electric, Shooting, Stabbing or Sharp
HPI-Nerve Disorder: Duration—Seconds/Minutes
At least 3 pain events should be triggered by innocuous stimulation
HPI-Nerve Disorder: Onset—months ago
No clinically evident neurologic deficit
HPI-Nerve Disorder: Character—electric
No persistent pain between attacks
HPI-Nerve Disorder: Location—Unilateral
Not better accounted for by another ICHD diagnosis
HPI-Nerve Disorder: Other feature questions:
Q: Does the patient have episodic brief electric-like pains in the jaw or face?
Q: Does the patient get brief electric-like pain and are they triggered by light touch or movement of the jaw or tongue?
Q: Does the patient have brief (<20 seconds) pain attacks?
Q: Does the pain attack locate predominately to the V1, V2 or V3 dermatome area?
Table 1.
Comparison of trigeminal neuralgia phenotype based on expert opinion [19] and derived Boolean features in smart note (SN).
One advantage of a critical data list is that it does not have to be static. Each new case added to the dataset can automatically update the list of critical observations. Such an auto-evolving critical data list can identify which elements are missing in a given EHR according to the current standard of care. This can provide feedback for residents-in-training. For the practicing clinician using our note-taking system, we believe we can automatically provide a list of “missing critical data” after the clinician selects a diagnosis. With the new Naïve Bayesian Exploration algorithm (described below) we can actually provide this list before the clinician selects their final diagnosis. With audits and calibration training, instances of missing critical data are expected to decline as we tune our algorithms. No system works well without training, calibration, a clear list of disease-defining variables, and auditing for the presence or absence of these variables is needed. As our clinicians gain familiarity with the process and we audit and provide feedback on their notes, their performance is expected to improve. Knowing the key questions to ask or the critical examination elements to perform defines an expert diagnostician and assures the quality of the continually growing backend database.
3.3 Step 6. Composite diagnosis groups
The sixth and highly important step in our journey was to reduce the number of target diagnoses by combining, where it was logical, similar diagnoses into a composite diagnostic category. For example, the diagnosis of temporomandibular joint arthritis has an ICD-10 diagnostic code (ICD-10-CM #M26.43). This code has 4 subcategories with a separate ICD code number for right, left, bilateral and unspecified TMJ Arthritis. From the features collected on a medical interview and from data collected during a clinical examination, it is possible for an expert to distinguish between these different forms of TMJ arthritis. However, we determined that it would be logical and algorithmically easier to combine all TMJ arthritis as a single category (i.e., arthritis of unspecified temporomandibular joint location). This makes it easier to predict this diagnosis as we have more case examples and while it does combine the right, left or bilateral forms of this disease into a single diagnosis, this is not problematic as far as we can tell. This compositing process was performed for multiple diseases in Orofacial Pain, and it reduced the outcome from 124 individual diagnoses to 72 composite groups. Compositing was also done for our Oral Medicine diseases, and it reduced the outcomes from 217 to 77. At present, we have now reduced the predicted categories seen in our clinic from 341 down to 149.
3.4 Step 7. Click burden analysis and reduction
The above journey led us to create a note taking system in which clinician users had to learn to navigate efficiently through a very large set of possible observations. This required our users to learn both which observations might be relevant to an as-yet undetermined diagnosis, as well as the location of those observations in our growing note-taking system. The resulting click-burden and navigation dilemma seemed likely to increase the omission of clinically important data and increase the amount of training required by new users. We were additionally concerned that a large list of Boolean observations would also be problematic if our approach were to be extended to other areas of medicine (e.g., internal medicine or neurology) that encounter more diagnoses with many more history and examination features to record. Therefore, the seventh step on the journey was to incorporate a second Naive Bayesian style algorithm that suggests an efficient path through those observations that is tailored to each patient’s differential diagnosis. The new algorithm is unique in that it uses the predicted diagnoses from the Naive Bayesian Inference algorithm and suggests an ever-adapting set of missing data that the clinician should consider collecting. This algorithm was first successfully used in robotics to rapidly and accurately identify objects based on their haptic properties [20]. Specifically, the authors dubbed this new algorithm “Naive Bayesian Exploration”. They used it to decide which tactile sensory data from which exploratory robotic movement would provide the most useful information at each point in this incremental process. Because it was based on a Naive Bayesian process, the tactile sensory data collected were compared to previous experience with identified objects in a backend database. The article showed that the system had high discrimination accuracy and high efficiency when comparing similar objects, and it exceeded human capabilities at the same task. The authors suggested that their Naive Bayesian Exploration process could generalize well to other cognitive problems. In a subsequent article, one of those authors and this chapter (GEL) described how this algorithm could play a key role as a decision-support tool for clinical diagnosis [21].
Recent work has shown the potential of using a Naive Bayesian Inference algorithm to classify and predict a single diagnostic outcome [22]. Specifically, in 2023, an article compared four machine learning models that attempted to achieve early prediction of acute respiratory distress syndrome in a set of patients with acute pancreatitis. This was done because acute respiratory distress syndrome (ARDS) is a common complication of acute pancreatitis (AP) and is associated with high mortality. The authors analyzed data from 460 patients with acute pancreatitis, of whom 83 developed ARDS. The four machine learning models they compared were Support Vector Machine (SVM), Ensembles of Decision Trees (EDTs), Naive Bayesian Classifier (BC), and nomogram models. The Naive Bayesian classification model had a slightly better predictive performance and gave the highest area under the curve score (AUC = 0.891) for predicting ARDS.
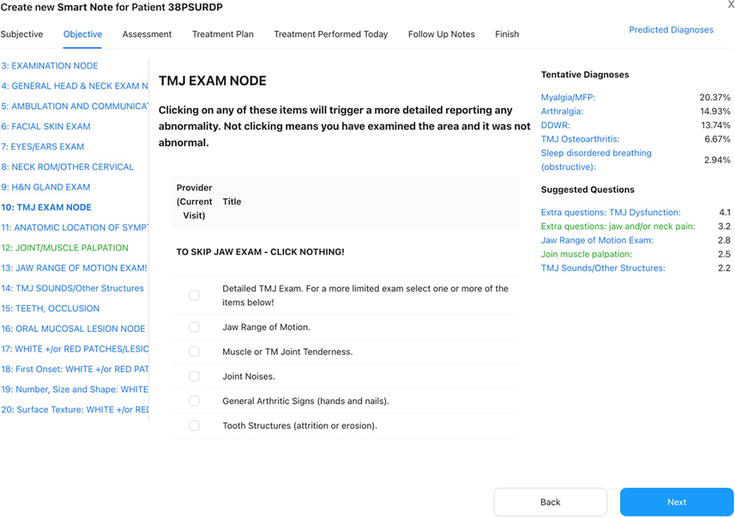
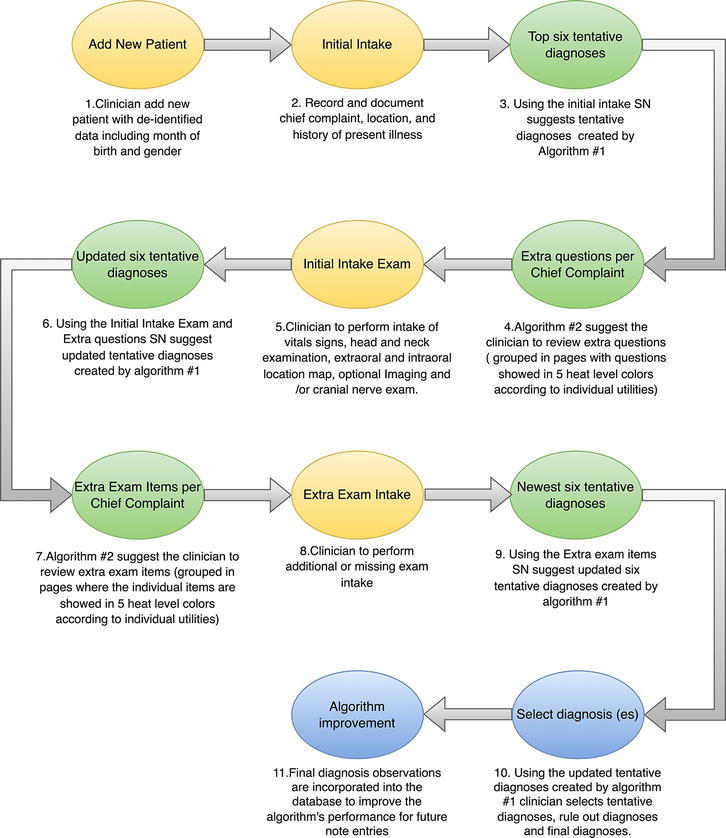
Our Smart Note application is very different because it requires likelihood predictions from many potential diagnoses and this is more difficult than predicting a single adverse outcome. Rather than picking a few observations with high predictive value, our general diagnostic system requires complete and accurate data for many different subsets from a large set of possible observations. This is unlikely to obtain if clinicians face a high click burden that leads them to navigate poorly or resort to subjective free-text data entry because it is faster. If the note-taking system can suggest which of our structured observations are likely useful at each point in the diagnostic work-up, the click burden could be greatly minimized while reducing the incidence of incomplete or uninterpretable health records. This led us to combine Smart Note with an iterative, alternating application of Naive Bayesian Inference (algorithm #1) and Naive Bayesian Exploration (algorithm #2), as previously suggested. At each step in the work-up, Naive Bayesian Inference operates on the currently available data to determine the current probabilities of all potential diagnoses, followed by Naive Bayesian Exploration to compute the utility of all possible next steps in the workup. The current version of Smart Note continuously provides the clinician with short lists of the most likely diagnoses and the most useful next observations, each of which can be selected with one click (Figure 2). After the new data are entered, the process is iterated until the clinician accepts a diagnosis as final. These observations are incorporated into the database to improve the algorithm’s performance for future note entries (Figure 3). We are now actively tracking click counts when the note-taking system is used with and without these algorithms.
Figure 2.
SmartNote page for patient 38PSURDP (test patient) shows the tentative diagnoses list (myalgia/MFP [myofascial pain], arthralgia, DDWR [disc displacement with reduction], TMJ [temporomandibular joint] osteoarthritis and sleep disordered breathing) with their respective probability, and suggested questions (in green are the pages the clinician has already visited) shown in descending order of importance for discriminating among the list of tentative diagnoses.
Figure 3.
Flow chart of the smart note (SN) process from adding new patient information to selecting the tentative and final diagnoses.
4.1 Step 8. Efficacy of the double naive Bayesian algorithm approach
The last step in our journey will be to examine the efficacy of what we have developed. Specifically, we have proposed that an iterative combination of Naive Bayesian Inference and Naive Bayesian Exploration algorithms used within a highly structure note-taking system will add value and expedite the medical note-taking process. However, with any proposed new methodology, it is necessary to demonstrate efficacy according to objective outcome measures, to determine the cost/benefit of the new system and to assess its potential to generalize to other applications. That requires a backend database containing patient examples for most, if not all, of the clinic’s diseases, which we are still building. It can then be tested for those diagnoses that have enough examples in the database to build, train and test the above algorithm.
Our plan to examine efficacy is to divide our dataset into two parts: a training set consisting of 85% of the available patient records and a test set consisting of the remaining 15% from which we simulated new clinical encounters. The primary outcome to be assessed is a count of how many of our expert’s diagnoses in each test record were found in the top six predicted diagnoses after entering data in the test records. This outcome was selected because the goal of our predictive model is not to replace the clinician but to assist the clinician, especially novices who may overlook some diagnoses or fail to recognize the relevance of some observations to them. A perfect alignment would be when a patient has 2 or 3 diagnoses, and they all are within the list of the top six predicted diagnoses generated by our algorithm. With each prediction failure, an analysis of why it failed is critical. The failure reasons are several, including: (1) Operator Error: missing critical data in encounter note; (2) Operator Error: did not choose a diagnosis that the actual data supported; (3) Inadequate Database: no disease defining variables for a diagnosis have yet been identified or collected; and (4) Inadequate Database: too few case examples to create a valid list of critical data features for a diagnosis.
One secondary outcome is click burden—the number of clicks and webpages visited to complete an encounter note. We expect that the click burden to reach a definitive diagnosis will be reduced when using our Naive Bayesian-assisted note-taking system compared to the number of clicks used when these algorithms are unavailable. We are also tracking the presence or absence of critical data elements in the encounter note. As we have explained, critical data are those variables that have a high frequency (> > 50%) of “YES” occurrences for a specific diagnosis. The percentage of critical data obtained and recorded should be at least as high or higher than when an expert clinician creates a note without the embedded assist algorithms. We are tracking these outcomes and will report on them in the future. If these outcome measures indicate success in our limited clinical field, this will justify the considerable effort required to extend it to other clinical practices with different types of observations and many more potential diagnoses.
Our algorithm-enhanced note-taking system is still undergoing design changes to enhance the intuitive usability of its interfaces with the clinician. We will need more cases in our backend database to identify and differentiate many of the less frequent diseases, disorders, dysfunctions and their presentations as we attempt to diagnose in our specialty clinic. Currently, we only have 1500 first-visit encounters documented. For those patients with orofacial pain-related problems, we only have 35 out of 72 possible composite diagnoses with enough exemplar cases to build a critical data list. For those patients with an oral mucosal or osseous disease, we have only 40 out of 75 composite diagnoses with enough exemplar cases to build a valid list of critical data. To establish a reasonable critical data list probably requires at least 5 to 10 cases per diagnosis, and every case needs one or more disease-defining features. Moreover, you need an above 90% level for critical data to have an accurate algorithm. The smart note system we are working with currently has 341 possible individual diagnoses and 149 composite diagnoses. When we conducted our analysis, our backend dataset had 1406 new patient cases. We selected 15% of our backend database cases to test our algorithm on (211 cases with 413 diagnoses). In this test set, only 41.1% (63/153) have greater than or equal to 5 cases per diagnosis. Nevertheless, we report here that the Naive Bayesian Inference algorithm we use correctly predicted 293 of the 413 (70.9%) of the expert’s selected diagnoses. The number of test cases where 1 or more of the expert’s diagnostic choices was in the Naive Bayesian inference algorithm’s top 6 list occurred for 168 out of 199 possible times (84.4%). As we have not fully implemented the Naive Bayesian exploration algorithm, we do not yet have data on click-burden or the rate of critical data missing in the clinician’s note.
6. Conclusions: do algorithmic predictions add value to the clinician?
The Naive Bayesian Smart Note we are developing is intended to be a diagnostic assist tool rather than a generator of definitive diagnoses. Some of its predictions would be obvious to an experienced clinician but may still be of value for a trainee. Some of its predictions and recommendations are nonsensical (particularly when dealing with rare diagnoses and atypical presentations or diagnoses for which we have not yet defined and entered critical history and examination features); these need to be ignored. One surprising value was that visualizing the evolution of the differential diagnosis according to Naive Bayesian Inference gives the clinician unique insight into the relative importance of each data point. According to Naive Bayesian Exploration, this awareness, plus the recommendations for the next observations should improve the quality of the records that go into the database. We anticipate that the Naive Bayesian Smart Note will improve as we add high-quality clinical records and tune the set of possible observations. We predict that we will need over 10,000 cases in our clinic’s backend dataset, probably supplemented with hand-picked cases of rarer diagnoses. Even without the algorithms, Smart Note generates excellent quality encounter notes that are highly structured with a reasonable click burden for clinicians who have learned to navigate efficiently through its many pages for data entry. Such objective clinical records are easily auditable both at a quick glance by an expert and by automatically reporting on missing critical data. With the addition of the second algorithm for Naive Bayesian Exploration, we will evaluate if this reduces the click burden with a much shorter learning curve. Our goal now is to provide a note-taking system that motivates clinicians to collect objective and high value data because it has the potential to improve both the efficiency and accuracy of their diagnostic process at the point-of-care. As high-quality data are added to the self-curating database, its scope and utility should improve, forming a virtuous cycle.
1.Vardell E, Bou-Crick C. Visual Dx: A visual diagnostic decision support tool. Medical Reference Services Quarterly. 2012;31(4):414-424. DOI: 10.1080/02763869.2012.724287
2.London S. DXplainTM: A web-based diagnostic decision support system for medical students. Medical Reference Services Quarterly. 1998;17(2):17-28. DOI: 10.1300/j115v17n02_02
3.Vardell E, Isabel MM. A clinical decision support system. Medical Reference Services Quarterly. 2011;30(2):158-166. DOI: 10.1080/02763869.2011.562800
4.Lemaire JB, Schaefer JP, Martin LA, Faris P, Ainslie MD, Hull RD. Effectiveness of the quick medical reference as a diagnostic tool. CMAJ. 1999;161(6):725-728
5.Warner HR, Haug P, Bouhaddou O, Lincoln M, Warner H Jr, Sorenson D, et al. ILIAD as an expert consultant to teach differential diagnosis. Proceedings of the Annual Symposium on Computer Applications in Medical Care. 9 Nov 1988:371-376
6.Sheikhalishahi S, Miotto R, Dudley JT, Lavelli A, Rinaldi F, Osmani V. Natural language processing of clinical notes on chronic diseases: Systematic review. JMIR Medical Informatics. 2019;7(2):e12239
7.Vistoso A, Nocera L, Clark GT. Achieving an electronic health record in a specialty dental clinic to obtain real-time information with well-documented clinical-making accurate decisions. In: INTED2019 Proceedings. 2019. pp. 4742-4747
8.Nocera L, Vistoso A, Yoshida Y, Abe Y, Nwoji C, Clark GT. Building an automated orofacial pain, headache and temporomandibular disorder diagnosis system. American Medical Informatics Association Annual Symposium Proceedings. 2021;25(2020):943-952
9.Vistoso Monreal A, Veas N, Clark G. An artificially intelligent (or algorithm-enhanced) electronic medical record in orofacial pain. Japanese Dental Science Review. 2021;57:242-249
10.Vabalas A, Gowen E, Poliakoff E, Casson AJ. Machine learning algorithm validation with a limited sample size. PLoS One. 2019;14(11):e0224365
11.Chien TY et al. A clinical decision support system for diabetes patients with deep learning: Experience of a Taiwan medical center. International Journal of Medical Sciences. 2022;19(6):1049-1055
12.Ramgopal S, Sanchez-Pinto LN, Horvat CM, Carroll MS, Luo Y, Florin TA. Artificial intelligence-based clinical decision support in pediatrics. Pediatric Research. 2023;93(2):334-341
13.Clark BW, Derakhshan A, Desai SV. Diagnostic errors and the bedside clinical examination. The Medical Clinics of North America. 2018;102(3):453-464
14.Rodriguez Torres Y, Huang J, Mihlstin M, Juzych MS, Kromrei H, Hwang FS. The effect of electronic health record software design on resident documentation and compliance with evidence-based medicine. PLoS One. 2017;12(9):e0185052
15.Yang X, Chen A, Pour Nejatian N, Shin HC, Smith KE, Parisien C, et al. A large language model for electronic health records. npj Digital Medicine. 2022;5(1):194
16.Halevy A, Norvig P, Pereira F. The unreasonable effectiveness of data. Intelligent Systems, IEEE. 2009;24(2):8-12
17.World Health Organization, editor. ICD-10: International Statistical Classification of Diseases and Related Health Problems: Tenth Revision. 2nd ed. Geneva, Switzerland: World Health Organization; 2004. Available from: https://apps.who.int/iris/handle/10665/42980
18.Karanam S. Curse of Dimensionality — A “Curse” to Machine Learning. Towards Data Science; 2021. Available from: https://towardsdatascience.com/curse-of-dimensionality-a-curse-to-machine-learning-c122ee33bfeb
19.de Leeuw R, Klasser GD, American Academy of Orofacial Pain. Orofacial Pain: Guidelines for Assessment, Diagnosis, and Management. 7th ed. Batavia, United States of America: Quitessence Publishing Co Inc.; 2023. p. 126
20.Fishel JA, Loeb GE. Bayesian exploration for intelligent identification of textures. Frontiers in Neurorobotics. 2012;18(6):4
21.Loeb GE. A new approach to medical diagnostic decision support. Journal of Biomedical Informatics. 2021;116:103723
22.Zhang M, Pang M. Early prediction of acute respiratory distress syndrome complicated by acute pancreatitis based on four machine learning models. Clinics (São Paulo, Brazil). 2023;3(78):100215
Written By
Glenn Clark, Anette Vistoso Monreal, Nicolas Veas and Gerald E. Loeb
Submitted: 19 July 2023Reviewed: 15 October 2023Published: 18 December 2023