
Abstract
Rainfall isotopic composition has been continuously monitored at the central portion of the São Paulo state (Brazil) in different sampling time scales since 2013. The integration of different meteorological data, such as surface data from meteorological stations, HYSPLIT trajectories, reanalysis and ERA-interim data, has led to observed different conclusions based on the isotopic observation time scale. The amount effect in tropical areas is important for isotopic monthly data, explaining classical effects on monthly data, such as seasonality (high (low) isotopic composition during the dry (wet) period). Based on a daily scale, the interpretation is more complex, leading to controls on isotopic composition related to moisture source/transport and convective activity, as well as some local factors. Using microrain radar with GOES-16 imagery to identify the rainfall type, we were able to understand the cloud microphysics and sub-cloud processes responsible for rain isotope composition variation during the event. This combination of isotopic data may provide substantial subsidies and information for coupling isotopic data in GCMs. The incorporation of water isotopes into GCMs has enabled a more comprehensive evaluation of the water cycle and improvements in hydrometeorological simulations. This contribution has provided new insights into present, past, and future climate.
Keywords
- stable isotopes
- rainfall
- Brazil
- and rainfall isotopic long-term monitoring
- GNIP
1. Introduction
The temporal and spatial monitoring of the atmosphere, ocean, and land surface has evolved rapidly in recent decades due to the technological revolution [1, 2], developing the World Weather Watch Global Observing System (GOS) [3]. The GOS has contributed to the understanding of climate phenomena, generating quality data that allows atmospheric scientists to measure, estimate, model, and unravel the past and project the future of the Earth’s climate. Among the range of knowledge about climate produced in recent decades, it has been highlighted that man has become a direct agent of meteorological processes, promoting climate change [4].
The perception of extreme and harmful events in our daily lives has become increasingly pronounced due to ongoing changes. It is possible to gauge the occurrence of these extreme weather events on a global scale through the maintenance of the GOS, as reported by the World Meteorological Organization (WMO) [5]. According to the WMO, between 1970 and 2019, there were more than 11,000 disasters attributed to climate and water hazards, which accounted for just over 2 million deaths and US$3.64 trillion in losses [5]. Assessments like this one become possible not only by improving the quality of meteorological data using technologies but by maintaining them over time, allowing comparison with information from the past.
Centuries-old surface weather stations (https://public.wmo.int/en/our-mandate/what-we-do/observations/centennial-observing-stations) are a clear example of the importance of long-term observations, constituting the backbone of global meteorological coverage, serving as a basis for climatology and weather forecasting studies, as they allow an incisive assessment of climate variability.
Another incisive example of long-term monitoring also encouraged by the WMO in partnership with the International Atomic Energy Agency (IAEA) was the creation of the Global Network of Isotopes in Precipitation (GNIP) (https://www.iaea.org/services/networks/gnip). The GNIP was created with the initial objective of monitoring the concentrations of tritium (3H – radioactive isotope) in the atmosphere, produced by nuclear tests during the interwar period. Later, stable isotopes of rainwater, oxygen (18O, 17O, 16O), and hydrogen (2H, 1H) also became part of the monitoring scope, which began in the 1960s. Presently, GNIP has a monthly, online, and free database of the isotopic composition of precipitation and monthly meteorological data (precipitation and temperature) from more than 1200 stations installed in ~100 countries around the world. This database has been widely used in studies on global climate, meteorology, ecology, and hydrology, contributing to verifying and improving climate models, and hydrological models, involving surface water and aquifers at different spatial scales.
In Brazil, 28 GNIP stations were installed and rain samples were collected between 1957 and 1990 [6]. Despite having different objectives, these stations generated results from the first isotopic studies in the national territory, with emphasis on studies carried out in the Amazon, with the aim of understanding the role of the forest in generating humidity and its influence on the local hydrological cycle. Unfortunately, this effort has been discontinued, generating a large gap in isotopic data, consequently on part of the understanding of the movement of water in several hydrographic basins and its relationship with atmospheric processes. Only in 2008, a new NGIP was installed in Brazil, in the city of Belo Horizonte, followed by Rio Claro (2013), both in the southeastern region of the country. The Geological Survey of Brazil (SBG-CPRM) and the National Water Agency (ANA), with the support of the IAEA, resumed the operation of a monthly monitoring network of the isotopic composition of rainfall in several regions of Brazil, contributing to subsidize several hydrogeological studies in the future.
There is no way to project the future without assessing the past, so this present gap in monitoring the isotopic composition of rainwater, rivers, and aquifers has impaired an integrated assessment of atmospheric and hydrological processes in Brazilian watersheds, especially in the context of climate changes. Despite climate change being named as global, it is in the local context of each river basin that the main changes in the hydrological cycle are effectively felt. Understanding how these local hydrological changes are related to atmospheric processes of different temporal and spatial scales requires the use of tools capable of promoting this integration, and hence the great differential and applicability of the use of stable isotopes of water [7, 8]. For this assessment to be able to indicate what changes have been taking place over the years, long-term monitoring is essential.
In addition to the importance of stable isotopes for understanding hydrological studies, the implementation of water isotopes in General Atmospheric Circulation Models gives confidence to climate projections, as it represents physical–chemical processes without the need for large parameterizations and is perhaps one of the most useful for understanding climate processes on a global scale, involving precipitation and atmospheric circulation regimes [9].
In this context, the development, evolution, and current status of monitoring the isotopic composition of rain at the Rio Claro GNIP station (code: 8374701), operating from February 2013 to the present date, will be presented, revealing its contribution to the understanding of the atmospheric processes of the present climate. During this collection period, several atmospheric phenomena occurred and contributed to the formation of rain and changes in Rio Claro weather. Among these phenomena, some examples, such as the influence of El Niño-Southern Oscillation events during different periods in its warm phase (2014–2016, 2018–2019) and cold phase (La Niña, 2016, 2016–2017, 2020–2021, 2021–2023) according to the ONI-INDEX, extreme events related to hailstorms [10], above-average daily volume (~100 mm/day) and decreased rainfall for a period of extreme drought [11].
The observation of these and other atmospheric rainfall systems and their relationship with the isotopic composition of water was only possible due to continuous and long-term monitoring carried out with the monthly sampling (a monthly composite sample collected on the first day of every month at 12UTC) and with daily collection (e.g., a sample collected between 12:00 UTC on the 9th and 12:00 UTC on the 10th) started in February 2014. Subsequently, seeking to expand the assessment of the isotopic composition of rain, a collection was carried out at high frequency (in minutes, also named intra-event) to assess isotopic evolution during the passage of an individual rainfall event.
Thus, combining different sampling time scales with meteorological data of different spatial and temporal resolutions, the main objective of this book chapter is to share how isotope monitoring at different collection scales contributes to the understanding of the meteorological processes related to rain. Two questions serve as a basis for determining the proposed objective: (i) How has monitoring evolved over time? (ii) What was revealed by each type of collection? In order to present this contribution, this chapter is subdivided into two sections: Section 2 presents the basic concepts about stable isotopes and their application in rain; Section 3 presents the comparison of the main interpretations of meteorological controls on isotopic composition between monthly, daily, and high-frequency collection scales; Section 4, discuss how and why the monitoring of the isotopic composition of rain was carried out at different collection scales; and finally the last section, where the main conclusions are presented.
2. Deciphering the history of water with stable isotopes
The word isotopes originated from the Greek: Iso “equal,” topes “place,” means that atoms occupy the same place, that is, the same position in the periodic table, being constituted of a different number of neutrons, therefore of different masses, resulting in molecules made up of “light” and “heavy” atoms. Considering the water molecule, called isotopologues, the stable isotopes of hydrogen (H) and oxygen (O) most used in atmospheric and hydrological sciences are 1H (light) e deuterium (D) or 2H (heavy), 16O (light) e o 18O (heavy), respectively [12, 13].
As the measurements of the amounts of these isotopes are not absolute, but represent the ratio between the least abundant isotope (heavy) over the most abundant (light), (for more details on the isotopic abundance see [12, 13]) the notation δ is used, expressed in parts per thousand (‰) and a reference standard for comparison (the δ of a sample collected in a given location is compared with this reference standard). The most used reference standard is the Vienna Standard Mean Ocean Water—VSMOW (Eq. (1)), which represents the average isotopic composition of ocean waters. Thus, positive values of δ indicate isotopic ratios that exceed the VSMOW and negative values of δ indicate ratios lower than the VSMOW [12].
Throughout the hydrological cycle, from the process of evaporation of water molecules in the ocean (the main source of moisture in the world) to the formation of rain on the continents, where water molecules reach the earth’s surface, recharging rivers, soils, and later aquifers, several water phase change processes modify the ratio of light and heavy isotopes in the water molecule. The physical-chemical process responsible for the partitioning of isotopes during water phase changes is called isotopic fractionation [12, 13, 14, 15], forming distinct water molecules, which vary spatially and temporally, registering an unique isotopic signature, functioning as a “fingerprint” about the paths taken throughout this cycle, which makes it possible for scientists to tell the story of water.
In relation to precipitation, there are two types of fractionation that directly affect the isotopic composition of rainfall: (a) equilibrium fractionation, related to preferential exchanges that different substances have for a given isotope (occurs during the process of condensation inside clouds, formation of ice and rain droplets) [7, 16, 17, 18] and (b) kinetic or nonequilibrium fractionation, related to different rates of reaction between molecules (occurs in evaporation, isotopic exchange with surrounding vapor and reevaporation of drops in the rain) [17, 19].
In isotope studies of rain, relative terms, enriched and depleted, are generally used to denote whether the heavy isotope content is higher (rich in heavy isotopes) or lower (poor in heavy isotopes), respectively. In this sense, when water evaporates from the ocean, molecules with lighter isotopes (1H216O) tend to evaporate and form water vapor, depleted in heavy isotopes compared to the water that gave rise to it. Conversely, when it rains, molecules with heavier isotopes tend to precipitate (1HD16O e or 1H218O), forming an isotopic composition enriched in heavy isotopes [7, 12].
This difference between light and heavy water is mainly determined by the amount of fractionation that a given portion of steam suffered, generated rain and interacted with the surface, consequently with new processes of evaporation, evapotranspiration, and subsequent condensation, from its origin (source area) to the location where rainwater was collected. Thus, the isotopic composition of rain will be more depleted (loss of heavy isotopes along the path of the steam) the farther it is from its source of water [12, 15, 20]. This so-called Rayleigh distillation concept is essential for understanding the regional processes that affect the isotopic composition of rain, as it is related to the origin of steam, moisture transport, interaction with regional atmospheric circulation, and atmospheric systems, revealing the history of rainfall.
Locally, when rainfall falls on a collection point, a stage called post-condensation processes, it is also subject to two fractionation processes: (i) rainwater composition balances with the surrounding humidity and becomes enriched. This balance depends on droplet size and relative humidity, which at lower levels is less depleted than rainfall at the cloud base, so the isotopic composition of surface rain closely resembles that of surface moisture [21]; The larger the raindrop, the greater its falling velocity and the less exchange with the surrounding vapor, resulting in δ18O depletion [9]; (ii) evaporation of the drops that fall on a layer of low humidity enriches the remaining rain, making the surface rainfall more enriched [22, 23, 24, 25, 26]. This process has been observed mainly in desert areas [15, 21, 27], although it is also seen in continental areas, mainly in light rains in a relatively dry atmosphere [20].
Thus, by combining regional and local fractionation processes, it is possible to determine the isotopic signature of rain, but what makes this identification possible is the way in which the isotopic composition of rain relates to geographic factors and climatic elements, i.e., the approach that is adopted, intends to used to interpret the history of rain. In this way, the sample collection scale determines the degree of interpretation that one intends to have on the isotopic composition of rain, so that regional processes can overlap local processes, and vice versa.
3. Evolution of sampling frequency scales and possibles interpretation of meteorological and isotopic processes
The dynamics between water phase changes and the fractionation process characterize the spatial and temporal variation of isotopic variability in different areas of the globe, since distances such as moisture source, latitude, climate, altitude, land use and land cover, and the acting atmospheric systems are entirely distinct. In this sense, isotopologues can be related to climate dynamics at different temporal and spatial scales, ranging from minutes to hundreds or thousands of years (climate variability), and spatially ranging from the micro-scale (less than 1 km), in atmospheric turbulence, to synoptic (>2000 km) involving large cloud assemblages (Figure 1) [13, 20, 28, 29].
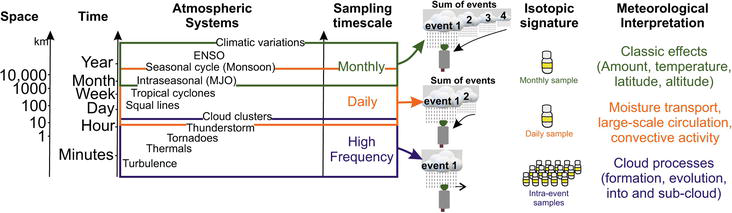
Figure 1.
Synthesis of the relationship between atmospheric systems, isotopic sampling scale, and main meteorological interpretations for understanding climate over time and space.
Figure 1, summarizes the combination of spatial and temporal variation between sampling frequency and atmospheric systems, illustrating what spatial and temporal level a study can incorporate, resulting in different interpretations of how meteorological processes explain rainfall isotopic variability.
For the monthly sampling frequency, a composite sample is collected, in other words, the monthly isotopic signature represents the sum (of n events) or the rain-weighted average of the isotopic fractionation processes that occurred in all rainfall events in the interval of 1 month. With this isotopic signature, it is possible to interpret meteorological processes acting on a large spatial (>2000 km) and temporal (months and years) scale, such as intraseasonal, seasonal, ENSO (interannual) events, and even long-term climate variations, when isotopic monitoring occurs for at least 10 years [30]. Classical effects (such as temperature, latitude, altitude, continentality, and amount) are the main interpretations of the isotopic composition of rainfall.
The earlier research and interpretation were based on monthly samples, and it was developed as the background of concepts and interpretations of the isotopic composition of rainfall, using GNIP database. One of the main elements of the explanation of isotopic variability of meteoric waters is the Global Meteoric Water Line (GMWL), which represents a global linear relationship between δ18O-δ2H, defined by the equation: δ2H = 8 * δ18O + 10 [31]. Subsequently, using GNIP data, a new GMWL equation was computed (δ2H = 8,17 * δ18O + 11,27) [20], despite the Craig’s equation is widely used. The GMWL is a reference for local studies in different climatic regions of the globe and compares to a Local Meteoric Water Line (LMWL), which reflects the average and local relationship between δ18O-δ2H. Since, for a given temperature range and isotopic composition, deviations from the LMWL occur by equilibrium (δ18O-δ2H values around the GMWL) or kinetic processes (slopes of the line different from 8) [30, 32].
The LMWL provides an assessment of the spatial variation of rainfall isotopic composition by comparing isotopic data from different stations and identifying information on seasonal climatology [20, 31]. In addition to the comparison between rain waters, a LMWL serves as a reference to interpret the isotopic composition of other waters (soil, rivers, lakes, groundwater) and plants (stems and leaves), allowing the understanding of water movement and the interaction between these different compartments in a given watershed [7, 30, 33].
Another second-order parameter, which helps to explain the nonequilibrium (kinetic) processes of isotopic fractionation of H isotopes in relation to those of O, is the deuterium excess (
The application of these definitions has enabled a spectrum of interpretations of isotopic variability, characterized by the classic “effects” that have temperature dependence as an important element: In
In accordance with the evolution of climate monitoring technologies associated with the improvement on isotopic determination with the implementation of new techniques such as Laser Absorption Spectroscopy has increased the capacity to determine the number of samples [38], enabling the expansion of isotopic monitoring to daily sampling and increased studies of individual rainfall events with high-frequency sampling.
For the daily sampling scale, a single daily isotopic signature represents the sum of one or more events collected during 1 day or the daily rainfall-weighted average of the isotopic fractionation processes that occurred in these rainfall events over the interval of 1 day. Using the daily isotopic signature is possible to interpret the meteorological processes that operate on a large spatial and temporal scale, as demonstrated by the monthly data from continuous long-term monitoring. However, the daily scale decreases the mixing and overlapping effect between rain events and consequently the different types of isotopic fractionations that occurred during the rain formation, enabling a better resolution to understand the isotopic variability of the different types of weather, identifying usual events from extreme events. For this reason, the daily scale improves the analysis of the interannual variations and seasonal cycles, as well as the action of atmospheric systems between 1000 km and 10 km, in the range of days to a week, such as tropical cyclones, squall lines, and cloud clusters (Figure 1). The daily isotopic composition of rainfall includes evaluations of the moisture origin/transport related to large-scale circulation systems, different types of rainfall, and the influence of convective activity. The daily isotopic composition of rainfall is also related to the classical effects that are better evaluated on a daily scale.
One of the main differences between the isotopic composition of monthly and daily rainfall was observed in the assessment of the amount effect in continental tropical areas. Strong correlations between monthly δ18O-rainfall decrease at the daily scale, due to several factors still under investigation. One of the best hypotheses explaining why daily and short-term isotopic variations do not correspond to rainfall amount, suggested the importance of convective processes in modulating the isotopic content of rainfall, reflecting the integrated history of convective activity over 4 days [36]. In organized convective systems, reevaporation processes of raindrops in mesoscale subsidence updrafts form a low-level depleted vapor in the atmosphere, feeding successive convective systems in that interval of integrated convective activity [36]. Daily isotopic data provide an understanding of the evolution of this convective history, so the isotopic composition is not only related to its final rainfall amount, offering great proxy information for understanding how convection transforms water vapor into rain, after all this mechanism is essential in the energy balance and distribution of water across the globe.
At the high-frequency sampling scale, several samples are collected, hence the variation of several isotopic signatures over the evolution of an individual rain event is observed, forming an isotopic trend of variation, always mentioned in high-frequency studies [17, 21, 22, 23]. Evaluating the isotopic trend provides an interpretation of meteorological processes that operate at smaller spatial (>100 km) and temporal (hours to minutes) scales, such as cloud clusters, thunderstorms, tornadoes, and local rainfall (Figure 1). Using intra-event is possible to evaluate in detail several components, which involve the path, structure and evolution of the storm, the atmospheric system that originated it, changes in the air mass, altitude at which rain is produced (condensation level), type of rain, intensity of rainfall, and local and microphysical processes that occur inside and below the clouds, such as diffusive exchanges between low-level vapor and raindrops (main the evaporation of raindrops), and the relationship with surface meteorological data [17, 20, 21].
The application of these concepts are shown in the next chapter, based on the main results obtained during the 9-year monitoring of the isotopic composition of rainfall in Rio Claro, at different collection scales.
4. Monitoring the isotopic composition of rainfall in Rio Claro
Due to the need to understand how atmospheric processes control the formation and variability of rainfall, which is the main input in aquifer water recharge, rainfall stable isotope sampling stations were installed in several localities (Rio Claro, Brotas, and Araraquara), located in the central-southern portion of São Paulo state. This region is one of the recharge areas of the Guarani Aquifer System (SAG). In this context, the Rio Claro station was affiliated with GNIP, latitude: −22.39°S, longitude: −47.54°W and elevation of 670 m.a.g.l, starting with a monthly collection of stable isotopes of rainfall, sent to the IAEA laboratory in Vienna, along with rainfall and precipitation data.
In order to expand the monitoring of the isotopic composition of rainfall and understand the role of Amazon moisture in the formation of rainfall in the south-central portion of the state of São Paulo, southeastern Brazil, daily samples started to be collected in February 2014. Results, differences, and interpretations of meteorological controls on the isotopic composition of monthly and daily rainfall were discussed in Section 4.1.
The high-frequency rain sampling (details in Section 4.2) was important to understand the isotopic variability during the passage and evolution of different types of rainfall, convective and stratiform, since monthly and daily assessments did not help to understand how these rainfall types control the isotopic composition in Rio Claro.
The Rio Claro region has an average annual rainfall of around 1500 mm, characterized by two distinct seasons. The first season is a rainy and warm spring-summer period occurring between October and March. The second season, which is cooler and less rainy, occurs in the autumn-winter period between April and September. Among the primary regional weather systems, the Cold Fronts (polar air masses), active throughout the year. The South Atlantic Convergence Zone (SACZ) is prevalent in summer and the South Atlantic Subtropical High (SASH), which inhibits rain formation during winter and contributes to the transport of moisture from the Atlantic Ocean to the continent in the other seasons of the year. The Atlantic Ocean serves as the primary moisture source in Brazil, with additional contribution from the Amazon rainforest’s evapotranspiration. The moisture from the Amazon is crucial to the formation of rainfall. It is transported across South America by low-level jets during the rainy season [39, 40, 41, 42].
4.1 Monthly and daily
Between February 2013 and December 2022, 109 monthly samples were collected in Rio Claro station, resulting in a variation from −12.65‰ to 3.07‰, arithmetic mean and standard deviation of −4.73 ± 3.27‰ for δ18O, and from −94.90‰ to 23.70‰ (−23.46 ± 4.22‰) for δ2H, and from −0.86‰ to 24.12‰ (14.39 ± 4.22‰) for
The δ18O and δ2H values were aligned around GMWL, characterized by the e Monthly LMWL (δ2H = 8.12 + δ18O * 15.24) with intercept close to the GMWL value (8) and higher slope (10) (Figure 2A), indicating a predominance of processes related to the continental moisture recycling, which explain the higher
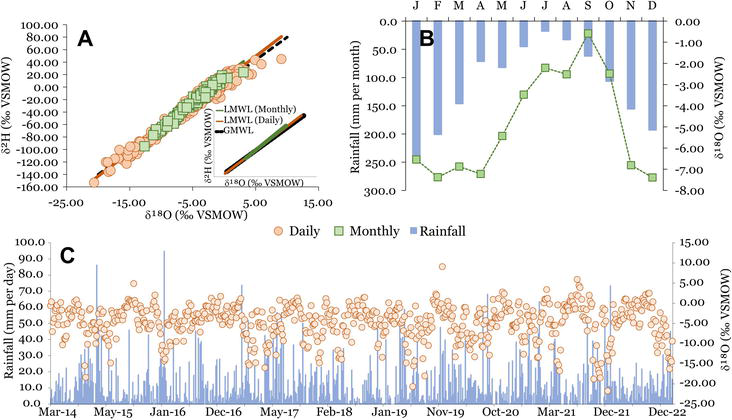
Figure 2.
Overview of the isotopic composition variation in Rio Claro station. (A) Classic δ18O-δ2H relationship by monthly (2013–2022) and daily (2014–2022) dataset, global meteoric water line (GMWL) and monthly (green)/daily (orange) local meteoric water lines, (B) monthly average isotopic composition weighted by the amount of rainfall and monthly mean of rainfall, and (C) daily isotopic composition and rainfall.
One of the common practices in isotopic hydrology studies is the use of the average isotopic composition weighted by the amount of rainfall. This weighted average can be used for a seasonal, annual comparison, or for the full data set. In Figure 2B, the bars in blue are the monthly averages over the monitoring period and the points and lines in green are the average weighted by the amount of rainfall in each month (δ18Owgd = ∑ (δ18Omonth-i * Pmonth-i) / ∑ Pmonth-i). A clear seasonal distribution was observed, characterized by depleted values (δ18O < −6.54‰) during the rainy period (October–March) and enriched values (δ18O > −5.43‰) in the less rainy months (April–September). December (δ18O -7.39‰) and February (δ18O -7.38‰) were the most depleted months, while September was the most enriched (δ18O -0.59‰) (Figure 2B).
The weighted averages presented more depleted values for δ18O (−6.69‰) and δ2H (−24.12‰) compared to the arithmetic mean, and lower for
The moisture-recycled transport by air masses (LMWL) and local amount effect controlled the monthly isotopic composition of rainfall by the condensation-related mechanism (Rayleigh distillation). The seasonal variations in isotopic compositing were distinct due to the different sources of moisture, transport, available moisture, and the performance of different atmospheric systems [38]. However, the dynamics of these main synoptic features change from day to day, since the monthly isotopic composition overlaps the observed variability, making the evaluation very focused on months of high and low rainfall [38].
The daily isotopic composition (represented as orange dots in Figure 2A and C), was evaluated based on 674 samples collected between February 2014 and December 2022. Despite the daily values varied aligned to monthly data, greater range of values were observed for δ18O, δ2H and
This influence of the kinetic fractionation is characterized by the daily LMWL (δ2H = 7.83 + δ18O * 11.84), of a lower intercept and slope compared to the monthly LMWL, despite the close values in relation to GMWL. Continental moisture recycling processes also influence the isotopic composition of daily rainfall, since higher
A clear seasonal variation in “V-shaped” (Figure 2C, black arrows) was observed for the daily isotopic composition of the rainfall. Enriched δ18O values were predominant in the dry period, from April to September (δ18O > −0.40‰ and daily average rainfall of 7.2 mm/day), while depleted δ18O values (δ18O < −9.0‰ and daily average rainfall of 19.8 mm/day) during the rainy season, between November and February (black circles highlighted in Figure 2C). The mean and standard deviation of daily rainfall during the complete monitoring period was 12.39 ± 13.62 mm/day.
The daily weighted average isotopic composition for the entire dataset was −6.15‰, −35.52‰ e 13.67‰ for δ18O, δ2H and
The role of the moisture source/transport mentioned in the evaluation of the monthly data became even more relevant on the daily analysis. Since, it is possible to observe the change in the transport of moisture every day, improving the understanding of the formation of rainfall in Rio Claro, from the origin to the successive condensation processes that occur along the history of rain and its relationship with the atmospheric systems over the course of the days. One of the most used tools in rain isotope studies is the Hybrid Single-Particle Lagrangian Integrated Trajectory (HYSPLIT) model, a mathematical system that calculates trajectories and simulates the dispersion and deposition of particles in the atmosphere (http://ready.arl.noaa.gov/HYSPLIT_traj.php) [43]. Meteorological parameters (e.g., rainfall rate (mm.h−1), temperature (K), humidity (%), and trajectory height (meters) from different databases can be used to compose the meteorological information of the trajectory. Trajectories can be determined in backward mode (refers to pastime trajectories) or forward (future time trajectories), calculated by time determined by the user, as well as the coordinates and initial altitude.
In Rio Claro, back-trajectories were determined in different studies [44, 45, 46]. The Atlantic Ocean is the main moisture source, followed by the Amazon Forest and, in lower events from South Brazil. Between these source regions and Rio Claro station, along pathways of moisture interact with regional circulation, atmospheric systems, and convective activity, resulting in the moisture recycling process, illustrated by the monthly and daily LMWL. This mechanism occurs in different conditions between the seasons of the year, characterizing the observed seasonal variability.
During the rainy season, the moisture from the Amazon interacts with the pressure gradients formed by the increase in temperature, favoring the formation of the SACZ, resulting in more depleted isotopic values observed on the monthly and daily scale. In opposite, during winter, the moisture from the Amazon decreases, being more associated with the Atlantic Ocean, hence rainfall occurs when the FF is strong enough to overcome the circulation of a high-pressure system, such as the South Atlantic Subtropical High (SASH), resulting in a more enriched isotopic composition [44, 45, 47].
The comparison of the isotopic composition rainfall in Rio Claro, with other GNIP stations was also carried out, with the objective of spatially extending the Rio Claro analysis, confirming the role of these mentioned regional processes. This influence of available moisture and different moisture transport conditions was also observed for Belo Horizonte, Brasília, and Rio de Janeiro stations [47]. In this work, the seasonal, continental, and amount effects on the monthly isotopic composition of rainfall in all locations were confirmed. For the daily isotopic composition, one of the main meteorological controls on the variability in δ18O and
A comparison of the isotopic composition of rainfall in different El Niño-Southern Oscillation (ENOS) events, 1997–1998 (ENOS 1) and 2014–2016 (ENOS 2), were carried out. The daily isotopic data from Rio Claro, Bragança Paulista, Campinas, Piracicaba e Santa Maria da Serra in the central-east portion of São Paulo state were used [48]. The same seasonal effect was identified, and mainly the influence of different available moisture conditions, which was higher in the dry season of ENSO 1, generating impoverishment in the isotopic composition of rainfall (δ18O = <−4.60‰) compared to the dry season of ENSO 2, whose available moisture was lower and, consequently, the most enriched rainfall (δ18O = <−2.80‰).
In addition, statistical tests presented in previous studies [45, 46] confirmed the influence of regional parameters on isotopic variability. In these studies, linear regression models were applied with significant results, explaining part of the isotopic variability, mainly values around δ18O = −4.0‰ e − 5.0‰. The regression models, resulting in the need to investigate these rainfall events, did not explain strong negative and positive δ18O values (Figure 2C).
Finally, the isotopic composition of daily rainfall was also associated with the distinction of different types of rain, convective (high δ18O values) and stratiform (low δ18O values) [49], relationship that has been widely investigated in different parts of the world. For Rio Claro, no good correlation was observed between δ18O and convective and stratiform rainfall from two different databases, classification from the Global Precipitation Measurement (GPM) [50] and the ERA-interim (convective and large-scale precipitation converted in mm) provided by the European Center for Medium-Range Weather Forecasts (ECMRWF) [47].
4.2 High-frequency
For understanding the evolution of strong depleted and enriched rainfall events observed on a daily scale, identifying, and classifying rainfall types (convective and stratiform) and local processes related to the falling raindrops in Rio Claro, high-frequency collection was implemented.
A total of 312 samples were collected between 5, 10, and 30 minutes, from the beginning to the end of 18 rainfall events, between September 2019 and February 2021. As the collection was carried out manually, it was very difficult to be in the university facilities since the beginning of the rain. Therefore, the collection of events was performed randomly. Even so, in all seasons of the year, some intra-event was collected, covering a diverse range of atmospheric systems (frontal systems, prefrontal and postfrontal atmospheric instability, atmospheric instability thermal atmospheric during the summer, trough, and SACZ) and rainfall types (convective, stratiform, mixed (mixture between convective-stratiform during the same event), and localized rain) [51].
The isotopic composition of intra-event was combined with the meteorological data of high temporal resolution (minutes per hour), such as surface data (rainfall (mm.min−1), temperature (°C), relative air humidity (%) and pressure (kPa), 1-minute interval) from meteorological automatic station (METER - Em50); vertical profile of the atmosphere over the collection point by micro rain radar (METEK MRR-2 operates at a frequency of 24.230 GHz with a modulation of 0.5–15 MHz) provide the reflectivity (Zc - dBZ), fall velocity (w – m.s−1), rainfall rate (mm.min−1) and liquid water content (g.m−3), in 1-minute interval and height resolutions in a range bin of 31 measurement heights; ERA-5 vertical column of (humidity (%), temperature (°C), liquid water (kg.m−3) and ice (kg.m−3) content; imageries from the GOES-16 satellite (to identify convective nuclei and monitoring the formation and evolution of clouds with the brightness temperature (°C) of the images); determination of trajectories by the HYSPLIT model and regional data from ERA-5, easterly vapor flux (kg.m−3), latent heat flux (W.m−2) and OLR (W.m−2) [51].
Rainfall types were classified employing a micro rain radar, GOES-16 imagery, and surface meteorological station. Radar images depicted distinct vertical structures for rainfall. Convective rainfall displayed a vertical structure, whereas the stratiform exhibited a horizontal structure. The horizontal structure’s feature is the melting layer (or bright band in radar images) which can be quantified by a difference of approximately 4 dBZ in radar reflectivity between radar-measured heights. The identification of the melting layer determines the incidence of stratiform rainfall, and this analysis was conducted for all rainfall events evaluated in this study. The vertical structure is inadequate to confirm the occurrence of convective rainfall. The GOES-16 image was used to identify convective nuclei by analyzing a set of 40 pixels over Rio Claro with a brightness temperature lower than −38°C. The rainfall intensity was computed considering at least 10 mm per hour to determine convective rainfall. During the event, the mixed rainfall was a combination of convective and stratiform rainfall, while local rainfall was defined by the absence of a melting layer and convective nuclei [51].
This isotopic and meteorological dataset on a short temporal scale of minutes resulted in interesting explanations about the evolution of rainfall in Rio Claro, indicating different meteorological controls for convective, stratiform, mixed, and local rainfall.
Figure 3 illustrates an intra-event classified as mixed rainfall. This event occurred during the summer and was formed by predominant moisture from the Amazon Forest, according to HYSPLIT trajectories, where over the state of São Paulo it interacted with the passage of a cold front, characterizing a frontal system (warm mass from Amazon and cold mass from the polar) that produced cloud systems observed in GOES-16 image (Figure 3A). These systems generated rainfall over Rio Claro station, starting at 12:48 pm until 2:28 pm (local time, -3UTC).
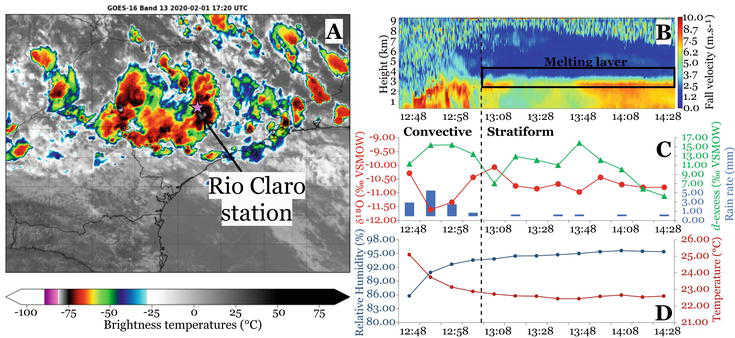
Figure 3.
Summary of local information used in the intra-event analysis. (A) GOES-16 image over the Rio Claro station, included convective nuclei around the station and in São Paulo state, (B) vertical profile of fall velocity (w) of micro rain radar for convective (vertical structure) and stratiform part (horizontal structure marked by the melting layer), (C) 18O (green), d-excess (red) and rain rates (blue), and (D) relative humidity (dark blue) and temperature (dark red). In B, C, and D, the vertical dot line separates the convective and stratiform parts of the event.
In the first part of this event, the convective fraction was observed, characterized by a convective core in the GOES-16 image with a brightness temperature < −38°C in at least 40 pixels around the collection point (Figure 3A), structure vertical of the fall velocity by micro rain radar, without the presence of the melting layer (Figure 3B). In the second part of this event, a change in the vertical structure of the fall velocity was observed, with the presence of the melting layer (the values of w and reflectivity increase when this layer occurs), characterizing the stratiform fraction of this rain event (Figure 3B).
The isotopic composition of the rainfall responded to the evolution of the mixed event, with greater variation in δ18O values (−10.29‰ ~ −11.61‰) during the convective phase and constant δ18O values in the stratiform phase (−10.07‰ ~ −10.97‰) (Figure 3C). For
The event in Figure 3 illustrated how the change in the rainfall types shifted the δ18O and
A comparison between intra-events of stratiform rainfall indicated that the isotopic composition represents the life cycle of the rain system. During the passage of the stratiform cloud over Rio Claro was observed that the rainfall events in the development phase were enriched in relation to events of the mature and dissipating phase (very depleted isotopic composition) [51].
High-frequency sampling not only provides an assessment of intra-event isotopic composition, but it can also facilitate an understanding of processes occurring over the course of a day, providing more than one isotopic signature. Thus, convective rainfall events reflected diurnal differences in isotopic composition, producing strong negative δ18O values and higher d-excess during the night due to higher humidity conditions between the cloud base and the surface in relation to the daytime conditions, δ18O less negative and smaller d-excess.
5. Conclusions
The continuous monitoring of the isotopic composition of rainfall in the GNIP Rio Claro station, Brazil, produced an interpretation of the present climate in the central-southern portion of São Paulo state, on different sampling scale. Monthly, daily, and high-frequency sampling scales were used like the vision instrument to see the dynamic between atmospheric systems linked to the rainfall and the water stable isotopes.
The monthly scale generated an overview of the classic effects (seasonal, rainfall amount, and continentality) in the isotopic composition of rainfall. These interpretations and LMWL are relevant references of isotopic signatures to relate the regional atmospheric dynamics with the local hydrological in the watersheds localized in the Rio Claro region.
The daily isotopic composition offered a more detailed interpretation viewfinder, characterized by monitoring the successive kinds of rainy weather (from synoptic to local spatial scales) day by day (from day to a week), resulting in temporal isotopic observations with clear seasonal patterns linked to stronger convective activity and moisture transport from Amazon during spring-summer (low isotopic composition) and cold fronts activity combined with moisture transport from Atlantic ocean during autumn-winter (high isotopic composition).
For high-frequency or intra-event scale, the interpretation view is enlarged like a magnifying glass zoom, about the formation and evolution of a rain system locally. The rainfall types and their influences on the isotopic composition were improved, clarifying the strong δ18O-δ2H values and revealing new meteorological approaches like the diurnal isotopic composition differences linked to the day-night convection, and life cycle of stratiform rainfall.
Therefore, the history of the isotopic composition of rainfall in Rio Claro is characterized by the Atlantic Ocean and Amazon Forest moisture origins, transported over the long continental pathways resulting in moisture recycled. This mechanism was observed in all sampling scales, with a major emphasis on the daily scale. During these pathways, the moisture interacted with regional circulation, atmospheric systems, air masses, and convective activity removing the heavy isotopes in rainfall and forming the subsequently depleted vapor and next rainfall until arrived at the collection point. Locally, the convective and stratiform rainfall change the variations of δ18O and
Our results provide meteorological observation data and key insights for isotopic interpretation in tropical areas. Based on the acquired knowledge, it will be possible to use isotopic information and establish its relationship with the climate and the occurrence of extreme rainfall events to improve the understanding of past atmospheric processes (recorded in groundwater, glaciers, and spelotems), recent (plants, river water, rain) and future (indicative of water scarcity and increase in extreme events). By studying past events, it is possible to improve our management of water usage and availability considering climate change scenarios. Furthermore, implementing the use of isotopic methods in researching lesser-known hydrological systems can provide solutions to the challenges faced in managing water and climate resources, specifically those impacting tropical regions.
Acknowledgments
The research that produced the isotopic monitoring program in monthly, daily, and high-frequency scales were funded by grants from the São Paulo Research Foundation (FAPESP) under Processes 2015/15749-2 and 2018/06666-4, and by the International Atomic Energy Agency grant BRA-17984 under the initiative CRP-F31004 “Stable isotopes in precipitation and paleoclimatic archives in tropical areas to improve regional hydrological and climatic impact models,” and BRA-23531 under the initiative CRP-F31006 “Isotope Variability of Rain for Assessing Climate Change Impacts.” VS thanks FAPESP for the scholarship provided under the Processes 2013/06704-0, 2016/18735-5, 2019/03467-3 and 2021/10538-4. This study also was financed in part by the Coordination of Superior Level Staff Improvement (CAPES).
References
- 1.
Bauer P, Thorpe A, Brunet G. The quiet revolution of numerical weather prediction. Nature. 2015; 525 :47-55. DOI: 10.1038/nature14956 - 2.
Trenberth KE, Koike T, Onogi K. Progress and prospects for reanalysis for weather and climate. Eos Transactions AGU. 2008; 89 (26):234-235. DOI: 10.1029/2008EO260002 - 3.
Thépaut J-N, Andersson E. The global observing system. In: Lahoz W, Khattatov B, Ménard R, editors. Data Assimilation: Making Sense of Observations. Vol. 1. Berlin, Heidelberg: Springer; 2010. pp. 263-281. DOI: 10.1007/978-3-540-74703-1 - 4.
IPCC. 2021: Summary for policymakers. In: Masson-Delmotte V, Zhai P, Pirani A, Connors SL, Péan C, Berger S, et al, editors. Climate Change 2021: The Physical Science Basis. Contribution of Working Group I to the Sixth Assessment Report of the Intergovernmental Panel on Climate Change. In Press. Available from: https://www.ipcc.ch/report/ar6/wg1/ - 5.
World Meteorological Organization. In: Douris J, Kim G, editors. WMO Atlas of Mortality and Economic Losses from Weather, Climate and Water Extremes (1970-2019). WMO-n°1267. Geneva, Switzerland; 2021. Available from: https://library.wmo.int/idurl/4/57564 - 6.
Gastmans D, Garpelli LN, dos Santos V, de Lima C, Quaggio CS, Santarosa LV, et al. Contribuição dos isótopos estáveis da água (H e O) no conhecimento dos aquíferos brasileiros: Estado da arte e perspectivas futuras. Derbyana. 2021; 42 :1-47. DOI: 10.14295/derb.v42.734 - 7.
Jasechko S. Global isotope hydrogeology—Review. Reviews of Geophysics. 2019; 57 :835-965. DOI: 10.1029/2018RG000627 - 8.
Mook WG. Environmental isotopes in the hydrological cycle. Principles and Applications. Technical documents in Hydrology, n°39. Vol. 1. Paris: UNESCO; 2000 - 9.
Xi X. A review of water isotopes in atmospheric general circulation models: Recent advances and future prospects. International Journal of Atmospheric Sciences. 2014; 2014 :1-16. DOI: 10.1155/2014/250920 - 10.
Maia DC, Fontão PAB, Souza LB, Christofoletti ALH, de Azevedo TS. Hail rain and its geographical repercussions in the countryside of São Paulo (SP) state. Mercator. 2019; 18 :1-16. DOI: 10.4215/rm2019.e18006 - 11.
Coelho CAS, Cardoso DHF, Firpo MAF. Precipitation diagnostics of an exceptionally dry event in São Paulo, Brazil. Theoretical and Applied Climatology. 2016; 125 :769-784. DOI: 10.1007/s00704-015-1540-9 - 12.
Clark I, Fritz P. Environmental Isotopes in Hydrogeology. Boca Raton: CRC Press; 342AD - 13.
Mook WG. Isótopos ambientales en el ciclo hidrológico: principios y aplicaciones. Madrid: Instituto Geológico y Minero de España; 2002 - 14.
Urey HC. The thermodynamic properties of isotopic substances. Journal of the Chemical Society. 1947; 0 :562-581. DOI: 10.1039/jr9470000562 - 15.
Dansgaard W. Stable isotopes in precipitation. Tellus. 1964; 16 :436-468. DOI: 10.1111/j.2153-3490.1964.tb00181.x - 16.
Jouzel J, Merlivat L. Deuterium and oxygen 18 in precipitation: Modeling of the isotopic effects during snow formation. Journal of Geophysical Research. 1984; 89 :11749. DOI: 10.1029/JD089iD07p11749 - 17.
Muller CL, Baker A, Fairchild IJ, Kidd C, Boomer I. Intra-event trends in stable isotopes: Exploring midlatitude precipitation using a vertically pointing micro rain radar. Journal of Hydrometeorology. 2015; 16 :194-213. DOI: 10.1175/JHM-D-14-0038.1 - 18.
Yoshimura K. Stable water isotopes in climatology, meteorology, and hydrology: A review. Journal of the Meteorological Society of Japan. 2015; 93 :513-533. DOI: 10.2151/jmsj.2015-036 - 19.
Craig H, Gordon LI. Deuterium and oxygen-18 variations in the ocean and the marine atmosphere. In: Tongiorgi E, editor. Stable Isotopes in Oceanographic Studies and Paleotemperatures. Spoleto: Conferences in Nuclear Geology; 1965 - 20.
Rozanski K, Araguás-Araguás L, Gonfiantini R. Isotopic patterns in modern global precipitation. In: Swart PK, Lohmann KC, Mckenzie J, Savin S, editors. Geophysical Monograph Series. Washington, D.C.: American Geophysical Union; 1993. pp. 1-36. DOI: 10.1029/GM078p0001 - 21.
Celle-Jeanton H, Gonfiantini R, Travi Y, Sol B. Oxygen-18 variations of rainwater during precipitation: Application of the Rayleigh model to selected rainfalls in southern France. Journal of Hydrology. 2004; 289 :165-177. DOI: 10.1016/j.jhydrol.2003.11.017 - 22.
Gedzelman SD, Lawrence JR. The isotopic composition of Precipitatin from two extratropical cyclones. American Meteorological Society. 1990; 118 :495-509. DOI: 10.1175/1520-0493(1990)118,0495: TICOPF.2.0.CO;2 - 23.
Graf P, Wernli H, Pfahl S, Sodemann H. A new interpretative framework for below-cloud effects on stable water isotopes in vapour and rain. Atmospheric Chemistry and Physics. 2019; 19 :747-765. DOI: 10.5194/acp-19-747-2019 - 24.
Lee J-E, Fung I. “Amount effect” of water isotopes and quantitative analysis of post-condensation processes. Hydrological Processes. 2008; 22 :1-8. DOI: 10.1002/hyp.6637 - 25.
Srivastava R, Ramesh R, Rao TN. Relationship between stable isotope ratios and drop size distribution in tropical rainfall. Journal of Atmospheric Chemistry. 2012; 69 :23-31. DOI: 10.1007/s10874-012-9227-4 - 26.
Miyake Y, Matsubaya O, Nishihara C. An isotopic study on meteoric precipitation. Papers Meteorology and Geophysics. 1968; 19 :243-266 - 27.
Stewart MK. Stable isotope fractionation due to evaporation and isotopic exchange of falling waterdrops: Applications to atmospheric processes and evaporation of lakes. Journal of Geophysical Research. 1975; 80 :1133-1146. DOI: 10.1029/JC080i009p01133 - 28.
Cole JE, Rind D, Webb RS, Jouzel J, Healy R. Climatic controls on interannual variability of precipitation δ18O: Simulated influence of temperature, precipitation amount, and vapor source region. Journal of Geophysical Research. 1999; 104 :14223-14235. DOI: 10.1029/1999JD900182 - 29.
Risi C, Noone D, Frankenberg C, Worden J. Role of continental recycling in intraseasonal variations of continental moisture as deduced from model simulations and water vapor isotopic measurements: Continental recycling and water isotopes. Water Resources Research. 2013; 49 :4136-4156. DOI: 10.1002/wrcr.20312 - 30.
Putman AL, Fiorella RP, Bowen GJ, Cai Z. A global perspective on local meteoric water lines: Meta-analytic insight into fundamental controls and practical constraints. Water Resources Research. 2019; 55 :6896-6910. DOI: 10.1029/2019WR025181 - 31.
Craig H. Isotopic variations in meteoric waters. Science, New Series. 1961; 133 :1702-1703 - 32.
Marchina C, Zuecco G, Chiogna G, Bianchini G, Carturan L, Comiti F, et al. Alternative methods to determine the δ2H-δ18O relationship: An application to different water types. Journal of Hydrology. 2020; 587 :124951. DOI: 10.1016/j.jhydrol.2020.124951 - 33.
Ehleringer JR, Dawson TE. Water uptake by plants: Perspectives from stable isotope composition. Plant, Cell & Environment. 1992; 15 :1073-1082. DOI: 10.1111/j.1365-3040.1992.tb01657.x - 34.
Merlivat L, Jouzel J. Global climatic interpretation of the deuterium-oxygen 18 relationship for precipitation. Journal of Geophysical Research. 1979; 84 :5029. DOI: 10.1029/JC084iC08p05029 - 35.
Froehlich K, Gibson JJ, Aggarwal P. Deuterium excess in precipitation and its climatological significance. International conference on study of environmental change using isotope techniques; (IAEA-CSP--13/P). Vienna, Austria: International Atomic Energy Agency (IAEA); 2002. Available from: http://www-pub.iaea.org/MTCD/publications/PDF/CSP-13-P_web.pdf/ - 36.
Risi C, Bony S, Vimeux F. Influence of convective processes on the isotopic composition (δ18O and δD) of precipitation and water vapor in the tropics: 2. Physical interpretation of the amount effect. Journal of Geophysical Research. 2008; 113 :D19306. DOI: 10.1029/2008JD009943 - 37.
Santarosa LV, Gastmans D, Sánchez-Murillo R, Santos VD, Batista LV, Betancur SB. Stable isotopes reveal groundwater to river connectivity in a mesoscale subtropical watershed. Isotopes in Environmental and Health Studies. 2021; 57 :236-253. DOI: 10.1080/10256016.2021.1877701 - 38.
Wassenaar LI, Coplen TB, Aggarwal PK. Approaches for achieving long-term accuracy and precision of δ18O and δ2H for waters analyzed using laser absorption spectrometers. Environmental Science & Technology. 2014; 48 :1123-1131. DOI: 10.1021/es403354n - 39.
Reboita MS, Gan MA, Rocha RPD, Ambrizzi T. Regimes de precipitação na América do Sul: uma revisão bibliográfica. Revista Brasileira de Meteorologia. 2010; 25 :185-204. DOI: 10.1590/S0102-77862010000200004 - 40.
Marengo JA, Soares WR, Saulo C, Nicolini M. Climatology of the low-level jet east of the Andes as derived from the NCEP–NCAR reanalyses: Characteristics and temporal variability. Journal of Climate. 2004; 17 :2261-2280. DOI: 10.1175/1520-0442(2004)017<2261:COTLJE>2.0.CO;2 - 41.
RenéD G. Cold air incursions over subtropical South America: Mean structure and dynamics. Monthly Weather Review. 2000; 128 :2544-2559. DOI: 10.1175/1520-0493(2000)128<2544:CAIOSS>2.0.CO;2 - 42.
Kodama Y. Large-scale common features of subtropical precipitation zones (the Baiu frontal zone, the SPCZ, and the SACZ) part I: Characteristics of subtropical frontal zones. Journal of the Meteorological Society of Japan. 1992; 70 :813-836. DOI: 10.2151/jmsj1965.70.4_813 - 43.
Stein AF, Draxler RR, Rolph GD, Stunder BJB, Cohen MD, Ngan F. NOAA’s HYSPLIT atmospheric transport and dispersion Modeling system. Bulletin of the American Meteorological Society. 2015; 96 :2059-2077. DOI: 10.1175/BAMS-D-14-00110.1 - 44.
Santos VD, Gastmans D, Santarosa LV, Batista LV, Betancur SB, Dias De Oliverira ME, et al. Variabilidade da Composição Isotópica da Precipitação na Região Central do Estado de São Paulo. Revista Águas Subterrâneas. 2019; 33 :171-181. DOI: 10.14295/ras.v33i2.29474 - 45.
Dos Santos V, Gastmans D, Sánchez-Murillo R, Felippe Gozzo L, Vianna Batista L, Lilla Manzione R, et al. Regional atmospheric dynamics govern interannual and seasonal stable isotope composition in southeastern Brazil. Journal of Hydrology. 2019; 579 :124136. DOI: 10.1016/j.jhydrol.2019.124136 - 46.
Gastmans D, Santos V, Galhardi JA, Gromboni JF, Batista LV, Miotlinski K, et al. Controls over spatial and seasonal variations on isotopic composition of the precipitation along the central and eastern portion of Brazil. Isotopes in Environmental and Health Studies. 2017; 53 :518-538. DOI: 10.1080/10256016.2017.1305376 - 47.
Dos Santos V, Marshall Fleming P, Henrique Mancini L, Dalva Santos Cota S, De Lima GB, Rodrigues Gomes R, et al. Distinguishing the regional atmospheric controls on precipitation isotopic variability in the central-southeast portion of Brazil. Advances in Atmospheric Sciences. 2022; 39 :1693-1708. DOI: 10.1007/s00376-022-1367-0 - 48.
Santos V, Dias De Oliveira M, Boll J, Sánchez-Murillo R, Menegário AA, Gozzo LF, et al. Isotopic composition of precipitation during strong El Niño–southern oscillation events in the southeast region of Brazil. Hydrological Processes. 2019; 33 :647-660. DOI: 10.1002/hyp.13351 - 49.
Aggarwal PK, Romatschke U, Araguas-Araguas L, Belachew D, Longstaffe FJ, Berg P, et al. Proportions of convective and stratiform precipitation revealed in water isotope ratios. Nature Geoscience. 2016; 9 :624-629. DOI: 10.1038/ngeo2739 - 50.
Munksgaard NC, Kurita N, Sánchez-Murillo R, Ahmed N, Araguas L, Balachew DL, et al. Data descriptor: Daily observations of stable isotope ratios of rainfall in the tropics. Scientific Reports. 2019; 9 :14419. DOI: 10.1038/s41598-019-50973-9 - 51.
Santos V. Isótopos estáveis da água (δ18O-δ2H) em intra-eventos: Decifrando a história da chuva na porção central do estado de São Paulo. [Doctoral Thesis]. Rio Claro: São Paulo State University (UNESP), Institute of Geosciences and Exact Sciences; 2023. Available from: https://repositorio.unesp.br/items/7e021a25-304f-4db5-85ad-c043dd0c7538