Open Access is an initiative that aims to make scientific research freely available to all. To date our community has made over 100 million downloads. It’s based on principles of collaboration, unobstructed discovery, and, most importantly, scientific progression. As PhD students, we found it difficult to access the research we needed, so we decided to create a new Open Access publisher that levels the playing field for scientists across the world. How? By making research easy to access, and puts the academic needs of the researchers before the business interests of publishers.
We are a community of more than 103,000 authors and editors from 3,291 institutions spanning 160 countries, including Nobel Prize winners and some of the world’s most-cited researchers. Publishing on IntechOpen allows authors to earn citations and find new collaborators, meaning more people see your work not only from your own field of study, but from other related fields too.
Plant diseases are a major threat to food security, causing drastic alterations in plant metabolism upon infection by pathogens. This often results in decreased biomass accumulation, slowed growth rates, and diminished yield components. Pathogens, through various lifestyles such as biotrophic, necrotrophic, and hemibiotrophic, disrupt photosynthesis, the primary metabolic process, via functional and structural damages. Furthermore, the CO2 assimilation in plants is severely altered by pathogens regardless of their lifestyles. Photosynthetic determinations allow us to establish a perspective about the physiological impairment caused by pathogens related to alterations in the CO2 flow from the atmosphere to carboxylation sites, stomatal limitations, and photosynthetic performance of photosystem II (PSII). From the changes in the energy, dissipation is possible to establish the functional status of the photochemistry machinery under stress conditions. For the above, chlorophyll a fluorescence (CF) and CF imaging (CFI) arose as a method highly sensible to determine the damage caused by pathogens in plants. This review shows a practical perspective on CF tools using visual method and rapid fluorescence induction kinetics (OJIP-test), for disease detection associated with plant-pathogen interaction studies from the physiological viewpoint, their implications for plant pathology research, applications for the plant phenotyping field, and biotic stress detection.
Czech Advanced Technology and Research Institute, Palacky University, Olomouc, Czech Republic
Andrea Elizabeth Román Ramos*
Agricultural Sciences, Natural Resources and the Environment Faculty, Laboratory of Phytopathology, Bolivar State University, Guaranda, Ecuador
*Address all correspondence to: aroman@ueb.edu.ec
1. Introduction
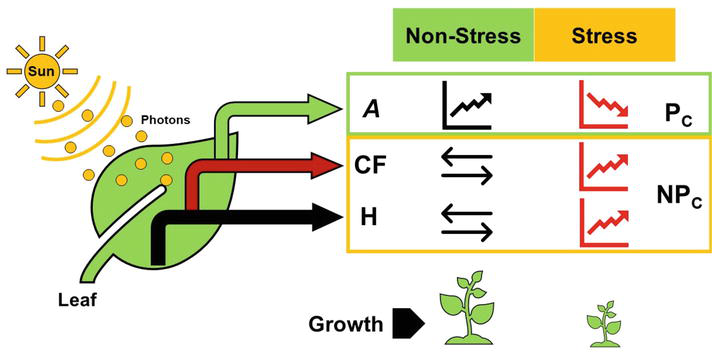
The photosynthetic process is one of the most important metabolic pathways through which plants transform the sunlight into chemical energy obtaining carbohydrates to be used in other metabolic events [1]. In plants, the sunlight energy may be dissipated by photochemistry (photosynthesis light reactions), chlorophyll fluorescence (photon re-emission), and heat (Figure 1) [2]. Metabolic process of photosynthesis has been studied in two stages: (i) light reactions: these processes allow the solar energy contained in photons of sunlight to be processed in the membranes of chloroplasts to produce adenosine triphosphate (ATP) and nicotinamide adenine dinucleotide phosphate (NADPH) and (ii) the Calvin-Benson cycle, which produces triose-P and, as a result, the recovery of ribulose 1,5-bisphosphate (RuBP), in which how CO2 is reduced [3, 4]. Chlorophyll fluorescence occurs when the electron transfer from a chlorophyll molecule at the reaction center of the photosystem II (PSII) to a plastoquinone molecule within the plastoquinone transporter, results in fluorescence emission [2]. Finally, the energy cannot be dissipated by photochemistry or fluorescence, and it is dissipated by heat emission [5, 6]. Under this perspective, plants utilize the sun’s energy mainly to supply the demands of the primary metabolism; however, external (stresses) and intrinsic (diffusional and biochemical limitations) factors related to the photosynthetic process induce alternative pathways such as fluorescence and heat emission to help in the energy dissipation process to reduce functional and structural damages in the plant cell derivatives of energy accumulation [2].
Figure 1.
Energy dissipation pathways (photochemistry (A), chlorophyll fluorescence (CF), and heat (H)) in leaves under non-stress and stress conditions and its effect on plant growth. Photochemical dissipation: PC; non-photochemical dissipation: NPC. Design figure credit by Carlos Eduardo Aucique-Perez.
To study the photosynthesis, several methodologies have been developed involving determinations based on changes in CO2 and water vapor differential concentrations using infrared sensors (infrared gas analyzer (IRGA)) through which it is possible calculate the leaf gas exchange parameters such as net CO2 assimilation rate (A), stomatal closed (gs), CO2 intercellular concentration (Ci), and transpiration rate (E) [7]. Other methodologies developed in the biochemistry field are commonly applied in photosynthesis studies such as the quantification of the carbohydrates or enzymatic activities of the biochemical components associated with this pathway [8, 9]. Under plant stress, the photosynthetic activity is a main physiological pathway evaluated, as the functionality of the photosynthetic machinery is affected by stress factors [10].
On the other hand, the chlorophyll a fluorescence (CF) has been a non-invasive and non-destructive method successful to study photosynthetic responses from plants under different conditions [11]. Currently, the CF method is applied in diverse fields, especially for rapid diagnosis of abiotic or stress biotic [12, 13] based on changes in the energy dissipation magnitude in the photochemical reactions [10]. Basically, the CF method has been developed from “Kautsky’s effect,” which was studied when the photosynthetic sample was transferred from the dark to the light, the CF yield increased over a time span of about 1 second. This effect led to increases in the CF yield with a consequent reduction of electron acceptors in the photosynthetic pathway inducing quinone A (QA) reduction due to one electron reception which must be transferred to quinone B (QB), ensuring the linear electron flow [5]. Therefore, variations in CF characteristics can be indicative of various stresses, including nutrient deficiencies, water deficit, pathogen infections, and high light intensity [2]. By monitoring the CF, scientists, agronomists, and other professionals can gain insights into plant performance and make informed decisions regarding crop management and stress mitigation strategies. In this sense, the CF can be used as a diagnostic tool for assessing plant health and stress responses.
For the plant pathology field, the CF tool has been used for the detection of changes in the energy dissipation pattern in several pathosystems related to fungi, viruses, bacteria, and oomycetes, for example, Bipolaris sorokiniana [14], Fusarium spp. [11, 15], Oculimacula acuformis [11], Puccinia triticina [16], Puccinia coronate [17], Bremia lactucae [18], Pseudomonas syringae [19], Grapevine leafroll-associated virus 3 [20, 21], and so on. Advances in the CF instrumentation, including portable devices and remote sensing techniques, have expanded the accessibility and applicability of this technology. In recent years, an increase of portable user-friendly and non-invasive chlorophyll fluorometers had been used for research in the plant pathology field. However, despite the simplicity of the utilization of equipment, the theory and interpretation of data arising from analysis continues to be complex [22].
The use of these devices has allowed crop monitoring on the field and under controlled conditions, plant health management, and ecosystem dynamics [23]. Additionally, the CF imaging technique enable the spatial and temporal visualization of photosynthetic activity, allowing for the assessment of plant performance and the detection of heterogeneity in responses [6]. The integration of the CF with other “omics” technologies further enhances our understanding of photosynthetic regulation and stress responses at the molecular, metabolic, genomic, and phenomic level [24]. Overall, the CF technique plays a crucial role in advancing our knowledge of plant function and resilience. In this sense, the aim of the review was describing the use of the CF as a technique of determination of biotic stress in the plant pathology field.
2. Chlorophyll a fluorescence: method and application
The CF has been used as a technique in photosynthesis research, providing valuable information on the structure and function of the photosynthetic apparatus [10, 12]. In this sense, the photosynthetic response can be estimated by fluorescence changes which study through two types of CF measurement such as continuous excitation and pulsed excitation [5].
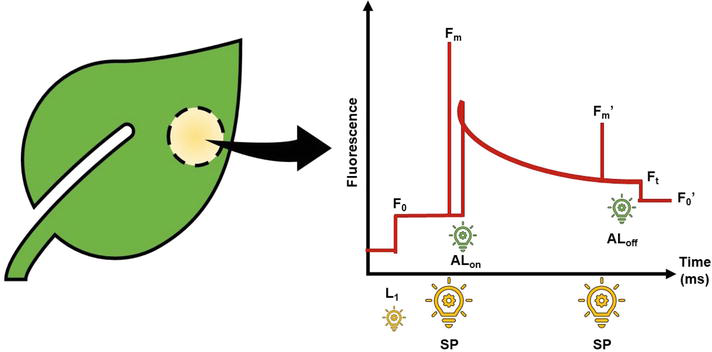
Firstly, a method uses pulse amplitude modulation (PAM). The PAM method measures CF induced by high-frequency, modulation pulses (MP) at different stages of the system dynamics driven by saturation pulses (SP) or actinic light (AL) [25, 26]. Thus, the relative yield of fluorescence can be measured in the presence of illumination or can be conducted at field condition [5]. Fundamentally, the CF method determines values associated with basal (F0 and F0′) and maximal (Fm and Fm′) fluorescence on dark and light-adapted leaves from which it has been possible to derive parameters to estimate specific responses of the energy dissipation through the photochemical pathway [5]. Experimentally, F0, F0′, Fm, and Fm′ are obtained from a sequence of light supplying to different intensities which simulated the change from darkness to light adaptation through photosynthetic excitation (Figure 2). For obtaining F0, the dark-adapted leaf is illuminated with weak, modulated measuring pulse (L1 = 0.03 μmol m−2 s−1). Immediately, a light saturate pulse (SP = 8000 μmol m−2 s−1) is applied for 0.8 s to ensure maximal fluorescence emissions (Fm). Subsequently, on light-adapted leaves, the steady-state fluorescence yield (Ft) is measured following a saturating light pulse (SP = 8000 μmol m−2 s−1, 0.8 s) that was applied to achieve the light-adapted maximal fluorescence (Fm′). The actinic light (AL) is then turned off and far-red illumination was applied (2 μmol m−2 s−1) to measure the light-adapted basal fluorescence (F0′) [7].
Figure 2.
Fluorescence determination routine. Lowing intensity light (L1); light saturated pulse (SP); actinic light on (ALon) and off (ALoff); basal (F0) and maximal (Fm) fluorescence in dark-adapted leaf; basal (F0′) and maximal (Fm′) fluorescence in light-adapted leaf; fluorescence level immediately before the SP (Ft). Figure adapted from Baker [2].
The second method is based on the increase in the CF yield observed when leaves pass through dark to light in a short time period. This induction and fast dynamic changes of CF occur when dark-adapted samples are exposed to light known as Kautsky’s effect, as explained above [27], and it is observed as a polyphasic curve, giving information about the efficiency of electron transport through PSII [28, 29]. The CF variations on the OJIP induction curve are also well-known as the OJIP-test. From the O-step to the J-step, it reflects high-order nonlinear dynamics of PSII resulting from light excitation, energy transfer, energy dissipation, and photochemical reactions [25], see Table 1 for more details. The technique is based on the theory that energy flux through PSII reaction centers can be quantified to provide information about structure and function of the photosynthetic apparatus [33].
Technical fluorescence parameters
Area
Area between fluorescence curve and FM
M0
Slope of the curve at the origin of the fluorescence rise. It is a measure of the rate of the primary photochemistry.
Vj
Relative variable fluorescence at 2 ms
Vi
Relative variable fluorescence at 30 ms
SM = Area/FV
Normalized total complementary area above the OJIP transient (reflecting multiple-turnover QA reduction events). It expresses the total electron carriers (EC) per RC.
N
The number of rotations: number of QA reduction events between time 0 and t FM.
Energy fluxes
ABS
The photon flux absorbed by the antenna of PSII units
TR
The portion of ABS trapped by the active PSII units that leads to QA reduction
DI
The portion of ABS dissipated in PSII antenna in process other than trapping
ET
The energy flux associated with the electron transport from QA− to the intersystem electron acceptors
RE
The energy flux associated with the electron transport from QA− to the final electron acceptors of PSI
Quantum yields or flux ratios
ϕPo = TR0/ABS
Maximum quantum yield of primary photochemistry (at t = 0) ϕPo = (FM – F0)/FM
ψEo = ET0/TR0
Probability (at t = 0) that a photon trapped by the PSII reaction center enters the electron transport chain ψEo = 1 – Vj
ϕEo = ET0/ABS
Quantum yield of electron transport (at t = 0) ϕEo = [(1 – F0/FM) × (1 – Vj)]
ϕDo = DI0/ABS
Quantum yield (at t = 0) of energy dissipation. ϕDo = (F0/FM)
ϕRo = RE0/ABS
Quantum yield of an electron transport from QA− to the final electron acceptors of PSI. ϕRo = [(1 – F0/FM) × (1 – Vi)]
δ Ro = RE0/ET0
Efficiency with which an electron from PQH2 is transferred to final PSI acceptors δ Ro = (1 – Vi)/(1 – Vj) = (FM – F)/(FM– Fj)
Specific fluxes or specific activities (expressed in arbitrary units)
ABS/RC
Effective antenna size of an active reaction center (RC). Expresses the total number of photons absorbed by chlorophyll molecules of all RCs divided by the total number of active RCs ABS/RC = (M0/Vj)/ϕPo
TR0/RC
Maximal trapping rate of PSII. Describes the maximal rate by which an excitation is trapped by the RC TRo/RC = M0/Vj
ET0/RC
Electron transport in an active RC ETo/RC = (M0/Vj)/ψEo
DI0/RC
Dissipated energy flux per RC DI0/RC = ABS/RC – TR0/RC
Phenomenological fluxes or phenomenological activities (expressed in arbitrary units)
ABS/CS0
Absorption per cross-section (CS) ABS/CS0 ≈ F0 and ABS/CSM ≈ FM
TR0/CS
Trapping per cross-section TR0/CS = (TR0/ABS) × (ABS/CS)
ET0/CS
Electron transport per cross-section ET0/CS = (ET0/ABS) × (ABS/CS)
RE0/CS
Electron flux from QA− to final PSI acceptors per cross section of PSI RE0/CS = (RE0/ABS) × (ABS/CS)
Performance indexes
PIABS
Performance index on adsorption basis PIABS = (RC/ABS) × [ϕPo/(1 – ϕPo)] × [ψEo/(1 – ψEo)]
PIABS, total
Total performance index on absorption basis PIABS, total = PIABS × [δR0/(1 – δR0)]
PICS
Performance index on cross section basis PICS = PIABS × (ABS/CS)
PICS, total
Total performance index on cross section basis PICS, total = PIABS, total × (ABS/CS)
Table 1.
Parameters and definition related to energy fluxes obtained from OJIP-test.
Several CF parameters are commonly used to evaluate the performance of the photosynthetic apparatus, such as the maximum quantum yield of photosystem II (PSII), often represented as the Fv/Fm, provides information about the maximum efficiency of PSII photochemistry [5]. The effective quantum yield of PSII (ΦPSII) reflects the actual efficiency of light energy conversion in PSII [2] and non-photochemical quenching (NPQ) that represents the dissipation of excess light energy as heat, thereby protecting the photosynthetic machinery from photodamage [34]. The increases in non-photochemical quenching (measured as NPQ and/or qN), photoinhibition detected by decreases in Fv/Fm, and inhibition of the electron transport chain can be observed in cases of a stress condition is prolonged [10]. For a higher understanding of the fluorescence parameters, Table 2 describes the main parameters, their description, calculation, and physiological interpretation.
Parameter
Description
Formula/interpretation
F0; F0′
Basal or initial fluorescence from dark and light-adapted leaves, respectively
Level of florescence when all PSII center open (oxidated status)
Fm; Fm′
Maximal fluorescence from dark and light-adapted leaves, respectively
Level of florescence when all PSII center closed (reduced status)
Fv; Fv′
Variable fluorescence from dark and light-adapted leaves, respectively
Fm – F0 It is value associated with the PSII capacity to perform photochemistry
Fv/Fm
Maximum quantum yield of PSII
(Fm – F0)/Fm Maximum efficiency at which light absorbed by PSII is utilized to reduce QA
Fv′/Fm′
Capturing efficiency of the excitation energy by the open PSII reaction centers
(Fm′ – F0′)/Fm′
qP
Coefficient for photochemical quenching
(Fm′– Ft)/(Fm′ – F0′) Actual photochemical capacity
qN
Coefficient for photochemical quenching
1 – [(Fm′ – F0′)/Fm – F0] Non-photochemical process activation during the light period
ΦPSII
Actual quantum yield of PSII electron transport
(Fv′/Ft)/Fm′
NPQ
Non-photochemical quenching
(Fm – Fm′) – 1 Apparent heat loss rate from PSII
ETR = J
Rate of electron transport
PPFD × ФPSII × ƒ × α
Table 2.
Chlorophyll fluorescence parameters used for studies of photosystem II (PSII) photochemistry.
PPFD is the photosynthetic photon flux density. ƒ is a factor that accounts for the partitioning of energy between PSII and PSI and is assumed to be 0.5, which indicates that the excitation energy is distributed equally between the two photosystems; and α is the leaf absorbance by the photosynthetic tissues and is assumed to be 0.84.
The CF parameters obtained from measurements can provide valuable information about the plant’s photosynthetic efficiency, tolerance to stress (abiotic and biotic), or normal physiological condition [6, 35]. Therefore, measuring changes in fluorescence parameters such as Fv/Fm, ΦPSII, and NPQ provides insights into the functionality and regulation of PSII and can indicate early stress detection [34]. In this context, the NPQ represents the protective mechanism employed by plants to dissipate excess absorbed light energy as heat, reducing the potential for photodamage [22]. In addition, the NPQ is influenced by factors such as light intensity, temperature, and the availability of energy sinks within the plant [36]. In practice, the NPQ determination requires leaves’ full adaptation to darkness in such a way it reflects the energy dissipation capacity in excess, especially under stress conditions [6]. Recently Tietz et al. [37] proposed the characterization a new set of parameters, NPQ (T), that can be used without dark adaptation and can be rapidly applied during steady-state illumination, potentially even under field conditions.
On the other hand, in the last years, with the developments in optical sensors, the CF imaging (CFI) technique emerged as a powerful tool to study plants under different growth conditions, especially stress factors. In this case, the fluorescence spectral considers the wavelength from UV to infrared, allowing the examination of the spectral region’s keys for the plant’s physiology responses. In addition, the physical characteristic is related to the emission of fluorescence when the energy is absorbed in the UV region, invisible to the human eye, and posterity is emitted in the visible region and can facilitate obtaining images [38]. Basically, a CFI system utilizes a camera with a long-pass filter, while hindering shorter wavelengths. From the images captured, they are segmented and CF parameters are calculated for each pixel, finishing with the visualization of CF images [39]. With this technique, the obtaining of images from each parameter associated with the CF such as Fv/Fm, ΦPSII, NPQ , and ETR allows the visual exploration of changes in these parameters per area unit [40] and spatial heterogeneity distribution of CF [41]. It has been such a sensibility in this technique that the CFI sensors have been coupled to plant phenotyping systems, obtaining interesting results on indoor and outdoor platforms [10].
3. Photosynthetic alterations by pathogen infection
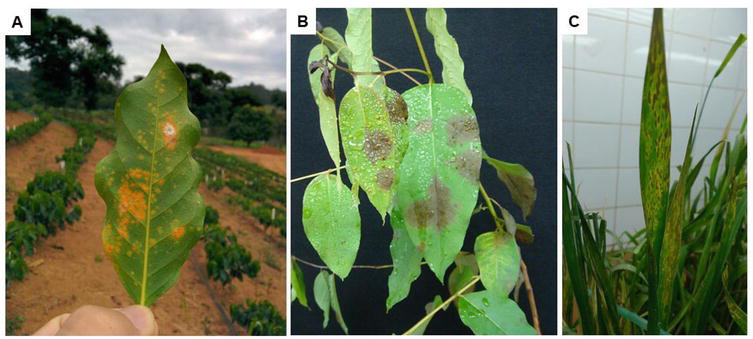
Under biotic stress, the CO2 assimilation in plants is severely altered by pathogens infection regardless of their lifestyles (e.g., biotrophic, necrotrophic, and hemibiotrophic) [1, 42]. The biotrophic pathogens get to grow and feed on living plant tissue colonizing plant cells undetected through mechanisms that suppress the plant responses to infection [43]. The biotrophic strategy is considered obligatory parasitism, where the pathogen establishes a molecular and physiological manipulation of the plant cell, and this way it obtains the energy for the growth, such as the causal pathogens associated with rust (e.g., Hemileia vastatrix) (Figure 3A) and powdery mildew (e.g., Erysiphales sp.) diseases [44, 45]. In contrast, the necrotrophic fungi from the first infected plant cell induces rapid cell death using enzymes and toxins to degrade plant tissues, and in this way, the necrotrophic pathogen colonizes the rest of the plant structures [43]. Botrytis cinerea, Alternaria brassicicola, and Neopestalotiopsis sp. (Figure 3B) are species commonly related to the necrotrophic strategy as they have a molecule pool with a high destructive power of the plant’s tissues from the first time of the interaction with the host plant [46, 47, 48]. Finally, hemibiotrophic fungi have the capacity to combine both biotrophic and necrotrophic strategies [49]. For this strategy, a biotrophic phase allows the colonization of the first plant cell to establish the invading hypha that later deploys other invasive structures in the necrotrophic phase to cause plant cell destruction [50]. An excellent example of the hemibiotrophic strategy is Pyricularia oryzae fungi (Figure 3C) [51].
Figure 3.
Leaf symptoms caused by biotrophic (A; Hemileia vastatrix), necrotrophic (B; Neopestalotiopsis sp.), and hemibiotrophic (C; Pyricularia oryzae) fungi in coffee, wheat, and eucalyptus plants, respectively. Picture credits by Carlos Eduardo Aucique-Perez.
During the plant-pathogen interactions, plants infected by pathogens have reported reductions in CO2 assimilation, stomatal dynamic alterations (stomatal closure), chronic inhibition of the photosystems, higher dissipation of energy by chlorophyll a fluorescence (non-photochemical mechanisms), alterations in the concentration of photosynthetic pigments, chloroplasts structural damage, losses in leaf area index, changes in the source-sink ratio, and changes in the profiles of genes, proteins, and metabolic related to photosynthesis [1, 8, 9, 52]. The pathogen infection in the foliar tissue causes loss in the sunlight conduction capacity due to the cellular damage affecting the photosynthetic activity and consequent development of chlorotic and necrotic zones product of the action of hydrolytic enzymes, non-host selective toxins, and reactive oxygen species (ROS) [1, 53]. While, the plant cell after detection of the pathogen, genes related to photosynthesis are transcript down-regulated to protect the photosynthetic apparatus against the oxidative damage [1, 42].
CO2 assimilation by the photosynthetic process is a permanent source of primary metabolism, and their products are the main energetic nutrient for pathogens colonizing plant tissues, as well as molecules related to metabolic pathways from secondary metabolism [1, 54]. Studies performed in the last 20 years have allowed understanding how pathogens reprogram the metabolic flux of the carbohydrate’s metabolism in detriment of the plant growth and yield demands [1, 8, 42, 54]. From the metabolic perspective, several pathogens rapidly metabolize sucrose through invertase enzymes which hydrolyze sucrose to fructose and glucose increasing the hexoses pool [8, 14, 55]. Metabolites such as fructose, glucose, and hexoses are energetic substrates for other metabolic pathways more complex that under biotic stress those molecules become a nutrient source for pathogens; however, alterations in the sugar concentrations induce the expression of defense genes and cell death considering that sugars act as signaling molecules to regulate the expression of some genes [56]. In the case of foliar pathogens, increases on the invertases activities cause changes in the source-sink relationship dynamic [14, 23, 57].
On the other hand, studies have reported that the damage caused by pathogens on leaves led to significant reductions in the net CO2 assimilation rate (A), stomatal closed (gs), and transpiration rate (E), as well as alteration in plant water balance and foliar temperature [7, 8, 52, 58, 59, 60]. In the case of biotrophic fungi as Hemileia vastatrix, Austropuccinia psidii, and Phakopsora pachyrhizi infecting coffee, eucalyptus, and soybean, respectively, after evidencing symptoms, experiments have demonstrated reductions between 20 and 50% in A, while gs and E showed higher reductions than A in leaves with severity oscillated between 30 and 50% [45, 61, 62].
Studies focused on energy dissipation through CF have allowed an understanding of the physiological events that happened during the asymptomatic and symptomatic disease phases. It is well-known that the Fv/Fm index is the most extensively utilized chlorophyll a fluorescence parameter stress level determination of abiotic and biotic factors [2]. Under non-stressed conditions, healthy leaves show Fv/Fm values around 0.80–0.83, while inferior Fv/Fm values indicate that a proportion of photosystem II (PSII) reaction centers have been harmed, which induces the photo-inhibitory effect on the photosynthetic machinery and is often led to oxidative stress on plants [63, 64]. In practice, the Fv/Fm parameter is a powerful tool for judging plant photochemical capacity because it acts as a stress indicator for plants; in other words, Fv/Fm measures the operational capacity of the leaf to perform photosynthesis [2, 5, 63, 64].
In the plant pathology field, the use of Fv/Fm has been efficient to measure the pathogen infection damage on the photosynthetic response depending on pathogen lifestyles [10]. However, CF parameters related to photochemical and non-photochemical energy dissipation also have showed interesting findings in plants infected. For instance, in coffee plants with rust symptoms, the values of the yield for dissipation by down-regulation [Y(NPQ) = (Fs/Fm′) – (Fs/Fm)] and the yield for other non-photochemical (non-regulated) losses [Y(NO) = Fs/Fm] were lower and higher, respectively, for the inoculated plants compared to non-inoculated plants, suggesting that H. vastatrix after the plant cell colonization reduces the protection capacity of the photosynthetic machinery through antioxidative pathways and inducing a high energy dissipation by heat [65]. In the case of plant virus, high NPQ values showed to be more efficient for the detection of Potato virus Y in tobacco plants overproducing endogenous cytokinins [66]. Based on studies performed until now, we can confirm that the CF is a methodology efficient for plant-pathogen interaction studies and with high potential of adaptation in the plant phenotyping approaches.
In the plant resistance field, the photosynthetic damage leads to intrinsic reductions in the defense capacity against the pathogen, and it can reach a higher intensification when abiotic stress factors such as drought, high temperature, or nutritional deficiency/excess participate along the biotic interaction [8, 67, 68]. As known, studies demonstrated that pathogens secret their effectors for linking to receptor specifics in chloroplasts looking for a reduction drastic in the ROS controlling the plant defense mechanisms, suggesting the crucial role of the photosynthetic machinery in the basal plant resistance against pathogen infection [69]. In this sense, the manipulation of photosynthetic activity using photosynthesis inhibitor-specific (DCMU) in wheat cultivars with differential basal resistance to Pyricularia oryzae showed increases in the blast severity in both cultivars as a consequence of a low photosynthetic activity affecting the enzymatic responses related to plant resistance such as phenylalanine ammonia-lyase (PAL) and reinforced the concept that photosynthesis was important for wheat resistance to blast [70].
In short, photosynthesis is affected by pathogen infections, and their effects led to reductions in CO2 assimilation, losses in growth, and crop yield, suggesting that just like abiotic stress, biotic factors threaten food production, as has been reported from the famine in Ireland at XVIII caused by the potato blight epidemic. For the above reasons, deep knowledge about the pathogen strategies to cause disease in plants and how they affect plant metabolism is crucial to designing management alternatives in all fields of agronomy.
4. CF tool to study the plant-pathogen interaction
The use of CF tools in recent years has revealed the utility of this tool from a plant pathology perspective, and CF imaging (CFI) techniques have been used in several plant pathology interactions. However, the equipment for CFI can be expensive, and it is necessary to handle due to the dark adaptation, increasing the time required with a large numbers of plants to test [6]. Today, portable instruments are commercially available being used at field conditions. For instance, CF using the OJIP-test, that is, an induction curve from the O-step to the J-step reflects high-order nonlinear dynamics of PSII resulting from light excitation, energy transfer, energy dissipation, and photochemical reactions (Table 1) [33]. As a result, OJIP-test is fast, non-invasive, and sensitive technic [6, 11], becoming an alternative for physiological and plant pathogen studies. Also, this technique allows screening and phenotyping large number of plants (e.g., approximately 500 plants per day) under field conditions, as was reported by Ajigboye et al. [71].
Both techniques offer important information on the PSII damage caused by the infection of pathogens in plants; however, CFI has been more frequently used to detect CF changes in response to foliar diseases in different genotypes due to their visual advantages [8, 40, 72]. In this context, CFI has been used to screen resistant wheat genotypes as well as the early detection of leaf rust caused by Puccinia triticina [73]. Kuckenberg et al. [74] observed alteration in F0 and Fm parameters in asymptomatic wheat leaves affected by powdery mildew and rust. Ralstonia solanacearum is a devastating disease for tomato seedling; in a study using CFI, Fv/Fm values between 0.55 and 0.65 were detected, and as a result, the infection was predicted 2 days before visual symptoms [75]. Likewise, CFI was used for the detection of potato virus X (PVX) in Nicotiana benthamiana plants; the study demonstrated that ΦPSII and NPQ parameters in infected areas were different significantly starting from the second day after the detection of the virus, considering the CFI as reliable pre-symptomatic detection a viral infection [76]. Also, the CFI was able to detect biotic and abiotic stress in tomato plants, as was reported by Moustaka et al. [77]. In this study, it was able to detect early biotic stress of Spodoptera exigua after 15 min of feeding and 30 min after Botrytis cinerea inoculation on the onset of water-deficit stress determining as a tool for early stress detection.
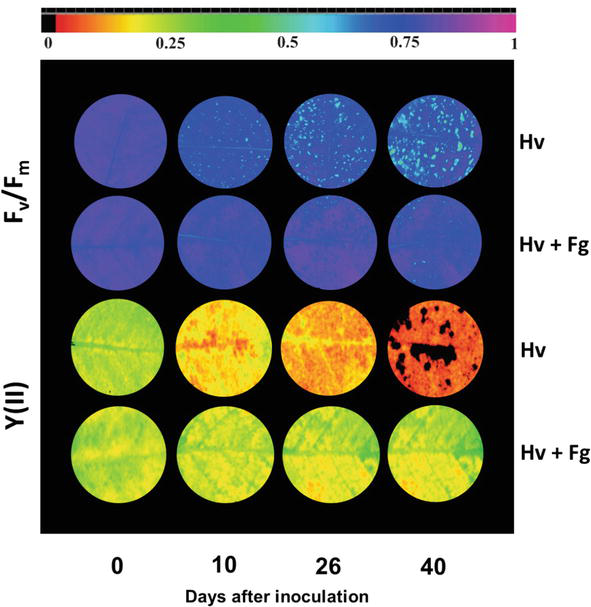
On the other hand, Fv/Fm and Y(II) parameters were sensible on coffee leaves inoculated with H. vastatrix and fungicide-sprayed ones (Figure 4). Those experimental results showed a significant reduction in Fv/Fm and Y(II) values, and they were identified in deep sky blue (Fv/Fm) and yellow-red areas [Y(II)] from 10 days after inoculation with H. vastatrix, suggesting that those CF parameters can be used to detect rust symptoms before reaching the incubation period. In coffee plants sprayed with fungicide, Fv/Fm and Y(II) images did not evidence changes in the color patterns and have been similar to control plants (0 days after inoculation), suggesting that the CFI method is an efficient technique for determining photosynthetic alterations caused by H. vastatrix as well as effects induced by the fungicide application on the pathogen and the plant, in parallel.
Figure 4.
The maximum quantum yield of PSII (Fv/Fm) and the effective PSII quantum yield [Y(II)] images in coffee plants infected with Hemileia vastatrix (Hv) sprayed with fungicide (Hv + Fg). The color bar represents the scale from near zero (dark orange) to near one (dark violet). Image supplied by Carlos Eduardo Aucique-Perez.
The combination of the CFI with other techniques allows an important way to study plant-pathogen interaction. In a study, combining CFI and leaf thermography from thermal infrared (TIR) imaging, among sweet potatoes infected by Sweet potato feathery mottle virus (SPFMV, genus Potyvirus) and Sweet potato chlorotic stunt virus (SPCSV, genus Crinivirus), demonstrated that the Fv/Fm and qP were the most sensitive parameters for the quantification of virus effects [78]. In oil palms affected with bud rot and lethal wilt, using several CF parameters showed anomalies in the photosynthetic system due to reductions in Fv/Fm and ΦPSII values, as well as increases in the leaf temperature in response to both diseases [79]. At field conditions, a study carried out by Mahlein et al. [80], using a combination of three types of sensors—infrared thermography, CFI, and hyperspectral imaging—symptoms caused by Fusarium graminearum and Fusarium culmorum were detected successfully. Additionally, the disruption in photosynthetic activity was confirmed through the measurement of Fm in spikelets at 5 dai.
The detection of some diseases in the most cases results in a difficult task due to the complexity between symptomatology observed. In this respect, the combination of CFI and ROS activities detects brown spot and anthracnose in cucumber plants. The difference of the activity levels of the ROS-scavenging enzymes and CFI parameters discriminated cucumber diseases [81]. Likewise, an important disease in citrus such as Citrus Huanglongbing (HLB) had been rapidly detected with high accuracy with the combination of reflectance images and multicolor fluorescence images, which relate to photosynthesis and secondary metabolites [82]. The study demonstrated that the combination of the techniques can effectively detect HLB disease in different infected statuses and cultivars, making it a promising tool for high-throughput HLB disease detection in citrus orchards. Currently, the increases in the interest on artificial intelligent (IA) in the recent years demonstrated the versatility of the CFI for the development of possible tools that discriminate biotic stress. Recently, Sapoukhina et al. [83] proposed a new methodology to develop a data set to generate images from CFI of plants infected by Pseudomonas syringae pv. in tomatoes for an automated lesion annotation applied in deep learning, suggesting that IA technology can help to improve the detection levels of diseases and their quantification.
On the other hand, the CF by OJIP-test has been used in several studies to determinate the effects over PSII performance. In this case, Ajigboye et al. [11] using CF determines that existing changes related to the maximum efficiency of PSII photochemistry (Fv′/Fm′), as well as flux of dissipated (DIo/RC), trapped (TRo/RC), or absorbed (ABS/RC) energy per active reaction centers during the attack of necrotrophic pathogens such as Oculimacula spp., F. culmorum, or F. avenaceum. The use of CF measurements and confocal laser-scanning microscopy was used for the detection of Rosellinia necatrix that produce white root rot (WRR) disease [84]. This study reveals early stages of WRR disease affect leaf photochemistry before aboveground symptoms appear. Notably, there were significant reductions in photosystem-II trapping efficiency (Fv′/Fm′) and the minimal fluorescence yield (Fs/F0).
In another study, the use of OJIP-test showed that DIo/RC parameter is the best indicator for the diagnosis of Bursaphelenchus xylophilus that is a pinewood nematode (PWN) of Pinus thunbergia [85], suggesting that this method may assist in disease detection localized in other plant organs, such as roots. In other interaction, it was demonstrated that Fv/F0, F0, Fm, and ABS/RC parameters were useful for identifying the physiological changes produced by F. verticillioides infection in maize plants [86]. Furthermore, the structural and functional features from OJIP-test was used for the development of a discriminant model for rapid HLB detection [87]. In this study, healthy, asymptomatic, and symptomatic HLB-infected leaves of two different citrus cultivars produced specific changes in the fluorescence patterns. Specifically, HLB-infected symptomatic leaves showed significant reduction in Fv/F0, ΦEo, ψEo, ΦRo, ΦPo, PIABS, PItotal, Fm, RE0/RC and ET0/RC, and a significant increase in TR0/RC, F0, ABS/RC, and DI0/RC, see Tables 1 and 2 for details. This research can potentially be used for high-throughput HLB detection when combined with advanced machine learning techniques, offering a promising approach to address the challenges posed by this devastating citrus disease. Overall, these studies have shown that the OJIP-test is a powerful tool to know with higher detail the functional damages caused by pathogens on the photosynthetic machinery.
The CF methodology has been successful in several studies to determine the effect of fungicides on PSII activity during disease control, as mentioned above (Figure 4). For instance, the use a fungicide such as isopyrazam and epoxiconazole increased PSII efficiency, ameliorate biomass and grain yield, and reduce disease pressure. Also, the two fungicides increased the efficiency of PSII photochemistry (Fv’/Fm′), as well as improved photosynthetic gas exchange and increased rates of electron transport [71]. In another study, the application of dimethyl sulfoxide (DMSO) in Solanum lycopersicum and Lactuca sativa plants for the control of Botrytis cinerea did not change the chlorophyll fluorescence (Fv/Fm and ΦPSII) [88]. However, one research determined negative alterations on photosynthetic parameters in coffee plants sprayed with tebuconazole and trifloxystrobin, which caused reductions in Fv/Fm, ΦPSII, and ETR, suggesting that there are fungicides that limit the photosynthetic capacity of plants despite disease management [45]. Therefore, the CF methodology contributed to the determination of the physiological effects of fungicides on plants.
Additionally, this tool can be used for phenotyping in breeding programs. In this context, a study conducted by Suarez et al. [89] using CF determination showed that common bean lines induced by biotic stress can be classified as resistant or susceptible phenotypes according to the changes in F0, Fm, and consequent alteration in Fv/Fm. In barley genotypes infected with Fusarium culmorum, alterations in the energy flux associated with the energy dissipation at the PSII (<DI0/RC), limitations in the energy absorption by PSII reaction centers (<TR0/RC), and low energy used for electron transport (<ET0/RC) were determined factors to demonstrate that this response pattern can be used for the selection of barley doubled haploid lines resistance [90].Those studies indicated the adaptability of CF or CFI techniques associated with plant pathology for the identification of biotic stress, phenotyping, diseases management, and how those technics can be combined with others.
The CF is a versatile technique that offers valuable insights into the efficiency and performance of the photosynthetic apparatus. With advancements in methodology and instrumentation, the CF has become an indispensable tool in plant science research, specifically in the plant pathology field.
The measurement setup, parameters obtained, and data interpretation are crucial aspects of the Chl a fluorescence methodology. Researchers employ specialized fluorometers, measure fluorescence parameters such as Fv/Fm, ΦPSII, and NPQ , and interpret the obtained data in conjunction with other physiological measurements for biotic stress detection. However, other parameters have shown high sensitivity depending on the pathosystem, so more studies are necessary for confirming responses and developing new research approaches to improve our knowledge about pathogen infection strategies. Plant physiologists and plant pathologists, as well as plant breeders, hope that, in the next few years, new advances in CF technology will allow a higher understanding of plant responses under pathogen infection, as well as become a powerful tool to support the disease management in issues related to fast detection, evaluation of efficiency in control strategies, and also improving the selection criteria for resistant phenotypes to disease within plant breeding programs.
The authors are thankful to Fondo de Investigación para la Agrobiodiversidad, Semillas y Agricultura sustentable (FIASA), grant number FIASA-CA-2023-010.
1.Bolton MD. Primary metabolism and plant defense—fuel for the fire. Molecular Plant-Microbe Interactions. 2009;22(5):487-497. DOI: 10.1094/MPMI-22-5-0487
2.Baker NR. Chlorophyll fluorescence: A probe of photosynthesis in vivo. Annual Review of Plant Biology. 2008;59:89-113. DOI: 10.1146/annurev.arplant.59.032607.092759
3.Spreitzer RJ, Salvucci ME. Rubisco: Structure, regulatory interactions, and possibilities for a better enzyme. Annual Review of Plant Biology. 2002;53(1):449-475. DOI: 10.1146/annurev.arplant.53.100301.135233
4.Leister D. Enhancing the light reactions of photosynthesis: Strategies, controversies and perspectives. Molecular Plant. 2023;14:4-22. DOI: 10.1016/j.molp.2022.08.005
5.Maxwell K, Johnson GN. Chlorophyll fluorescence-a practical guide. Journal of Experimental Botany. 2000;51(345):659-668. DOI: 10.1093/jexbot/51.345.659
6.Murchie EH, Lawson T. Chlorophyll fluorescence analysis: A guide to good practice and understanding some new applications. Journal of Experimental Botany. 2013;64(13):3983-3998. DOI: 10.1093/jxb/ert208
7.Aucique-Perez CE, Rodrigues FÁ, Moreira WR, DaMatta FM. Leaf gas exchange and chlorophyll a fluorescence in wheat plants supplied with silicon and infected with Pyricularia oryzae. Phytopathology. 2014;104(2):143-149. DOI: 10.1094/PHYTO-06-13-0163-R
8.Aucique-Pérez CE, Rios VS, Neto LBC, Rios JA, Martins SCV, Rodrigues FÁ. Photosynthetic changes in wheat cultivars with contrasting levels of resistance to blast. Journal of Phytopathology. 2020;168(11-12):721-729. DOI: 10.1111/jph.12952
9.Barón M, Flexas J, Delucia EH. Photosynthetic responses to biotic stress. In: Flexas J, Loreto F, Medrano H, editors. Terrestrial Photosynthesis in a Changing Environment. A Molecular, Physiological and Ecological Approach. Cambridge, UK: Cambridge University Press; 2012. pp. 331-350
10.Pérez-Bueno ML, Pineda M, Barón M. Phenotyping plant responses to biotic stress by chlorophyll fluorescence imaging. Frontiers in Plant Science. 2019;10:1135. DOI: 10.3389/fpls.2019.01135
11.Ajigboye OO, Bousquet L, Murchie EH, Ray RV. Chlorophyll fluorescence parameters allow the rapid detection and differentiation of plant responses in three different wheat pathosystems. Functional Plant Biology. 2016;43(4):356-369. DOI: 10.1071/FP15280
12.Govindjee. Chlorophyll a fluorescence: A bit of basics and history. In: Chlorophyll a fluorescence: A signature of photosynthesis. Dordrecht: Springer; 2004. pp. 1-41. DOI: 10.1007/z978-1-4020-3218-9_1
13.Schreiber U. Pulse-amplitude-modulation (PAM) fluorometry and saturation pulse method: An overview. Chlorophyll a Fluorescence. 2004;19:279-319. DOI: 10.1007/978-1-4020-3218-9_11
14.Rios JA, Aucique-Pérez CE, Debona D, Cruz Neto LB, Rios VS, Rodrigues FA. Changes in leaf gas exchange, chlorophyll a fluorescence and antioxidant metabolism within wheat leaves infected by Bipolaris Sorokiniana. Annals Applied Biology. 2017;170(2):189-203. DOI: 10.1111/aab.12328
15.Bauriegel E, Herppich WB. Hyperspectral and chlorophyll fluorescence imaging for early detection of plant diseases, with special reference to fusarium spec. infections on wheat. Agriculture. 2014;4(1):32-57. DOI: 10.3390/agriculture4010032
16.Bürling K, Hunsche M, Noga G. Use of blue–green and chlorophyll fluorescence measurements for differentiation between nitrogen deficiency and pathogen infection in winter wheat. Journal of Plant Physiology. 2011;168(14):1641-1648. DOI: 10.1016/j.jplph.2011.03.016
17.Scholes JJD, Rolfe SA. Photosynthesis in localised regions of oat leaves infected with crown rust (Puccinia Coronata): Quantitative imaging of chlorophyll fluorescence. Planta. 1996;199(4):573-582. DOI: 10.1007/BF00195189
18.Brabandt H, Bauriegel E, Gärber U, Herppich WB. ФPSII and NPQ to evaluate Bremia lactucae-infection in susceptible and resistant lettuce cultivars. Scientia Horticulturae. 2014;180:123-129. DOI: 10.1016/j.scienta.2014.10.012
19.Rodríguez-Moreno L, Pineda M, Soukupová J, Macho AP, Beuzón CR, Barón M, et al. Early detection of bean infection by Pseudomonas syringae in asymptomatic leaf areas using chlorophyll fluorescence imaging. Photosynthesis Research. 2008;96(1):27-35. DOI: 10.1007/s11120-007-9278-6
20.Christov I, Stefanov D, Velinov T, Goltsev V, Georgieva K, Abracheva P, et al. The symptomless leaf infection with grapevine leafroll associated virus 3 in grown in vitro plants as a simple model system for investigation of viral effects on photosynthesis. Journal of Plant Physiology. 2007;164(9):1124-1133. DOI: 10.1016/j.jplph.2005.11.016
21.Montero R, Pérez-Bueno ML, Barón M, Florez-Sarasa I, Tohge T, Fernie AR, et al. Alterations in primary and secondary metabolism in Vitis vinifera ‘malvasía de Banyalbufar’upon infection with grapevine leafroll-associated virus 3. Physiology Plant. 2016;157(4):442-452. DOI: 10.1111/ppl.12440
22.Guidi L, Lo Piccolo E, Landi M. Chlorophyll fluorescence, photoinhibition and abiotic stress: Does it make any difference the fact to be a C3 or C4 species? Frontiers in Plant Science. 2019;10:174. DOI: 10.3389/fpls.2019.00174
23.Roháček K, Soukupová J, Barták M. Chlorophyll fluorescence: A wonderful tool to study plant physiology and plant stress. In: Schoefs B, editor. Plant cell Compartments- Selected Topics. Kerala India: Research Signpost; 2008. pp. 41-104
24.Großkinsky DK, Syaifullah SJ, Roitsch T. Integration of multi-omics techniques and physiological phenotyping within a holistic phenomics approach to study senescence in model and crop plants. Journal of Experimental Botany. 2018;69(4):825-844. DOI: 10.1093/jxb/erx333
25.Guo Y, Tan J. Recent advances in the application of chlorophyll a fluorescence from photosystem II. Photochemestry Photobiology. 2015;91(1):1-14. DOI: 10.1111/php.12362
26.Schreiber U. Chlorophyll fluorescence: New instruments for special applications. In: Garab G, editor. Photosynthesis: Mechanisms and Effects, Proceedings of the XIth International Congress on Photosynthesis; August 17-22; Budapest, Hungary. Vol. I–V. Dordrecht: Springer; 1998. pp. 4253-4258. DOI: 10.1007/978-94-011-3953-3_984
27.Stirbet A. On the relation between the Kautsky effect (chlorophyll a fluorescence induction) and photosystem II: Basics and applications of the OJIP fluorescence transient. Journal of Photochemistry and Photobiology B: Biology. 2011;104(1-2):236-257. DOI: 10.1016/j.jphotobiol.2010.12.010
28.Strasser RJ, Tsimilli-Michael M, Srivastava A. Analysis of the chlorophyll a fluorescence transient. In: Chlorophyll a Fluorescence. Dordrecht: Springer; 2004. pp. 321-362. DOI: 10.1007/978-1-4020-3218-9_12
29.Stirbet A, Govindjee. Chlorophyll a fluorescence induction: A personal perspective of the thermal phase, the J–I–P rise. Photosynthesis Research. 2012;113:15-61. DOI: 10.1007/s11120-012-9754-5. DOI: 10.1007/s11120-012-9754-5
30.Strasser RJ, Tsimilli-Michael M, Qiang S, Goltsev V. Simultaneous in vivo recording of prompt and delayed fluorescence and 820-nm reflection changes during drying and after rehydration of the resurrection plant Haberlea rhodopensis. Biochimica Biophysica Acta (BBA)-Bioenergetics. 2010;1797:1313-1326. DOI: 10.1016/j.bbabio.2010.03.008
31.Stirbet A, Lazár D, Kromdijk J, Govindjee. Chlorophyll a fluorescence induction: Can just a one-second measurement be used to quantify abiotic stress responses? Photosynthetica. 2018;56:86-104. DOI: 10.1007/s11099-018-0770-3
32.Bussotti F, Desotgiu R, Pollastrini M, Cascio C. The JIP test: A tool to screen the capacity of plant adaptation to climate change. Scandinavian Journal of Forest Research. 2010;25:43-50. DOI: 10.1080/02827581.2010.485777
33.Strasser RJ, Srivastava A, Tsimilli-Michael M. The fluorescence transient as a tool to characterize and screen photosynthetic samples. Probing Photosynthesis: Mechanism, Regulation & Adaptation. 2000;25:445-483
34.Kalaji HM, Schansker G, Brestic M, Bussotti F, Calatayud A, Ferroni L, et al. Frequently asked questions about chlorophyll fluorescence, the sequel. Photosynthesis Research. 2017;132:13-66. DOI: 10.1007/s11120-016-0318-y
35.Krause GH, Weis E. Chlorophyll fluorescence and photosynthesis: The basics. Annual Review of Plant Physiology and Plant Molecular Biology. 1991;42(1):313-349. DOI: 10.1146/annurev.pp.42060191.001525
36.Nishiyama Y, Murata N. Revised scheme for the mechanism of photoinhibition and its application to enhance the abiotic stress tolerance of the photosynthetic machinery. Applied Microbiology and Biotechnology. 2014;98:8777-8796. DOI: 10.1007/s00253-014-6020-0
37.Tietz S, Hall CC, Cruz JA, Kramer DM. NPQ (T): A chlorophyll fluorescence parameter for rapid estimation and imaging of non-photochemical quenching of excitons in photosystem-II-associated antenna complexes. Plant Cell & Environment. 2017;40(8):1243-1255. DOI: 10.1111/pce.12924
38.Goodwin RH. Fluorescent substances in plants. Annual Review of Plant Physiology. 1953;4(1):283-304. DOI: 110.1146/annurev.pp.04.060153.001435
39.Nedbal L, Whitmarsh J. Chlorophyll fluorescence imaging of leaves and fruits. In: Chlorophyll a Fluorescence: A Signature of Photosynthesis. Dordrecht: Springer; 2004. pp. 389-407. DOI: 10.1007/978-1-4020-3218-9_14
40.Rolfe SA, Scholes JD. Chlorophyll fluorescence imaging of plant–pathogen interactions. Protoplasma. 2010;247(3-4):163-175. DOI: 10.1007/s00709-010-0203-z
41.Gorbe E, Calatayud A. Applications of chlorophyll fluorescence imaging technique in horticultural research: A review. Scientia Horticulturae (Amsterdam). 2012;138:24-35. DOI: 10.1016/j.scienta.2012.02.002
42.Berger S, Sinha AK, Roitsch T. Plant physiology meets phytopathology: Plant primary metabolism and plant–pathogen interactions. Journal of Experimental Botany. 2007;58(15-16):4019-4026. DOI: 10.1093/jxb/erm298
43.Vleeshouwers VGAA, Oliver RP. Effectors as tools in disease resistance breeding against biotrophic, hemibiotrophic, and necrotrophic plant pathogens. Molecular Plant-Microbe Interactions. 2014;27(3):196-206. DOI: 10.1094/MPMI-10-13-0313-IA
44.Mapuranga J, Zhang N, Zhang L, Chang J, Yang W. Infection strategies and pathogenicity of biotrophic plant fungal pathogens. Frontiers in Microbiology. 2022;13:799396. DOI: 10.3389/fmicb.2022.799396
45.Salcedo-Sarmiento S, Aucique-Pérez CE, Silveira PR, Colmán AA, Silva AL, Mansur PSC, et al. Elucidating the interactions between the rust Hemileia vastatrix and a Calonectria mycoparasite and the coffee plant. Iscience. 2021;24(4):102352
46.Chen H, He S, Zhang S, Li W, Liu S. The Necrotroph Botrytis cinerea BcSpd1 plays a key role in modulating both fungal pathogenic factors and plant disease development. Frontiers in Plant Science. 2022;13:820767. DOI: 10.3389/fpls.2022.820767
47.Belisário R, Aucique-Pérez CE, Abreu LM, Salcedo SS, de Oliveira WM, Furtado GQ. Infection by Neopestalotiopsis spp. occurs on unwounded eucalyptus leaves and is favoured by long periods of leaf wetness. Plant Pathology. 2020;69(2):194-204. DOI: 10.1111/ppa.13132
48.Cho Y. How the necrotrophic fungus Alternaria brassicicola kills plant cells remains an enigma. Eukaryotic Cell. 2015;14(4):335-344. DOI: 10.1128/ec.00226-14
49.Glazebrook J. Contrasting mechanisms of defense against biotrophic and necrotrophic pathogens. Annual Review of Phytopathology. 2005;43:205-227. DOI: 0.1146/annurev.phyto.43.040204.135923
50.Koeck M, Hardham AR, Dodds PN. The role of effectors of biotrophic and hemibiotrophic fungi in infection. Cell Microbiology. 2011;13(12):1849-1857. DOI: 10.1111/j.1462-5822.2011.01665.x
51.Cruz MFA, Rios JA, Araujo L, Ávila RF. Infection process of Pyricularia oryzae on the leaves of wheat seedlings. Tropical Plant Pathology. 2016;41:123-127. DOI: 10.1007/s40858-016-0068-6
52.Aucique-Pérez CE, de Menezes Silva PE, Moreira WR, DaMatta FM, Rodrigues FÁ. Photosynthesis impairments and excitation energy dissipation on wheat plants supplied with silicon and infected with Pyricularia oryzae. Plant Physiology and Biochemistry. 2017;121:196-205. DOI: 10.1016/j.plaphy.2017.10.023
53.Mittler R, Vanderauwera S, Suzuki N, Miller G, Tognetti V, Vandepoele K, et al. ROS signaling: The new wave? Trends in Plant Science. 2011;16:300-309. DOI: 10.1016/j.tplants.2011.03.007
54.Bispo WMS, Araujo L, Ávila RT, DaMatta FM, Rodrigues FÁ. Mango resistance against Ceratocystis fimbriata is impaired by local starch mobilization. Tropical Plant Pathology. 2016;41:225-236. DOI: 10.1007/s40858-016-0092-6
55.Parker D, Beckmann M, Zubair H, Enot DP, Caracuel-Rios Z, Overy DP, et al. Metabolomic analysis reveals a common pattern of metabolic re-programming during invasion of three host plant species by Magnaporthe grisea. The Plant Journal. 2009;59(5):723-737. DOI: 10.1111/j.1365-313X.2009.03912.x
56.Koch KE. Carbohydrate-modulated gene expression in plants. Annual Review of Plant Physiology and Plant Molecular Biology. 1996;47(1):509-540. DOI: 10.1146/annurev.arplant.47.1.509
57.Essmann J, Schmitz-Thom I, Schön H, Sonnewald S, Weis E, Scharte J. RNA interference-mediated repression of cell wall invertase impairs defense in source leaves of tobacco. Plant Physiology. 2008;147(3):1288-1299. DOI: 10.1104/pp.108.121418
58.Ayres PG. Responses of stomata to pathogenic microorganisms. In: Stomatal Physiology. Cambridge, UK: Cambridge University Press; 1981. pp. 205-211
59.Berdugo CA, Zito R, Paulus S, Mahlein A. Fusion of sensor data for the detection and differentiation of plant diseases in cucumber. Plant Pathology. 2014;63(6):1344-1356. DOI: 10.1111/ppa.12219
60.Bermudez-Cardona MB, Filho JAW, Rodrigues FA. Leaf gas exchange and chlorophyll a fluorescence in maize leaves infected with Stenocarpella macrospora. Phytopathology. 2015;105(1):26-34. DOI: 10.1094/PHYTO-04-14-0096-R
61.Alves AA, da Guimarães LM d S, Chaves AR d M, DaMatta FM, Alfenas AC. Leaf gas exchange and chlorophyll a fluorescence of Eucalyptus urophylla in response to Puccinia Psidii infection. Acta Physiologiae Plantarum. 2011;33:1831-1839. DOI: 10.1007/s11738-011-0722-z
62.Einhardt AM, Ferreira S, Souza GMF, Mochko ACR, Rodrigues FA. Cellular oxidative damage and impairment on the photosynthetic apparatus caused by Asian soybean rust on soybeans are alleviated by nickel. Acta Physiologiae Plantarum. 2020;42:1-13. DOI: 10.1007/s11738-020-03108-x
63.Muller P, Li X-PP, Niyogi KK, Müller P, Li X-PP, Niyogi KK. Non-photochemical quenching. A response to excess light energy. Plant Physiology. 2001;125(4):1558-1566. DOI: 10.1104/pp.125.4.1558
64.Baker NR, Rosenqvist E. Applications of chlorophyll fluorescence can improve crop production strategies: An examination of future possibilities. Journal of Experimental Botany. 2004;55(403):1607-1621. DOI: 10.1093/jxb/erh196
65.Honorato J, Zambolim L, Duarte HSS, Aucique-Pérez CE, Rodrigues FÁ. Effects of epoxiconozale and pyraclostrobin fungicides in the infection process of Hemileia vastatrix on coffee leaves as determined by chlorophyll a fluorescence imaging. Journal of Phytopathology. 2015;163(11-12):968-977. DOI: 10.1111/jph.12399
66.Spoustová P, Synková H, Valcke R, Čeřovská N. Chlorophyll a fluorescence as a tool for a study of the potato virus Y effects on photosynthesis of nontransgenic and transgenic P Ssu-Ipt tobacco. Photosynthetica. 2013;51(2):191-201. DOI: 10.1007/s11099-013-0023-4
67.Debona D, Rios JA, Nascimento KJT, Silva LC, Rodrigues FA. Influence of magnesium on physiological responses of wheat infected by Pyricularia oryzae. Plant Pathology. 2016;65(1):114-123. DOI: 10.1111/ppa.12390
68.Silva BN, Oliveira LM, Mochko ACR, Chaves JAA, Aucique-Pérez CE, Rodrigues FA. Physiological and biochemical changes in wheat plants infected by Pyricularia Oryzae caused by thermal oscillations. Physiological and Molecular Plant Pathology. 2021;115:101646. DOI: 10.1016/j.pmpp.2021.101646
69.de Torres ZM, Littlejohn G, Jayaraman S, Studholme D, Bailey T, Lawson T, et al. Chloroplasts play a central role in plant defence and are targeted by pathogen effectors. Nature Plants. 2015;1(6):1-10. DOI: 10.1111/pce.12924
70.Oliveira TB, Aucique-Pérez CE, Einhardt AM, Rodrigues FÁ. Wheat susceptibility to blast is enhanced by a photosynthetic inhibitor. Journal of Phytopathology. 2021;169(10):630-639. DOI: 10.1111/jph.13034
71.Ajigboye OO, Murchie E, Ray RV. Foliar application of isopyrazam and epoxiconazole improves photosystem II efficiency, biomass and yield in winter wheat. Pesticide Biochemistry and Physiology. 2014;114:52-60. DOI: 10.1016/j.pestbp.2014.07.003
72.Rousseau C, Belin E, Bove E, Rousseau D, Fabre F, Berruyer R, et al. High throughput quantitative phenotyping of plant resistance using chlorophyll fluorescence image analysis. Plant Methods. 2013;9(1):17. DOI: 10.1186/1746-4811-9-17
73.Bürling K, Hunsche M, Noga G. Quantum yield of non-regulated energy dissipation in PSII (Y (NO)) for early detection of leaf rust (Puccinia triticina) infection in susceptible and resistant wheat (Triticum Aestivum L.) cultivars. Precision Agriculture. 2010;11(6):703-716. DOI: 10.1007/s11119-010-9194-1
74.Kuckenberg J, Tartachnyk I, Schmitz-Eiberger M, Noga G. Early detection of leaf rust and powdery mildew infections on wheat leaves by PAM fluorescence imaging. Precision Agriculture ‘07. 2007;8:515-521. DOI: 10.3920/978-90-8686-603-8
75.Kim JH, Bhandari SR, Chae SY, Cho MC, Lee JG. Application of maximum quantum yield, a parameter of chlorophyll fluorescence, for early determination of bacterial wilt in tomato seedlings. Horticulture, Environment, and Biotechnology. 2019;60:821-829. DOI: 10.1007/s13580-019-00182-0
76.Grishina A, Sherstneva O, Grinberg M, Zdobnova T, Ageyeva M, Khlopkov A, et al. Pre-symptomatic detection of viral infection in tobacco leaves using pam fluorometry. Plants. 2021;10(12):2782. DOI: 10.3390/plants10122782
77.Moustaka J, Moustakas M. Early-stage detection of biotic and abiotic stress on plants by chlorophyll fluorescence imaging analysis. Biosensors. 2023;13(8):796. DOI: 10.3390/bios13080796
78.Wang L, Poque S, Valkonen JPT. Phenotyping viral infection in sweetpotato using a high-throughput chlorophyll fluorescence and thermal imaging platform. Plant Methods. 2019;15:1-14. DOI: 10.1186/s13007-019-0501-1
79.Aucique-Perez CE, Daza ES, Ávila-Diazgranados RA, Romero HM. Chlorophyll a fluorescence and leaf temperature are early indicators of oil palm diseases. Scientia Agricola. 2019;77:e20180106. DOI: 10.1590/1678-992X-2018-0106
80.Mahlein AK, Alisaac E, Al Masri A, Behmann J, Dehne HW, Oerke EC. Comparison and combination of thermal, fluorescence, and hyperspectral imaging for monitoring fusarium head blight of wheat on spikelet scale. Sensors. 2019;19(10):2281. DOI: 10.3390/s19102281
81.Sun Y, Liu T, Wang X, Hu Y. Chlorophyll fluorescence imaging combined with active oxygen metabolism for classification of similar diseases in cucumber plants. Agronomy. 2023;13(3):700. DOI: 10.3390/agronomy13030700
82.He C, Li X, Liu Y, Yang B, Wu Z, Tan S, et al. Combining multicolor fluorescence imaging with multispectral reflectance imaging for rapid citrus huanglongbing detection based on lightweight convolutional neural network using a handheld device. Computers and Electronics in Agriculture. 2022;194:106808. DOI: 10.1016/j.compag.2022.106808
83.Sapoukhina N, Boureau T, Rousseau D. Plant disease symptom segmentation in chlorophyll fluorescence imaging with a synthetic dataset. Frontiers in Plant Science. 2022;13:969205. DOI: 10.3389/fpls.2022.969205
84.Martínez-Ferri E, Zumaquero A, Ariza MT, Barceló A, Pliego C. Nondestructive detection of white root rot disease in avocado rootstocks by leaf chlorophyll fluorescence. Plant Disease. 2016;100(1):49-58. DOI: 10.1094/PDIS-01-15-0062-RE
85.Liu F, Zhang M, Hu J, Pan M, Shen L, Ye J, et al. Early diagnosis of pine wilt disease in Pinus thunbergii based on chlorophyll fluorescence parameters. Forests. 2023;14(1):154. DOI: 10.3390/f14010154
86.Baghbani F, Lotfi R, Moharramnejad S, Bandehagh A, Roostaei M, Rastogi A, et al. Impact of fusarium verticillioides on chlorophyll fluorescence parameters of two maize lines. European Journal of Plant Pathology. 2019;154:337-346. DOI: 10.1007/s10658-018-01659-x
87.Weng H, Liu Y, Captoline I, Li X, Ye D, Wu R. Citrus huanglongbing detection based on polyphasic chlorophyll a fluorescence coupled with machine learning and model transfer in two citrus cultivars. Computers and Electronics in Agriculture. 2021;187:106289. DOI: 10.1016/j.compag.2021.106289
88.Petruccelli V, Brasili E, Varone L, Valletta A, Pasqua G. Antifungal activity of dimethyl sulfoxide against Botrytis cinerea and phytotoxicity on tomato and lettuce plants. Plant Biosystems - An International Journal Dealing with All Aspects of Plant Biology. 2020;154(4):455-462. DOI: 10.1080/11263504.2020.1779846
89.Suárez JC, Vanegas JI, Contreras AT, Anzola JA, Urban MO, Beebe SE, et al. Chlorophyll fluorescence imaging as a tool for evaluating disease resistance of common bean lines in the western amazon region of Colombia. Plants. 2022;11(10):1371. DOI: 10.3390/plants11101371
90.Warzecha T, Skrzypek E, Adamski T, Surma M, Kaczmarek Z, Sutkowska A. Chlorophyll a fluorescence parameters of hulled and hull-less barley (Hordeum vulgare L.) DH lines inoculated with Fusarium culmorum. The Plant Pathology Journal. 2019;35(2):112. DOI: 10.5423/PPJ.OA.07.2018.0124
Written By
Carlos Eduardo Aucique-Perez and Andrea Elizabeth Román Ramos
Submitted: 16 August 2023Reviewed: 06 October 2023Published: 22 March 2024