Open Access is an initiative that aims to make scientific research freely available to all. To date our community has made over 100 million downloads. It’s based on principles of collaboration, unobstructed discovery, and, most importantly, scientific progression. As PhD students, we found it difficult to access the research we needed, so we decided to create a new Open Access publisher that levels the playing field for scientists across the world. How? By making research easy to access, and puts the academic needs of the researchers before the business interests of publishers.
We are a community of more than 103,000 authors and editors from 3,291 institutions spanning 160 countries, including Nobel Prize winners and some of the world’s most-cited researchers. Publishing on IntechOpen allows authors to earn citations and find new collaborators, meaning more people see your work not only from your own field of study, but from other related fields too.
Lokman Hekim Vocational and Technical Anatolian High School, which is located in Bulancak-Giresun in the Black Sea Region of Turkey, was selected to quantify its carbon footprint after previously conducting an awareness seminar. This study is divided into three parts. Firstly, pre-training was given to both students and teachers. Next, an awareness questionnaire was administered to determine their understanding of carbon footprints, climate change and global warming. The results showed that while the students were knowledgeable about climate change and global warming, they lacked sufficient understanding of carbon footprints. Secondly, a face-to-face measurement study was conducted with 295 students to calculate the annual average amount of CO2 emitted by them based on various categories. The results revealed that the students emitted an average of 7.43 ton of CO2e per year, with the highest amount of emissions (3 ton CO2e/year) being attributed to household factors, and 2.135 ton CO2e/year resulting from lifestyle habits. Finally, the institutional emission amounts from Scope 1, Scope 2, and Scope 3 were determined to be 85.4k, 16.7k, and 18.9k ton CO2e/year, respectively. Consequently, the total institutional carbon footprint of the high school was calculated to be 121k ton of CO2e/year.
Department of Environmental Engineering, Giresun University, Giresun, Turkey
*Address all correspondence to: basak.taseli@giresun.edu.tr
1. Introduction
The primary priority in reducing the impact of human activities on the environment is awareness, and it is important to measure the direct and indirect effects of human activities on the environment in order to increase awareness and create behavior change. Environmental education aims to raise awareness of individuals at all levels about their position and role in the environment, to provide them with as much information as possible about all factors affecting the environment, and to make them conscious through an educational process. Environmental education involves directing students toward projects where they can learn by experiencing and observing, and where they can think and produce solutions in a student-centered approach, rather than through superficial explanations [1, 2]. Inadequate environmental education negatively affects students’ attitudes toward the environment [3, 4].
Numerous studies have shown that carbon footprint is an effective tool in raising awareness about the impact of individual consumption habits on the environment [5, 6, 7, 8]. Conway [9] calculated the ecological footprint of the University of Toronto and investigated the changes in the ecological footprint on campus by developing different scenarios (such as generating their own electricity, using public transportation, and using recycled office materials). By presenting the numerical data they obtained from the study to university students, they created awareness about the ecological footprint and encouraged students to reduce their own ecological footprints.
A study was conducted at Akdeniz University Health Services Vocational School to calculate the carbon emissions resulting from personnel transportation and electricity consumption, which totaled 98,307 kg CO₂e (CO₂ equivalent). The study was further conducted to assess the carbon footprints of gasoline, diesel, and LPG vehicles by changing fuel types, with calculated values of 102,214 kg, 95,749 kg, and 100,427 kg, respectively. The observed differences in these values are attributed to the fuel types’ calorific values, chemical structures, and the engine types in which they are used. The study revealed that electricity consumption accounts for the largest share of the school’s carbon emissions, and reducing electricity consumption directly reduces emissions. The study emphasized that the school’s electricity consumption results from heating, cooling, lighting, office vehicles, and elevators. To reduce electricity consumption from heating and cooling, the study suggests applying thermal insulation to the building, replacing current air conditioning units with highly energy-efficient ones, and conducting awareness-raising training for staff and students. The study also proposes using photovoltaic solar panels and wind turbines to generate energy in a region that receives solar radiation, such as Antalya [10].
The primary carbon footprint of Erzincan Binali Yıldırım University was assessed using two different methods, namely Intergovernmental Panel on Climate Change (IPCC) Scope 1 and Department for Environment, Food and Rural Affairs (DEFRA). The IPCC Scope 1 approach yielded carbon footprints of 2753.2 tCO₂e (ton CO₂ equivalent) for 2019 and 2383.74 tCO₂e for 2020, with a reduction of 13.42% compared to 2019. The DEFRA conversion factor approach produced carbon footprints of 2314.53 tCO₂e for 2019 and 1826.53 tCO₂e for 2020, with a decrease of 21.08% compared to 2019. The decrease was attributed to the adoption of distance learning due to the Covid-19 pandemic and the warming weather resulting from global warming. The largest impact on the carbon footprint, following electricity-based emissions, was from natural gas consumption for heating, while the least impact was from gasoline consumption, according to the IPCC Scope 1 approach [11]. In contrast, the DEFRA conversion factor approach identified electricity and coal consumption as the highest and second-highest sources of carbon emissions, respectively, while gasoline consumption had the least impact, similar to the IPCC Scope 1 approach [12].
In another carbon footprint analysis conducted at Manisa Celal Bayar University, the annual carbon emissions of the university were calculated to be 8,953,906 ton of CO₂e. The majority of carbon emissions came from electricity consumption, which accounted for 7,865,721 ton of CO₂e, followed by coal with 613,701 ton of CO₂e, and the least amount of emissions were from gasoline consumption, which was 8223 ton of CO₂e. To reduce the carbon footprint of the university, several measures have been proposed, such as planting 4700 saplings on campus, launching the solar power plant project with renewable energy, demonstrating the senior management’s determination and support to reduce the university’s carbon footprint and promote sustainable resource use, conducting educational activities and projects to raise awareness in the fight against pollution, offering an elective course on environmental issues, nature conservation, global climate change, and sustainable use of natural resources in all departments of the university, and carrying out studies to save energy in electricity, heating, transportation, and water consumption [13].
In the study conducted by [14] at the Madrid University Forestry Faculty, which has 1150 students and 235 staff members, the total carbon footprint of the faculty was calculated as 2147 ton of CO2e per year, with Scope 1 emissions of 169 ton CO2e per year, Scope 2 emissions of 703 ton CO2e per year, and Scope 3 emissions of 1275 ton CO2e per year.
In another study conducted by [15] at the Mehmet Akif Ersoy University Bucak Health Vocational School, which has 357 students and 23 staff members, the total CO2e emissions from natural gas, electricity, and student and staff transportation were reported as 217,503 kg CO2e per year. Additionally, it was noted that heating from natural gas consumption had the biggest impact on carbon emissions, followed by emissions from electricity consumption, diesel, gasoline, and LPG vehicles, respectively.
In our study, we selected Lokman Hekim Vocational and Technical Anatolian High School located in Bulancak-Giresun, Turkey as the site for conducting awareness, individual carbon footprint, and institutional footprint studies. This was done after the school had previously conducted an awareness seminar. The study was divided into three main parts. The first part involved providing preliminary training to 304 students to determine their awareness of ecological and carbon footprints. The second part of the study involved face-to-face measurement studies with 295 students to calculate the amount of CO₂ generated annually by students and the category-based emission amounts. In the third part of the study, the emissions released institutionally in the Lokman Hekim Vocational and Technical Anatolian High School buildings were calculated. This included emissions from Scope 1 sources such as coal and generators, Scope 2 sources such as electricity, and Scope 3 sources including transportation, water consumption, paper consumption, kitchen cylinders, fire cylinders, air conditioning, and refrigerators.
A preliminary training was conducted for the school’s 304 students and 29 teachers. Following the training, a 13-question awareness questionnaire on ecological and carbon footprint was administered to determine the level of awareness among students and teachers.
2.2 Individual carbon emission calculations
Following the analysis of the survey results, face-on-face meetings were held with 295 students to calculate their carbon footprints using a program based on DEFRA (Department for Environment, Food and Rural Affairs) measurement standards. This program offers a carbon footprint calculator that helps individuals measure their impact on environment. The calculator takes into account various factors such as energy consumption, transportation, waste management, and lifestyle choices to provide an estimate of carbon footprint of individuals.
2.3 Institutional carbon emission calculations
The calculation of institutional carbon emissions involves the application of the standards set forth by the Intergovernmental Panel on Climate Change (IPCC). The IPCC has established three distinct methods to determine CO2 emissions: Scope 1, Scope 2, and Scope 3 [11].
Scope 1 pertains to the measurement of direct emissions resulting from an organization’s activities. This encompasses all activities carried out within the organization, as well as any transportation activities conducted using the organization’s own vehicles.
Scope 2 pertains to emissions resulting from sources such as electricity, water, heat, and other utilities that an institution purchases from external sources, rather than producing internally.
Scope 3 includes other emissions that are not encompassed in Scope 2, but are indirectly caused by an organization’s corporate activities. This includes emissions stemming from packaging used for products, advertising brochures, subcontracting activities outsourced by institutions, rental vehicles, and the fuel utilized by these vehicles. Additionally, Scope 3 includes all emissions related to work-related travel by employees, including air, sea, and land transportation.
Table 1 presents the sources, units, and monitoring frequencies of data collected for emission sources in order to calculate institutional carbon emissions. These data were obtained from information and documents provided by the administrative staff of high school. The institutional emission sources of the high school include Scope 1 emissions from fuel use, Scope 2 emissions from purchased electricity, and Scope 3 emissions from paper consumption, water consumption, school bus transportation, public transportation, personal vehicle arrival and departure, energy use, air conditioning, kitchen cylinder, fire extinguisher, and refrigerator.
Scope
Emission source
Unit
Data source
Scope 1
School fuel consumption
L
School administration
Scope 2
Purchased electricity
kWh
School administration
Scope 3
Paper consumption
kg
School administration
Water consumption
ton
School administration
School bus
km
Service company
Public transport
km
Questionnaire
Personal vehicle arrival and departure
km
Questionnaire
Energy
V
School administration
Air conditioning
number, type
School administration
Kitchen tube
number
School administration
Fire extinguisher
number, type
School administration
Freezer
number, type
School administration
Table 1.
Lokman Hekim vocational and technical Anatolian high school emission sources.
The literature commonly employs the ISO 14064-1 series guide and Greenhouse Gas Protocol’s calculation groups to determine institutional carbon footprints, utilizing data collection, calculation, reporting, and reference value tables outlined in the IPCC guidelines. Carbon footprint calculations for products and services during their life cycle also make use of PAS 2050 and ISO 14067 standards, developed and published by the British Standards Institution (BSI) [16].
The high school has 304 students and 29 personnel, who collectively own 12 vehicles. Transportation for students is facilitated by 10 shuttles, 8 of which are public and 2 private. In order to determine the institutional carbon footprint of the high school, various factors contributing to emissions, including coal consumption for heating, electricity usage, and the annual transportation of students and staff, were examined. To gather the necessary data, information from 2021 were utilized because it covers all the invoices related to emission sources. These invoices were provided by the high school administration, and the calculations were based on the information contained within them and given in Table 2.
Number of students
304
Staff number
29
Staff vehicle number
12
School fuel consumption
coal
Student transport distance of the shuttle (Total)
350 km/day - 63,000 km/year
Number of shuttle
8 + 2
Shuttle fuel type
Diesel
Table 2.
The data associated with Lokman Hekim vocational and technical Anatolian high school.
2.3.1 Emission calculations associated with electricity usage
The emission calculations associated with electricity usage employ the formula provided in Eq. (1) [17].
FV = Total amount of electricity consumed annually (kWh/year),
EF = Emission factor (kgCO2e/kWh), (for Turkey 0,437 kgCO2e/kWh),
T&DL = Transmission and distribution loss value, (for Turkey %13.3).
2.3.2 Emission calculations due to coal use
The formula given in Eq. (2) was used in the calculations of emissions from public transportation [17].
∑k=1nAD∗EFk∗1−BRk∗CF∗3.664E2
where,
AD = Activity data,
EF = Emission factor,
BO = Biomass rate,
CF = Conversion factor,
3.664 = Indicates the conversion to tCO₂e with the input value conversion factor of 3.664.
2.3.3 Emission calculations for gasoline usage
The formula given in Eq. (3) was used in the calculations of emissions caused by gasoline use [17].
EtCO2e=GAD∗GA∗10−3∗EF∗10−3∗FO∗OF∗10−3E3
where,
E tCO₂e = Total gasoline emission,
GAD = Gasoline average density (kg/m3),
GA = Yearly gasoline amount (L/year),
EF = Emission factor (kgCO₂/TJ),
FO = Factor of oxidation (TJ),
OF = Oxidation factor (accepted as 1 in IPCC guidelines).
2.3.4 Emission calculations for diesel usage and generators
The formula given in Eq. (4) was used in the calculations of diesel fuel emissions [17].
EtCO2e=DAD∗DA∗10−3∗EF∗10−3∗FO∗OF∗10−3E4
where,
E tCO₂e = Total diesel emission,
DAD = Diesel average density (kg/m3),
DA = Yearly diesel amount (L/year),
EFk = Emission factor, (kgCO₂e/TJ),
FO = Factor of oxidation, (TJ).
OF = Oxidation factor (accepted as 1 in IPCC guidelines).
2.3.5 Emission calculations for air conditioner, refrigerator, and fire protection systems
The formula given in Eq. (5) was used in the emission calculations from fire protection systems [17].
EtCO2e=THFC∗10−3∗TC∗(GWP∗(05∗R−32+05∗R−125E5
where,
E tCO₂e = Total HFC-227ea (FM200) gas emission carbon dioxide equivalent,
THFC = Total HFC-227ea gas (kg),
GWP = Global warming potential (tCO₂e/tHFC-227ea),
TC = The total amount of charging made to the system due to emission (the ratio of the total HFC-227ea gas loaded to the system from the % value—an annual emission of around 1% occurs).
2.3.6 Emission calculations from public transportation
The formula given in Eqs. 2 and 6 was used in the calculations of emissions from public transportation [17].
DU=KMY∗025/SNE6
where.
KMY = km per year,
0,25 = Average diesel burned by the bus per km (L),
Upon evaluation of the data from the ecological footprint awareness survey, data reveals that out of the 295 students who took part in the survey, 66% were female and 34% were male. Additionally, the survey found that 40.2% of participants were in 10th grade, 27.8% were in 9th grade, 18.6% were in 11th grade, and 13.4% were in 12th grade.
A 13-question awareness questionnaire was then administered to determine their understanding of carbon footprints. Results are presented in Table 3.
Questions
Answers
Yes (%)
No (%)
Partially (%)
1. Do you have information about global warming?
53.6
43.3
3.1
2. Do you have information about climate change?
64.9
30.9
4.2
3. Do you have information about the causes of climate change?
46.4
42.3
11.3
4. What does the future hold in terms of global and regional climate change?
46
41
13
5. Are you aware of the climate changes that have been observed in Turkey?
38.1
52.6
9.3
6. Do you have information about the ecological footprint?
15.5
63.9
20.6
7. Do you have information about the carbon footprint?
17.5
58.8
23.7
8. Do you have information about what should be done to mitigate the carbon footprint?
9.3
66
24.7
9. Do you think you know enough about this subject?
11.3
37.2
51.5
10. Do you think that the course content on these subjects is sufficient?
25.8
46.4
27.8
11. Do you read the news in the newspapers about environmental problems?
21.6
37.1
41.2
12. Do you want environmental problems to be covered in the lessons?
62.9
14.4
22.7
13. Does your family inform you about environmental pollution?
26.8
32
41.2
Table 3.
Awareness questionnaire for determining student’s understanding of carbon footprints, global warming, and climate change.
According to the results of the survey, it was understood that the majority of the students had only knowledge about climate change and global warming, and whether they had read the articles in publications such as newspapers and magazines, and the majority of the answers were no, and it was understood that they obtained this information only from sources such as media and television. It has been determined that they do not have enough knowledge on issues such as ecological footprint and carbon footprint and they want these issues to be more on the agenda and to be covered in their curriculum.
3.2 Individual carbon emissions
With the one-to-one measurement study conducted with 295 students, the annual average amount of CO2 created by the students and the amount of emissions on a category basis were calculated. The carbon footprint emissions created by students with the program based on the measurement standards of DEFRA (England Department of Environment, Food and Agricultural Affairs) are calculated according to the categories. This program offers a carbon footprint calculator that helps individuals measure their impact on the environment. The calculator takes into account various factors such as energy consumption, transportation, waste management, and lifestyle choices to provide an estimate of an individual’s carbon footprint. The calculator asks questions listed in Table 4 to obtain the necessary information.
Home
What is your country of residence?
What is your household size?
How much electricity do you consume on a monthly basis?
What type of heating do you use in your home?
Transportation
How many km do you travel by car each year?
How many km do you travel by bus each year?
How many km do you travel by train each year?
How many km do you travel by plane each year?
How many km do you travel by motorbike each year?
Lifestyle questions
How much waste do you generate on a monthly basis?
How much water do you consume on a monthly basis?
How much meat do you consume on a weekly basis?
How much dairy do you consume on a weekly basis?
How much seafood do you consume on a weekly basis?
Table 4.
Computer program input questions.
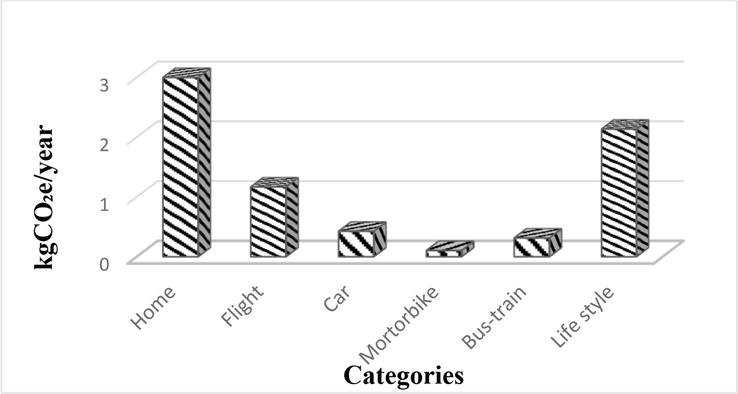
The annual average amount of CO2 created by the students and the amount of emissions on a category basis were calculated and results are given in Table 5 and schematized in Figure 1. As can be seen, the annual CO2 amount created by the students is 7.43 ton CO2e/year. The emissions by category are from household factors with 3 ton of CO2e/year, from lifestyle habits with 2.135 ton of CO2e/year, from flights with 1.169 ton of CO2e/year, from car use with 0.427 ton of CO2e/year, from motorcycle use with 0.104 ton of CO2e/year. It was determined that it was caused by bus-train travel with 0.315 ton of CO2e/year. Annual CO2 amount created by students (7.43 ton of CO2e/year) is much higher than the Turkey average of 4.1 ton CO2e/year, and the main reason for this is the use of coal for heating in Bulancak District and the limited public transport. In order to balance this emission, the amount of trees that students need to plant annually was found to be 11 on average.
Categories
Average generated CO2 (ton CO2e /year)
Home
3
Flight
1.169
Car
0.427
Motorbike
0.104
Bus-train
0.315
Life style
2.135
Total
7.432
Number of trees need to be planted per person
10.53
Table 5.
Average carbon footprint of the students.
Figure 1.
CO₂e averages created by students according to categories.
A study conducted by [14] at the Faculty of Forestry of the University of Madrid reported 1.87 ton of CO2e/year emissions per student. This difference is due to the widespread use of natural gas in the faculty where the study was conducted, the fact that coal is not used as a fuel and public transportation is common in transportation.
Upon analyzing the major contributors to household emissions, it can be concluded that fuel and electricity consumption used within the household is the most significant source. In terms of lifestyle factors, personal preferences such as food and drink choices, entertainment, and shopping habits play a significant role. Taking into account the age, lifestyle, and shopping preferences of students, it can be observed that their limited knowledge of alternative social activities, eating and drinking habits, organic and local products may lead to higher emissions through their lifestyle choices. Therefore, the impact of lifestyle factors on carbon footprint emissions should not be overlooked.
3.3 Institutional carbon emissions
Table 6 provides information on the emission sources utilized to calculate the carbon footprint of the school. The table includes the emission calculations for each source and the total amount of emissions generated.
Scope
Emission source
Emission amount (ton CO₂e/year)
Total emission (ton CO₂e/year)
Scope 1
Generator
0.18
85,368
Coal
85,188
Scope 2
Electric
16,716
16,716
Scope 3
Paper consumption
0.23
18,916
Water consumption
0.296
School shuttle
11.97
Arrival and departure by personal vehicle
3.088 diesel 0.958 gasoline 0.77 LPG
Fire extinguisher
0.15
Air conditioner, refrigerator
1.27
Kitchen tube
0.18
Total
120,984
Table 6.
Total emission amount for high school.
Emission amounts from Scope 1 (coal, generator), Scope 2 (electricity), and Scope 3 (transportation, water consumption, paper consumption, kitchen tube, fire extinguisher, air conditioner, and refrigerator) are calculated as 85,368 ton CO2e/year, 16,716 ton CO2e/year, and 18,916 ton CO2e/year, respectively. As a result of the second part of the study, the total institutional footprint of the high school is 120,984 ton CO2e/year.
Similarly, the largest share of the total institutional carbon footprint of the Madrid University Forestry Faculty was originated from Scope 1 (coal, generator) and followed by Scope 3 (transportation, water consumption, paper consumption, kitchen tube, fire extinguisher, air conditioner, and refrigerator), and by Scope 2 (electricity) [14].
In addition, the study conducted at Mehmet Akif Ersoy University Bucak Health Vocational School noted that heating from natural gas consumption had the biggest impact on carbon emissions, followed by emissions from electricity consumption, diesel, gasoline, and LPG vehicles, respectively [15].
It was also reported that the largest impact on the carbon footprint, following electricity-based emissions, was due to natural gas consumption for heating, while the least impact was due to gasoline consumption, according to the Scope 1 approach [11].
Throughout their lives, individuals leave their mark on the world through the consumption and production activities they engage in. When considering the food, clothing, consumer goods, resources used for heating and transportation, and the resulting waste generated throughout their lives, it is clear that the footprint left behind is not insignificant. The top priority in reducing the impact of human activities on the environment is awareness. It is crucial to be able to measure the direct and indirect effects of human activity on the environ4ment to increase awareness and create behavioral change. One widely used method of measurement in recent times is the carbon footprint.
During the 27th Conference of the Parties to the United Nations Framework Convention on Climate Change, also known as COP 27, emphasis was placed on the fact that the young generation will be the most affected by the climate crisis. As a result, it was recommended that young people should participate in future climate crisis negotiations and that countries should establish targets that prioritize the urgent reduction of greenhouse gases. To achieve this goal, it is crucial to raise awareness among young people about carbon footprint, ecological footprint, and climate change.
The survey results revealed that most students possessed only a basic understanding of climate change and global warming. Furthermore, when asked if they had read articles on the topic in publications like newspapers and magazines, the majority responded negatively. Instead, they relied on sources such as media and television for information. Additionally, the survey indicated that students lacked sufficient knowledge of concepts such as ecological footprint and carbon footprint. They expressed a desire for these topics to receive more attention and be incorporated into their curriculum.
Upon analyzing the major contributors to household emissions (3 ton of CO2e/year), it can be concluded that fuel and electricity consumption used within the household is the most significant source. In terms of lifestyle factors (2.135 ton of CO2e/year), personal preferences such as food and drink choices, entertainment, and shopping habits play a significant role. Taking into account the age, lifestyle, and shopping preferences of students, it can be observed that their limited knowledge of alternative social activities, eating and drinking habits, organic and local products may lead to higher emissions through their lifestyle choices. Therefore, the impact of lifestyle factors on carbon footprint emissions should not be overlooked. Annual CO2 amount created by the students is 7.43 ton CO2e/year, and is much higher than the Turkey average of 4.1 ton CO2e/year, and the main reason for this is the use of coal for heating in Bulancak District and the limited public transport. In order to balance this emission, the amount of trees that students need to plant annually was found to be 11 on average.
The total institutional carbon footprint of the high school was found to be 120,984 ton CO2e/year, with the largest share originating from Scope 1 (coal, generator) with 85,368 ton CO2e/year, followed by Scope 3 (transportation, water consumption, paper consumption, kitchen tube, fire extinguisher, air conditioner, and refrigerator) with 18,916 ton CO2e/year and by Scope 2 (electricity) with 16,716 ton CO2e/year.
Increasing the number of studies on calculating and reducing carbon footprints in schools is crucial to raising awareness about this issue. It is also important to organize training seminars that educate students and teachers about global climate change, as well as to develop projects that address this topic. Furthermore, incorporating subjects such as climate change, global warming, efficient resource utilization, carbon emission reduction, sustainability, and sustainable production and consumption into the education curriculum can help reduce carbon footprint in schools. Regular afforestation activities can also help reduce carbon emissions, as well as saving fuel, waste, electricity, heating, and transportation, which are major sources of carbon footprint.
In addition, it is essential to encourage school personnel to adopt electric and hybrid vehicle technologies, which are being implemented worldwide, including Turkey, in order to reduce emissions from transportation, the most significant source of CO₂ emissions.
The authors gratefully thank Mr. Cem Mutlu Türkseven, the Assisstant Director of Lokman Hekim Vocational and Technical Anatolian High School, for providing data support.
The authors have no relevant financial or non-financial interests to disclose. The authors have no competing interests to declare that are relevant to the content of this paper.
References
1.Yalvaç GH. The Effect of Cooperative Learning Approach on the Mental Structures of Teacher Candidates Regarding the Environment. Master Thesis. Turkey: Abant İzzet Baysal Univesity; 2008
2.Yücel A. Morgil F: Investigation of environmental phenomenon in higher education. Journal of Hacettepe University Faculty of Education. 1998;14:84-91
3.Atasoy E, Ertürk H. A field study on primary school students' environmental attitudes and environmental knowledge. Journal of Erzincan Faculty of Education. 2008;10(1):105-122
4.Keleş Ö, Naim U, Özsoy S. Calculation and evaluation of pre-service teachers' ecological footprints. Aegean Education Journal. 2008;9(2):1-15
5.Schaller D. Our footprints - they’re all over the place. Newsletter of the Utah Society for Enviromental Education. 1999;9(4):1-10
6.Dawe FMG, Vetter A, Martin S. An overview of ecological footprinting and other tools and their application to the development of sustainability process: Audit and methodology at Holme Lacy College, UK. International Journal of Sustainability in Higher Education. 2004;5(4):340-371
7.Janis AJ. Quantifying the Ecological Footprint of the Ohio State University. Dissertation. USA: The Ohio State University; 2007
8.Wada Y, Izumi K, Mashiba T. Development of a web-based personal ecological footprint calculator for the Japanese. In: International Ecological Footprint Conference. Cardiff: Cardiff University; 2007
9.Conway TM, Dalton C, Loo J, Benakoun L. Developing ecological footprint scenarios on university campus: A case study of the University of Toronto at Mississauga. International Journal of Sustainability in Higher Education. 2008;9(1):4-20
10.Yaka F, Koçer A, Güngör A. Detection of the carbon footprint of Akdeniz University vocational school of health services. Electronic Journal of Machine Technologies. 2015;12(3):37-45
11.IPCC. Guidelines for National Greenhouse Gas Inventories. 2006. https://www.ipcc-nggip.iges.or.jp/public/2006gl/ [Accessed: August 13, 2022]
12.Seyhan AK, Çerçi M. Determination of carbon footprint with IPCC tier 1 and DEFRA methods: Fuel and electricity consumption example of Erzincan Binali Yıldırım university. Journal of Suleyman Demirel University Institute of Science. 2022;26(3):386-397
13.Binboğa G, Ünal A. A research on calculating the carbon footprint of Manisa Celal Bayar University on the axis of sustainability. International Journal of Economic and Administrative Studies. 2018;21:187-202
14.Alvarez S, Blanquer M, Rubio A. Carbon footprint using the compound method based on financial accounts: The case study of the School of Forestry Engineering. Journal of Cleaner Production. 2014;66:224-232
15.Kumaç K, Akyüz A, Zaman M, Güngör A. Carbon footprint determination for a sustainable environment: Maku Bucak health college example. Al-Cezerî Journal of Science and Engineering. 2019;6(1):108-117
16.The Guide to PAS 2050:2011 How to Carbon Footprint Your Products, Identify Hotspots and Reduce Emissions in Your Supply Chain. https://www.bsigroup.com/globalassets/localfiles/en-th/carbon-footprint/pas-2050-2011-guide.pdf [Accessed: January 15, 2023]
17.Üreden A, Özden S. How to calculate corporate carbon footprint: A theoretical study. Anatolian Journal of Forest Studies. 2018;4(2):98-108
Written By
Pınar Rüya Uludağ and Başak Kiliç Taşeli
Submitted: 18 April 2023Reviewed: 24 April 2023Published: 06 July 2023