 Open access peer-reviewed chapter


Abstract
Western Himalayas (WH) have experienced a two-fold temperature increase compared to the Indian sub-continent post-2000, strongly linked to global warming with significant implications for precipitation patterns. Using ERA5 reanalysis, we examine seasonal precipitation changes in the WH between recent (2001–2020) and past decades (1961–2000). Mean summer precipitation has increased over foothills but declined at higher elevations, while winter precipitation has increased region-wide except in certain parts of Jammu-Kashmir (JK), Uttarakhand (UK), and Punjab. In summer, light precipitation has increased in JK, while moderate precipitation has decreased over foothills but enhanced at higher altitudes. Moreover, extreme precipitation has significantly increased in the UK and Himachal Pradesh. During winter, light and extreme precipitation has increased, while moderate and heavy precipitation declined. Maximum one and five-day precipitation extremes (Rx1day, Rx5day) have increased in the foothills with more consecutive wet days. Winter extremes have increased in the northern region, while consecutive dry and wet days have declined, except for specific areas in eastern Ladakh and JK. Furthermore, rising sea surface temperatures, enhanced moisture transport, increased precipitable water and cloud cover in WH are associated with increasing mean and extreme precipitation, emphasizing the impacts of global warming on temperature and precipitation transitions in the region.
Keywords
- climate change
- western Himalayas
- summer monsoon
- winter precipitation
- global warming
1. Introduction
The Western Himalayas (WH), comprising the hilly terrains of Jammu and Kashmir (JK), Himachal Pradesh (HP), Uttarakhand (UK), and Ladakh is known for its unique landscape, biodiversity, and cultural significance [1, 2, 3, 4, 5, 6]. The region is not only a critical water source for local communities but also plays a vital role in maintaining the climate of the entire northern belt of the Indian subcontinent [5, 6, 7, 8, 9]. However, the diverse topography, varying elevations, soil compositions, and vegetation patterns in the mountain ranges lead to distinct and contrasting weather patterns over short distances. In recent years, concerns have been raised about the potential impact of global warming on precipitation patterns over the WH [10, 11]. The sixth assessment report of the Intergovernmental Panel on Climate Change revealed that the climate of WH might alter significantly due to increasing trends of temperature at regional scales [12]. The report underscores elevation-dependent warming in the Himalayas, indicating that higher altitudes undergo more significant temperature increases compared to lower regions, thereby impacting the hydroclimate system [13, 14, 15, 16]. As a result, it can lead to accelerated changes in critical parameters such as the snowline, glacier equilibrium-line altitude, and the transition height between snow and precipitation. Such changes can also alter the precipitation phase and impact the distribution and timing of precipitation and snowfall events, with potential consequences for water availability, hydrological processes, and ecosystems in the region [1, 5, 17, 18].
WH observes two distinct precipitation seasons, the Indian summer monsoon (ISM) (June to September; JJAS) and winter precipitation (December to February; DJF). During summer monsoon, a substantial amount of precipitation (approximately 65–76%) [6] occurs over the WH, which is primarily attributed to orographic-induced mechanisms, as explained in various research studies [13, 19, 20, 21, 22, 23, 24, 25]. Moisture-laden winds from the Arabian Sea (AS) and the Bay of Bengal (BoB) converge along the WH foothills resulting in widespread precipitation throughout the region [26, 27, 28]. On the other hand, winter precipitation in the WH is characterized by the influence of western disturbances (WDs), which are extra-tropical cyclonic systems embedded in the subtropical westerly jet [5, 29]. This precipitation plays a critical role in meeting the ecological and socioeconomic needs of the region, sustaining regional glaciers and supporting agricultural activities, and also influences the glacial mass balance and river runoff [5, 28, 29]. The spatiotemporal distribution of precipitation in the WH exhibits high variability influenced by atmosphere-land surface exchange processes, diverse land surface characteristics, and orography [5, 30, 31].
In recent years, global warming and climate change have emerged as significant subjects of interest for both the scientific community and the media. The dynamic climate and atmospheric warming have profound implications for water resources, agriculture, and the national economy [32, 33]. While there is substantial evidence supporting global climate change, further investigation is required to understand its implications for regional climates. Regional-scale forcings influenced by local topographical features and land-use characteristics can influence climate change patterns, including weather and climate extremes, notably over complex terrains with distinctive geographical attributes such as WH [34]. Given the dense population in the WH and surrounding areas, they are highly susceptible to climate extremes [5, 28, 35, 36]. Moreover, elevation-dependent warming in the Himalayan region is a major concern, causing shifts in precipitation patterns, including a reduced snow season and increased liquid precipitation [37].
Research focussing on ISM-attributed precipitation over the WH indicates that the region is undergoing a complex array of changes in precipitation and exhibits heterogeneous patterns. An enhancement of ISM precipitation is evident in certain areas, while others observe decreased precipitation [3, 6, 19, 24, 38, 39]. Such spatiotemporal variability in precipitation patterns, in the context of global warming, can be attributed to several factors. Alterations in the intensity and frequency of ISM mean and extreme precipitation, shifts in dynamics such as moisture transport, sea surface temperature fluctuations, etc. can be some of these factors [9, 28, 29]. According to climate models, the region is likely to experience an increase in precipitation variability, with more extreme precipitation events (EPEs) and longer dry spells during the ISM [38, 40, 41]. Das and Meher [24] reported that station-based precipitation records in the WH indicate a reduction in the mean ISM precipitation, however, an increase in the intensity and frequency of EPEs is evident. Such changes can contribute to adverse consequences including increased risks of flash floods, landslides, and glacial lake outburst floods. The impact of climate change on the hydrology of the Hindu Kush Himalayan region during ISM was investigated in a few research studies [8, 39, 42, 43]. Their findings agree with the presence of heterogeneous precipitation patterns, implying an increase in precipitation at certain hotspots and decrease in other regions. Warming trends have also been observed during the winter season in a few research studies [1, 44]. Shekhar et al. [35] aimed to comprehend the influence of climate variability on winter precipitation trends in the WH, and observed a significant decline in snowfall days during Jan-Mar from 1984 to 2007. Observations by Dimri and Dash [45] highlighted decreasing precipitation at specific locations in the WH during the period from 1975 to 2006. Additionally, studies have indicated a decline in spring snow cover since 1993, accompanied by accelerated snowmelt from winter to spring, potentially linked to global warming [46, 47, 48, 49]. Gusain et al. and Singh et al. [17, 50] observed a decline in seasonal snowfall at stations below 4000 m and 3250 m, respectively, while an increasing trend in seasonal rainfall was observed at eight stations.
However, a significant research gap exists in understanding the long-term precipitation trend changes in the WH before and after the twenty-first century, highlighting the need for a comprehensive investigation to address this knowledge gap. Since the WH is vulnerable to significant changes in seasonal precipitation patterns in the context of global warming, the current study aims to investigate changes in precipitation trends during the summer (JJAS) and winter (DJF) seasons over the WH region (27.5°N–37.5°N and 72°E–82°E) within the timeframe of 1961–2020.
2. Data and methods
This study aims to investigate precipitation changes over the WH by utilizing the ERA5 dataset, which is a comprehensive and high-resolution fifth-generation reanalysis dataset developed by the European Centre for Medium-Range Weather Forecasts (ECMWF). The ERA5 dataset offers a spatial resolution of 0.25° × 0.25° and derives precipitation data through an advanced 4D-Var assimilation system that integrates various observations, including surface observations, weather station measurements, satellite data, and weather radar information [51]. These observations are assimilated with the ECMWF’s atmospheric model to generate a reliable representation of precipitation estimates. The reanalysis encompasses several decades of data and has gained widespread usage in climate studies due to its accuracy and consistency [46, 50, 51]. In this study, we specifically analyze the alterations in precipitation during the ISM and winter season over the WH region (27.5°N–37.5°N and 72°E–82°E) during 1961–2020.
Various factors such as precipitation categories, climate indices, and associated atmospheric variables have been investigated by considering two distinct time periods: a 40-year period representing the pre-2000 era (1961–2000; referred to as past decades) and a 20-year period representing the post-2000 era (2001–2020; referred to as recent decades). This division allows for a comparative assessment of precipitation changes and associated variables, as notable temperature shifts have been observed in the recent decades over the WH region. The study examines the precipitation climatology during the longer time period of 1961–2000 and compares the precipitation differences between the recent and past decades. The comparative analysis of various precipitation events is conducted through a percentile-based classification namely: light (below the 25th percentile), moderate (between the 25th and 90th percentiles), heavy (between the 90th and 95th percentiles), and extreme (above the 95th percentile) precipitation. Here, the percentile approach has been adapted, considering the complex nature of the WH and the high spatiotemporal variability of precipitation. We further examined four extreme climate indices, defined by the World Meteorological Organization’s Expert Team on Climate Change Detection and Indices (ETCCDI) [52, 53, 54], to represent the magnitude and duration of EPEs over WH. The “Rx1day” index represents the maximum single-day precipitation value per year, indicating the high-intensity precipitation events. The “Rx5day” index identifies the maximum consecutive five-day precipitation, providing insights into prolonged precipitation events. Additionally, the study analyzes the count of continuous wet days (CWD) and consecutive dry days (CDD) to assess the duration of wet and dry periods, respectively. CWD represents a persistent wet period with precipitation exceeding a specified threshold, while CDD indicates a prolonged dry spell without any precipitation.
The study also explores the factors contributing to changes in precipitation, considering global warming and its impact on thermal, moisture, and moist circulation patterns. To achieve this, changes in the recent decades for key atmospheric variables such as sea surface temperature (SST), vertically integrated moisture transport (VIMT), precipitable water, and outgoing longwave radiation (OLR) have been analyzed. The available moisture in the atmosphere is calculated by integrating specific humidity from the surface level to the mid-tropospheric level. Additionally, the investigation of vertically integrated moisture transport (VIMT) is conducted using relevant equations given thus,
where
3. Results and discussion
The temperature anomalies over the WH and India over the long-term period 1961–2020 are shown in Figure 1. The analysis reveals that notable climatic variations have transpired within both regions toward the start of the twenty-first century. In the Indian subcontinent, a gradual and consistent warming trend has been observed, characterized by an average annual temperature increase of approximately 0.1°C per decade (Figure 1a). In contrast, the WH has experienced a more accelerated rate of warming at annual time scales, estimated to be around 0.2°C per decade. Examining the seasonal variations, it becomes evident that the summer surface temperature in the WH region is increasing at a faster rate of 0.23°C per decade compared to the Indian landmass, which is experiencing a rise of 0.17°C per decade (Figure 1b). Moreover, we find that winter surface temperatures also show a significantly increasing trend of about 0.1°C per decade for the entire India, while those in the WH region are rising much more rapidly, approximately at a rate of 0.18°C per decade (Figure 1c). The findings suggest that the WH has exhibited more pronounced tendencies toward warming at both annual and seasonal timescales.

Figure 1.
Time series of temperature anomalies across the western Himalayas (Ladakh, Jammu and Kashmir, Himachal Pradesh, Uttarakhand, Punjab, and Haryana; red bars) and Indian landmass (yellow bars) from 1961 to 2020 for (a) annual, (b) summer and, (c) winter seasons using ERA5 data.
Overall, it becomes clear that the temperature anomalies have predominantly leaned toward the positive side rapidly over the WH since the beginning of the twenty-first century. To delve deeper into the influence of such alterations on the precipitation patterns across the region, we specifically examine the disparities for the summer and winter seasons using two distinct time frames: the pre-2000 era (1961–2000) and the post-2000 era (2001–2020). By focusing on these seasonal variations, we aim to gain a scientific understanding of the precipitation changes and their extreme characteristics in the complex terrains of the WH.
3.1 Mean precipitation
The precipitation climatology and the respective differences for the summer and winter seasons across the WH have been presented in Figure 2. The summer precipitation climatology reveals that the WH foothill belt is a significant zone for precipitation (reaching up to 20 mm/day; Figure 2a). Moreover, this region experiences comparatively higher amounts of precipitation in comparison to other parts of the WH. The foothills serve as a transitional area between the plains and the mountainous terrains, where orographic effects play a crucial role in influencing precipitation patterns. Figure 2b provides evidence of decreasing mean ISM precipitation over the WH foothill regions during the recent decades. Declining summer precipitation during 2001–2015 in the WH foothills, and an increased snowmelt observed by Riley et al. [55] supports these findings. Our findings are suggestive of a shift in summer precipitation patterns in response to changing climate.
The precipitation climatology for winter season showcases that the Great and lower Himalayas and the foothills are the regions of the precipitation maxima (reaching up to 6 mm/d), with highest intensity observed in JK, followed by HP and UK (Figure 2c). The precipitation differences depict increasing intensities over most of the region in the recent decades (reaching up to 0.36 mm/day; Figure 2d). The increase in precipitation is relatively stronger in eastern JK and northern HP, whereas a decrease in precipitation is observed over western JK and parts of the UK. As the drivers of precipitation observed during summer and winter seasons over the WH differ significantly, these findings imply the seasonal dependency of precipitation changes over the complex regimes of WH under global warming scenarios. Such changes have potential implications for various sectors, including water resources, ecosystems, and agriculture in the region.

Figure 2.
Spatial distribution of precipitation climatology (1961–2020) and difference in precipitation between post-2000 era (2001–2020) and pre-2000 era (1961–2000) for summer (a and b) and winter (c and d) seasons, respectively based on ERA5 data.
3.2 Precipitation categories
The spatial distribution of precipitation intensities in various categories (encompassing extremes) across the WH during the summer and winter, including the climatological precipitation patterns and the differences noted between recent and past decades is displayed in Figure 3. The distributions reveal that the southern slopes of the WH, specifically the foothills, experience substantial precipitation throughout the summer season (Figure 3a–d), however, the intensity and geographical locations of precipitation patterns vary across different categories. The precipitation amounts range from about 3 mm/day for light precipitation events (Figure 3a) to more than 100 mm/day in the case of EPEs (Figure 3d). The UK region, located in the foothills of the WH, receives the highest precipitation amounts for all types of events. Moderate (Figure 3b) and heavy (Figure 3c) precipitation categories exhibit a similar spatial pattern, with highest precipitation observed over the foothills. The differences in the climatology of light precipitation events (Figure 3e) indicate an increasing trend over JK and mixed trends in HP and UK. Moderate precipitation events (Figure 3f) are declining over the WH foothills in recent decades, while an increment is observed in the high-altitude regions. Although the heavy precipitation events (Figure 3g) exhibit a mixed trend throughout the region, increasing trends for EPEs (Figure 3h) have been observed in southeastern parts of HP and most of the UK.

Figure 3.
Spatial distribution of mean precipitation intensity for light, moderate, heavy and extreme precipitation in summer (a–d), and winter seasons (i–l), respectively. (e–h) and (m–p) represents the difference in precipitation between post-2000 era (2001–2020) and pre-2000 era (1961–2000), for the summer and winter seasons, respectively.
Light precipitation events during the winter season primarily occur in the Ladakh region, with intensities averaging around 0.03 mm/day. The region with the highest occurrence of moderate (0–6 mm/day), heavy (0–8 mm/day), and extreme precipitation (10 mm/day or higher) is located in the lower Himalayas and foothills. The highest magnitudes of precipitation intensities are observed over JK, followed by HP and UK. Recent decades indicate notable changes in precipitation patterns, with a substantial increase in the intensity of light precipitation events but a region-wide decrease in moderate and heavy precipitation intensities. Conversely, extreme precipitation exhibits a more heterogeneous trend, characterized by an increase in the Ladakh region and the Great Himalayan range encompassing eastern JK and northern HP, while other areas experience a decline. These findings underscore the intricate nature of precipitation patterns within the WH, including variations in the types of precipitation events. The spatial distribution and disparities in precipitation have significant implications for water availability, flood risk, and ecosystem dynamics in the region.
3.3 Climate indices
The spatial distribution of extreme climate indices during the summer and winter seasons is illustrated in Figure 4 to understand the altering characteristics of EPEs, wet spells, and dry spells over the WH, in response to warming patterns. Figure 4a displays the climatology of Rx1day, which represents the maximum one-day precipitation for each year over the WH during ISM. The WH foothill belt exhibits high Rx1day precipitation (>120 mm), while the downstream side and high-altitude regions of the WH represent comparatively drier areas with an average Rx1day below 30 mm. Similarly, the Rx5day precipitation is very high in the foothill regions (>240 mm), indicating a similar spatial distribution of extreme events. Figure 4c and d illustrate the climatology for CWD and CDD, which represents the duration of consecutive wet and dry days, respectively. The WH foothills exhibit the highest values of CWD (>70 days) and the lowest values for CDD (<12 days), indicating that the foothills are the main precipitation belt of WH during ISM. In contrast, other parts of WH exhibit comparatively shorter wet periods (<40 days) and longer dry periods. Figure 4(e–h) illustrates the climatological differences in EPEs in recent decades compared to past decades. The magnitude-based indices in Figure 4(e and f) indicates an increasing trend in EPEs over the northern regions of the UK and the southeastern region of HP. Conversely, a significant decreasing trend is observed over the majority of JK and western HP. Figure 4(g and h) shows an increasing trend for CWD and decreasing trend for CDD over the high-altitude regions of the WH, whereas comparatively mixed trends are evident across the foothills.
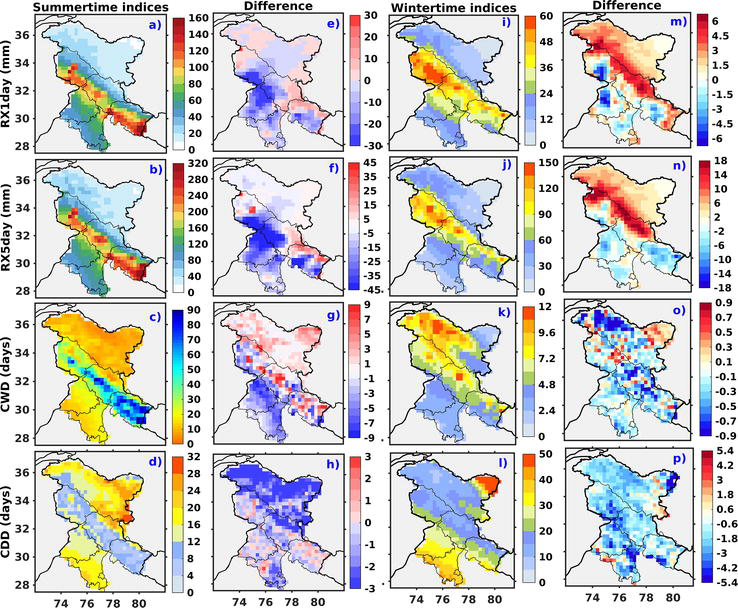
Figure 4.
Spatial distribution for the climatology of different extreme climate indices (Rx1day, Rx5day, CWD, and CDD) using ERA5 during summer (a–d) and winter (i–l) seasons, respectively. (e–h) and (m–p) present the differences in the climate indices between pre-2000 ERA (1961–2000), and post-2000 era (2001–2020) for summer and winter, respectively.
The wintertime climate indices illustrate magnitudes of Rx1day and Rx5day reaching up to 60 mm and 150 mm respectively, with maxima situated over zones of highest precipitation (Figure 4i,j). Interestingly, the intensity of Rx1day exhibits a notable disparity across the study area, with the eastern part of JK experiencing comparatively higher values compared to other regions. This discrepancy may be attributed to the influence of orographic effects and local-scale atmospheric processes on the distribution of precipitation extremes in the region. In the CWD climatology, Karakoram Himalayas exhibit the longest duration of wet days, exceeding 12 days, followed by the Great Himalayas with a duration of over 6 days (Figure 4k). In contrast, the foothills and surrounding plains exhibit dry durations of more than 25 days, while the eastern parts of Ladakh experience an extended period of CDDs, exceeding 50 days (Figure 4l). These findings suggest a pronounced contrast in the precipitation characteristics between the various subregions within the study area. The Karakoram range, the Great Himalayas, and the foothills are the primary zones where winter precipitation occurs. In contrast, eastern Ladakh falls within the precipitation shadow zone, resulting in a notable duration of CDDs in this region during winter.
Examining the changes in these climate indices over the recent decades, a clear increasing trend is observed in the precipitation extremes (both Rx1day and Rx5day) across the majority of the region (Figure 4m and n). Notably, the Karakoram range and the Great Himalayas exhibit stronger trends in precipitation extremes compared to other areas. However, pockets of slight decrease in these indices are observed in certain parts of JK, UK, and Punjab. These localized variations may be attributed to complex interactions between large-scale climate patterns, local atmospheric processes, and orographic effects. Regarding the duration of consecutive wet and dry days, a heterogeneous pattern emerges for wet days, with a general decrease observed throughout the region (Figure 4o). However, certain pockets in eastern Ladakh and JK exhibit a contrary trend, indicating a localized persistence of wetter conditions. In contrast, the duration of CDDs displays a homogenous decrease across the entire region, indicating a general trend toward a decrease in the frequency of persistent dry periods during winter (Figure 4p).
3.4 Mechanisms
In light of the substantial modifications observed in precipitation patterns since the beginning of the twenty-first century, which coincide with the prevailing warming trends in the WH, our study further focuses on an in-depth investigation into the changes occurring in key atmospheric variables as a direct response to these warming trends. This investigation aims to discern the potential impacts of these changes on precipitation patterns within the region. Figure 5(a and b) exhibits the mean SST (1961–2020) and its disparities between recent and past decades during the ISM. Notably, significant SST increases have been observed in the adjacent oceans, namely the Indian Ocean, AS, and BoB (reaching up to 0.16°C). The warming rate appears to be more pronounced in the eastern and central regions of the Indian Ocean, followed by the AS and BoB. The findings indicate a regional warming effect over the surrounding oceans, which can impact the atmospheric moist circulation patterns, thereby influencing the mean summer precipitation over the WH. Moreover, during EPEs, such fluctuations in the monsoon circulation can facilitate an enhanced moisture transport toward the WH, thereby increasing the moist convective activity over the region, in context of atmospheric instability.
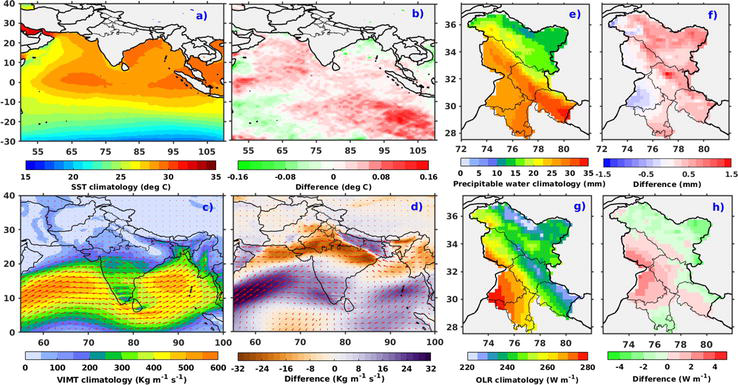
Figure 5.
Spatial distribution of climatological characteristics, and the differences between post-2000 period (2001–2020) and pre-2000 period (1961–2000), during ISM for (a and b) sea surface temperatures (SST), (c and d) vertically integrated moisture transport (VIMT), (e and f) precipitable water and (g and h) outgoing longwave radiation OLR, respectively.
Furthermore, we have examined the moisture transport fields (VIMT) to ascertain whether they demonstrate comparable patterns, and influence the evolving precipitation patterns across the WH in recent decades. Figure 5(c and d) presents the VIMT climatology during the entire study period and the difference between recent and past decades. On a climatological basis, AS and BoB as the major moisture sources for summer precipitation across the WH. Interestingly, an increase of VIMT, though with low magnitudes, is observed over the higher elevations across the WH whereas a decreasing trend can be seen for moisture transport associated with the WH foothills and surrounding plains, which are the regions of reduced precipitation during the recent decades.
Figure 5e illustrates the mean precipitable water over the WH, representing the available moisture content in the atmosphere, which is highest over the foothills and surrounding plains, followed by that in high altitudes. However, the differences associated with precipitable water between recent and past decades, show high levels of precipitable water in the elevated regimes of WH whereas comparatively much lower amounts are present over the foothills including southern parts of JK and HP as well as surrounding plains of Punjab and western Haryana (Figure 5f). These low magnitudes suggest that the long-term changes in moisture availability over these regions have remained relatively stable during the recent decades. The outgoing longwave radiation (OLR) serves as a valuable proxy for assessing deep convection and presents significant potential in unraveling large-scale precipitation variability in complex regions like the Himalayas [56]. A low OLR value is indicative of strong convection, representing an active precipitation process, while a high OLR value suggests cloud-free regions [57, 58, 59]. Figure 5(g and h) demonstrates the spatial distribution of mean OLR and the climatological difference of OLR between recent and past decades. The results indicate that during the ISM, lower values of OLR are prominent over the upper regions of WH foothills, specifically in the northern parts of HP and UK (Figure 5g), indicating the presence of more convective activity and cloud cover there. Comparatively higher OLR values are observed in lowermost parts of foothills and surrounding plains. Significant positive anomalies can be observed in the WH foothills during recent decades (Figure 5f), suggesting reduced cloud cover and decreased precipitation during the ISM. However, the higher elevations exhibit comparatively negative anomalies, suggesting increased convective activity and enhanced precipitation as suggested earlier.
Upon examining the responses of these variables during the winter season (Figure 6), a distinct and homogenous rise in SSTs becomes evident, reaching a maximum of 0.27°C (Figure 6b). Notably, this temperature rise appears to exhibit greater magnitudes than that observed during the summer season. Of particular interest, the Indian Ocean demonstrates the most pronounced rate of SST increase, followed by the AS and the BoB. The AS represents a pivotal moisture supplier for winter precipitation associated with WDs [29, 60], while Dimri et al. [61] have identified the BoB as a primary moisture contributor for non-WD-related winter precipitation over the WH. The rising SSTs, consequently, trigger enhanced evaporation processes, fostering the availability and transport of additional moisture, thereby substantially contributing to enhanced mean and extreme precipitation across the WH. Additionally, the Mediterranean, Caspian, Red Seas, and AS play a crucial role in transporting significant amounts of moisture eastward with propagating WDs toward the WH (Figure 6c), thereby contributing to moisture availability for winter precipitation [29, 60]. The changes in winter seasonal moisture supply over the WH in recent decades (Figure 6d) clearly indicate a noticeable increase in both the magnitude and transport of moisture over the region.

Figure 6.
Same as
Significant amounts of total precipitable water content, primarily concentrated in areas of maximum precipitation, are observed during winter over the region (Figure 6e). The observed rise in temperatures across the WH in recent decades corresponds to an increase in moisture content, consistent with the Clausius-Clapeyron relationship. The presence of positive anomalies in precipitable water (up to 1.2 mm) recently (Figure 6f) indicates a greater availability of moisture, which enhances the efficiency of orographic precipitation and cloud formation in the WH’s mountainous regions. This additional moisture can be contributed by sources such as the AS, BoB, and conventional moisture sources associated with eastward moving WDs. In conclusion, these changes in regional dynamic and thermodynamic variables provide compelling evidence for the emergence of rising mean and extreme precipitation patterns over the WH in recent decades. OLR variability serves as a significant indicator for cloud formations associated with precipitation; however, it is important to note that changes in near-surface temperature resulting from winter snow cover over complex regions like the WH can also contribute to the variations in OLR [62]. Typically, WDs that bring precipitation contribute to overcast skies and increased cloud cover across the WH [63]. Recent decades reveal slight negative anomalies in OLR during winter (Figure 6h) over the regions where precipitation has shown an increase (as depicted in Figure 1d). This suggests an intensification of convective activity and cloud cover. Conversely, strong positive anomalies are evident over JK and the lower foothills, indicating reduced convective activity and subsequently decreased cloud cover, which aligns with the observed decline in precipitation over those particular regions.
4. Summary and conclusion
The changes in precipitation patterns over the WH in the context of global warming are complex and multifaceted, acknowledging the complexities of the region’s topography and the high spatiotemporal variability of precipitation. The current study aims to examine the intricate and diverse changes in precipitation patterns during summer and winter seasons across the WH, driven by the significant warming trends observed in the area in recent decades due to global warming.
Findings emphasize that the WH region has been more significantly impacted by warming trends compared to India as a whole, at both annual and seasonal scales. The accelerated warming in the WH has implications for the local climate, ecosystems, and various sectors dependent on this mountainous region.
The analysis of mean precipitation patterns in the WH reveals a complex and varied picture. Our findings suggest a decline in mean ISM precipitation over the WH foothills in recent decades, while an increment is observed in the high-altitude regions. Winter mean precipitation exhibits amplified precipitation mostly throughout the entire WH region (reaching up to 0.36 mm/d), except for specific areas in JK, UK, and Punjab, where the observed decline is relatively weaker compared to the overall increase in precipitation.
During summer, an increasing trend for light precipitation events is observed over JK and mixed trends in HP and UK whereas the moderate events are declining in the foothills and increasing at high altitudes. Heavy events show a mixed trend, while EPEs are increasing in southeast HP and most of the UK. In winter, precipitation patterns in Ladakh exhibit a noteworthy increase in the occurrence of light precipitation events whereas the extreme precipitation portrays a heterogeneous trend, characterized by an upswing in the Ladakh region and the Great Himalayas encompassing eastern JK and northern HP, while witnessing a decline in other areas. Concurrently, moderate and heavy precipitation are experiencing a decline across the entire region.
Changes in climate indices offer insights into changing precipitation patterns, extreme events, and climate variability, aiding in understanding risks associated with heavy precipitation, droughts, and wet/dry periods. Magnitude-based extreme indices indicate an increase in summertime precipitation extremes in the northern UK and southeastern HP and decrease in JK and western HP. At the same time, the duration of wet days is enhanced in the high-altitude regions of WH alongside a decrease in dry days. In the foothills, however, the trends for both CWD and CDD are mixed. Winter climate indices reveal a significant intensification of extreme precipitation (both Rx1day and Rx5day) primarily in the northern parts of WH (up to 7.5 mm and 18 mm, respectively). However, a minimal decrease in extreme precipitation is observed in the foothills. Analysis of consecutive dry and wet days demonstrates decreasing trends for both categories across the region. Nonetheless, specific localized areas, notably eastern Ladakh and J&K, exhibit pockets of increasing wet days.
The examination of SST patterns in both summer and winter reveals positive anomalies for SSTs in the surrounding Indian Ocean, AS and BoB, with comparatively higher magnitudes of increase during winter than ISM. During summer, higher elevations in the WH show a slight increase in VIMT, while moisture transport decreases in WH foothills and plains with reduced precipitation. Moreover, higher precipitable water in WH elevations but lower amounts in foothills is also observed, suggesting stable moisture availability in the latter. However, the winter seasonal VIMT as well as precipitable water over the WH has experienced significant increases in recent decades.
In summer, the WH foothills exhibit positive OLR anomalies, indicating reduced cloud cover and decreased precipitation during the ISM, while higher elevations display negative anomalies, suggesting increased convective activity and enhanced precipitation over the WH. The changes associated with winter OLR depict minute negative anomalies over the regions experiencing enhanced precipitation and positive anomalies in western JK and foothills where the precipitation patterns have been found to be decreasing, thus confirming increased and decreased cloud cover respectively.
In summary, the spatial and temporal variability in precipitation patterns over the WH can have significant implications for the region’s environment, economy, and society. It is crucial to develop adaptation strategies that take into account the complex and uncertain nature of these changes, and to work toward mitigating the underlying causes of global warming to minimize the impact of these changes.
Acknowledgments
This research work was supported by the Prime Minister’s Research Fellowship (PMRF) and the Science and Engineering Research Board, Department of Science and Technology, Government of India under the “Start-up Research Grant (SRG) scheme” (Grant SRG/2020/001857). Rohtash and Nischal Sharma gratefully acknowledge the financial assistance from the PMRF, Ministry of Education, Government of India.
Nomenclature
Western Himalayas | |
Indian summer monsoon | |
Western disturbances | |
Jammu Kashmir | |
Himachal Pradesh | |
Uttarakhand | |
Intergovernmental Panel on Climate Change | |
extreme precipitation event | |
continuous wet days | |
consecutive dry days | |
sea surface temperature | |
outgoing longwave radiation | |
Vertically integrated moisture transport |
References
- 1.
Bhutiyani MR, Kale VS, Pawar NJ. Climate change and the precipitation variations in the northwestern Himalaya. 1866-2006. International Journal of Climatology. 2010; 30 :535-548. DOI: 10.1002/joc.1920 - 2.
Rasmussen KL, Houze RAA. Flash-flooding storm at the steep edge of high terrain. Bulletin of the American Meteorological Society. 2012; 93 :1713-1724. DOI: 10.1175/BAMS-D-11-00236.1 - 3.
Bharti V, Singh C, Ettema J, Turkington TAR. Spatiotemporal characteristics of extreme rainfall events over the northwest Himalaya using satellite data. International Journal of Climatology. 2016; 36 :3949-3962. DOI: 10.1002/joc.4605 - 4.
Meher JK, Das L, Benestad RE, Mezghani A. Analysis of winter rainfall change statistics over the Western Himalaya: The influence of internal variability and topography. International Journal of Climatology. 2018; 38 :e475-e496. DOI: 10.1002/joc.5385 - 5.
Nischal AR, Hunt KMR. Evaluating winter precipitation over the Western Himalayas in a high-resolution Indian regional reanalysis using multisource climate datasets. Journal of Applied Meteorology and Climatology. 2022; 61 :1607-1627. DOI: 10.1175/JAMC-D-21-0172.1 - 6.
Saini R, Attada R. Analysis of Himalayan summer monsoon rainfall characteristics using Indian high-resolution regional reanalysis. International Journal of Climatology. 2023:1-22. DOI: 10.1002/joc.8087 [Online] - 7.
Bharti V. Investigation of Extreme Rainfall Events Over the Northwest Himalaya Region Using Satellite Data [Master’s thesis]. University of Twente; 2015. p. 72 - 8.
Krishnan R, Shrestha AB, Ren G, Rajbhandari R, Saeed S, Sanjay J, et al. Unravelling climate change in the Hindu Kush Himalaya: Rapid warming in the mountains and increasing extremes. In: Wester P, Mishra A, Mukherji A, Shrestha A, editors. The Hindu Kush Himalaya Assessment. Cham: Springer; 2019. DOI: 10.1007/978-3-319-92288-1_3 - 9.
Vellore RK, Bisht JS, Krishnan R, Uppara U, Capua GD, Coumou D. Sub-Synoptic Circulation Variability in the Himalayan Extreme Precipitation Event during June 2013. Vol. 132. Austria: Springer-Verlag GmbH; 2020 - 10.
Webster PJ, Toma VE, Kim HM. Were the 2010 Pakistan floods predictable? Geophysical Research Letters. 2011; 38 :1-5. DOI: 10.1029/2010GL046346 - 11.
Sabin TP, Krishnan R, Vellore R, Priya P, Borgaonkar HP, Singh BB, et al. Climate change over the Himalayas. In: Assessment of Climate Change over the Indian Region. Springer Singapore: Singapore; 2020. pp. 207-222 - 12.
IPCC, 2021: Climate Change 2021: The Physical Science Basis. In: Masson-Delmotte V, Zhai P, Pirani A, Connors SL, Péan C, Berger S, et al, editors. Contribution of Working Group I to the Sixth Assessment Report of the Intergovernmental Panel on Climate Change. Cambridge, United Kingdom and New York, NY, USA: Cambridge University Press. 2391 p. DOI: 10.1017/97810091578 - 13.
Giorgi F, Hurrell JW, Marinucci MR, Beniston M. Elevation dependency of the surface climate change signal: A model study. Journal of Climate. 1997; 10 :288-296. DOI: 10.1175/1520-0442(1997)010<0288:EDOTSC>2.0.CO;2 - 14.
Beniston M. Climatic change in mountain regions: A review of possible impacts. In: Climate Variability and Change in High Elevation Regions: Past, Present & Future. 2003. pp. 5-31. DOI: 10.1007/978-94-015-1252-7_2 - 15.
Kang S, Xu Y, You Q , Flügel WA, Pepin N, Yao T. Review of climate and cryospheric change in the Tibetan plateau. Environmental Research Letters. 2010; 5 :8. DOI: 10.1088/1748-9326/5/1/015101 - 16.
You Q , Kang S, Pepin N, Flügel WA, Yan Y, Behrawan H, et al. Relationship between temperature trend magnitude, elevation and mean temperature in the Tibetan plateau from homogenized surface stations and reanalysis data. Global and Planetary Change. 2010; 71 :124-133. DOI: 10.1016/j.gloplacha.2010.01.020 - 17.
Gusain H, Mishara V, Bhutiyani M. Winter temperature and snowfall trends in the cryospheric region of north-west Himalaya. Mausam. 2014; 65 :425-432. DOI: 10.54302/mausam.v65i3.1053 - 18.
Hunt KMR, Curio J, Turner AG, Schiemann R. Subtropical westerly jet influence on occurrence of Western disturbances and Tibetan plateau vortices. Geophysical Research Letters. 2018; 45 :8629-8636. DOI: 10.1029/2018GL077734 - 19.
Singh P, Ramasastri KS, Kumar N. Topographical influence on precipitation distribution in different ranges of Western Himalayas. Nordic Hydrology. 1995; 26 :259-284. DOI: 10.2166/nh.1995.0015 - 20.
Ménégoz M, Gallée H, Jacobi HW. Precipitation and snow cover in the Himalaya: From reanalysis to regional climate simulations. Hydrology and Earth System Sciences. 2013; 17 :3921-3936. DOI: 10.5194/hess-17-3921-2013 - 21.
Houze RA. Mesoscale convective systems. Geophysical Journal International. 2014; 104 :237-286. DOI: 10.1016/B978-0-12-374266-7.00009-3 - 22.
Vellore RK, Krishnan R, Pendharkar J, Choudhury AD, Sabin TP. On the anomalous precipitation enhancement over the Himalayan foothills during monsoon breaks. Climate Dynamics. 2014; 43 :2009-2031. DOI: 10.1007/s00382-013-2024-1 - 23.
Kesarwani K, Dobhal DP, Durgapal A, Mehta M. High altitude meteorology and cloud cover conditions A study from the chorabari glacier catchment, Central Himalaya, India. Himalayan Geology. 2015; 36 (2):134-142 - 24.
Das L, Meher JK. Drivers of climate over the Western Himalayan region of India: A review. Earth-Science Reviews. 2019; 198 :102935. DOI: 10.1016/j.earscirev.2019.102935 - 25.
Singh D, Ghosh S, Roxy MK, McDermid S. Indian summer monsoon: Extreme events, historical changes, and role of anthropogenic forcings. Wiley Interdisciplinary Reviews: Climate Change. 2019; 10 :1-35. DOI: 10.1002/wcc.571 - 26.
Buckner CA, Lafrenie RM, Dénommée JA, Caswell JM, Want DA. Complementary and alternative medicine use in patients before and after a cancer diagnosis. Current Oncology. 2018; 25 :e275-e281. DOI: 10.3747/co.25.3884 - 27.
Aggarwal D, Attada R, Shukla KK, Chakraborty R, Kunchala RK. Monsoon precipitation characteristics and extreme precipitation events over Northwest India using Indian high resolution regional reanalysis. Atmospheric Research. 2021; 267 :105993. DOI: 10.1016/j.atmosres.2021.105993 - 28.
Nischal S, Saini R, Pathaikara A, Punde P, Attada R. Hydrological extremes in Western Himalayas-trends and their physical factors. In: Natural Hazards – New Insights. London, UK: IntechOpen; 2023 - 29.
Hunt KMR, Turner AG, Shaffrey LC. The evolution, seasonality and impacts of Western disturbances. Quarterly Journal of the Royal Meteorological Society. 2018; 144 :278-290. DOI: 10.1002/qj.3200 - 30.
Dimri AP, Thayyen RJ, Kibler K, Stanton A, Jain SK, Tullos D, et al. A review of atmospheric and land surface processes with emphasis on flood generation in the southern Himalayan Rivers. Science of the Total Environment. 2016; 556 :98-115. DOI: 10.1016/j.scitotenv.2016.02.206 - 31.
Hunt KMR, Turner AG, Schiemann RKH, Norris J, Carvalho LMV, Jones C, et al. WRF simulations of two extreme snowfall events associated with contrasting extratropical cyclones over the Western and Central Himalaya. Journal of Geophysical Research: Atmospheres. 2015; 120 :3114-3138. DOI: 10.1002/qj.4275 - 32.
Dimri AP, Allen S, Huggel C, Mal S, Ballesteros-Cánovas JA, Rohrer M, et al. Climate change, cryosphere and impacts in the Indian Himalayan region. Current Science. 2021; 120 :1012-1012 - 33.
Mishra AK. Quantifying the impact of global warming on precipitation patterns in India. Meteorological Applications. 2019; 26 :153-160. DOI: 10.1002/met.1749 - 34.
Rao VB, Franchito SH, Gerólamo ROP, Giarolla E, Ramakrishna SSVS, Rao BRS, et al. Himalayan warming and climate change in India. American Journal of Climate Change. 2016; 05 :558-574. DOI: 10.4236/ajcc.2016.54038 - 35.
Shekhar MS, Chand H, Kumar S, Srinivasan K, Ganju A. Climate-change studies in the Western Himalaya. Annals of Glaciology. 2010; 51 :105-112. DOI: 10.3189/172756410791386508 - 36.
Cannon F, Carvalho LMV, Jones C, Hoell A, Norris J, Kiladis GN, et al. The influence of tropical forcing on extreme winter precipitation in the Western Himalaya. Climate Dynamics. 2017; 48 :1213-1232. DOI: 10.1007/s00382-016-3137-0 - 37.
Pepin N, Bradley RS, Diaz HF, Baraer M, Caceres EB, Forsythe N, et al. Elevation-dependent warming in mountain regions of the world. Nature Climate Change. 2015; 5 :424-430. DOI: 10.1038/nclimate2563 - 38.
Bookhagen B, Burbank DW. Toward a complete Himalayan hydrological budget: Spatiotemporal distribution of snowmelt and rainfall and their impact on river discharge. Journal of Geophysical Research - Earth Surface. 2010; 115 :1-25. DOI: 10.1029/2009JF001426 - 39.
Li H, Haugen JE, Xu CY. Precipitation pattern in the Western Himalayas revealed by four datasets. Hydrology and Earth System Sciences. 2018; 22 :5097-5110. DOI: 10.5194/hess-22-5097-2018 - 40.
Anders AM, Roe GH, Hallet B, Montgomery DR, Finnegan NJ, Putkonen J. Spatial patterns of precipitation and topography in the Himalaya. Special Paper of the Geological Society of America. 2006; 398 :39-53. DOI: 10.1130/2006.2398(03) - 41.
Shrestha D, Singh P, Nakamura K. Spatiotemporal variation of rainfall over the central Himalayan region revealed by TRMM precipitation radar. Journal of Geophysical Research – Atmospheres. 2012; 117 :1-14. DOI: 10.1029/2012JD018140 - 42.
Bolch T, Shea JM, Liu S, Azam FM, Gao Y, Gruber S, et al. Status and Change of the Cryosphere in the Extended Hindu Kush Himalaya Region. Cham: Springer; 2019. DOI: 10.1007/978-3-319-92288-1_7 - 43.
Boschi R, Lucarini V. Water pathways for the Hindu-Kush-Himalaya and an analysis of three flood events. Atmosphere (Basel). 2019; 10 :1-32. DOI: 10.3390/atmos10090489 - 44.
Fowler HJ, Archer DR. Conflicting signals of climatic change in the upper Indus Basin. Journal of Climate. 2006; 19 :4276-4293. DOI: 10.1175/JCLI3860.1 - 45.
Dimri AP, Dash SK. Wintertime climatic trends in the Western Himalayas. Climatic Change. 2012; 111 :775-800. DOI: 10.1007/s10584-011-0201-y - 46.
Kripalani RH, Kulkarni A, Sabade SS. Western Himalayan snow cover and Indian monsoon rainfall: A Re-examination with INSAT and NCEP/NCAR data. Theoretical and Applied Climatology. 2003; 74 :1-18. DOI: 10.1007/s00704-002-0699-z - 47.
Baudouin JP, Herzog MA, Petrie C. Cross-validating precipitation datasets in the Indus River Basin. Hydrology and Earth System Sciences. 2020; 24 :427-450. DOI: 10.5194/hess-24-427-2020 - 48.
Lucas-Picher P, Christensen JH, Saeed F, Kumar P, Asharaf S, Ahrens B, et al. Can regional climate models represent the Indian monsoon? Journal of Hydrometeorology. 2011; 12 :849-868. DOI: 10.1175/2011JHM1327.1 - 49.
Wang S, Dieterich C, Döscher R, Höglund A, Hordoir R, Markus Meier HE, et al. Development and evaluation of a new regional coupled Atmosphere-Ocean model in the North Sea and Baltic Sea. Tellus A: Dynamic Meteorology and Oceanography. 2015; 67 (1):24284. DOI: 10.3402/tellusa.v67.24284 - 50.
Singh D, Sharma V, Juyal V. Observed linear trend in few surface weather elements over the Northwest Himalayas (NWH) during winter season. Journal of Earth System Science. 2015; 124 :553-565. DOI: 10.1007/s12040-015-0560-2 - 51.
Hersbach H, Dee D. ERA5 reanalysis is in production, ECMWF newsletter 147. European Centre for Medium-Range Weather Forecasts. 2016; 147 :7 - 52.
Sillmann J, Kharin VV, Zwiers FW, Zhang X, Bronaugh D. Climate extremes indices in the CMIP5 multimodel ensemble: Part 2. Future climate projections. Journal of Geophysical Research – Atmospheres. 2013; 118 :2473-2493. DOI: 10.1002/jgrd.50188 - 53.
Chervenkov H, Slavov K. ETCCDI climate indices for assessment of the recent climate over Southeast Europe. Studies in Computational Intelligence. 2021; 902 SCI :398-412. DOI: 10.1007/978-3-030-55347-0_34 - 54.
Bhattacharyya S, Sreekesh S, King A. Characteristics of extreme rainfall in different gridded datasets over India during 1983-2015. Atmospheric Research. 2022; 267 :105930. DOI: 10.1016/j.atmosres.2021.105930 - 55.
Riley C, Rupper S, Steenburgh JW, Strong C, Kochanski AK, Wolvin S. Characteristics of historical precipitation in High Mountain Asia based on a 15-year high resolution dynamical downscaling. Atmosphere (Basel). 2021; 12 (3):355. DOI: 10.3390/atmos12030355 - 56.
Haque MA, Lal M. Space and time variability analyses of the Indian monsoon rainfall as inferred from satellite-derived OLR data. Climate Research. 1991; 1 :187-197. DOI: 10.3354/cr001187 - 57.
Xie P, Arkin PA. Global monthly precipitation estimates from satellite-observed outgoing longwave radiation. Journal of Climate. 1998; 11 :137-164. DOI: 10.1175/1520-0442(1998)011<0137:GMPEFS>2.0.CO;2 - 58.
Kumar A, Sarthi PP, Kumari A, Sinha AK. Observed characteristics of rainfall indices and outgoing longwave radiation over the Gangetic plain of India. Pure and Applied Geophysics. 2021; 178 :619-631. DOI: 10.1007/s00024-021-02666-6 - 59.
Prasad KD, Bansod SD. Interannual variations of outgoing longwave radiation and Indian summer monsoon rainfall. Int. J. Climatol. 2000. A Journal of the Royal Meteorological Society. 2000 Dec; 20 (15):1955-1956 - 60.
Dimri AP, Niyogi D, Barros AP, Ridley J, Mohanty UC, Yasunari T, et al. Western disturbances: A review. Reviews of Geophysics. 2015; 53 (2):225-246 - 61.
Dimri AP, Pooja JG, Mohanty UC. Western disturbances vs Non-western disturbances days winter precipitation. Climate Dynamics. 2023:1-23 [Online] - 62.
Dimri AP. Interannual variability of Indian winter monsoon over the Western Himalayas. Global and Planetary Change. 2013; 106 :39-50 - 63.
Rao VB, Rao ST. A theoretical and synoptic study of Western disturbances. Pure and Applied Geophysics. 1971; 90 (7):193-208