Open Access is an initiative that aims to make scientific research freely available to all. To date our community has made over 100 million downloads. It’s based on principles of collaboration, unobstructed discovery, and, most importantly, scientific progression. As PhD students, we found it difficult to access the research we needed, so we decided to create a new Open Access publisher that levels the playing field for scientists across the world. How? By making research easy to access, and puts the academic needs of the researchers before the business interests of publishers.
We are a community of more than 103,000 authors and editors from 3,291 institutions spanning 160 countries, including Nobel Prize winners and some of the world’s most-cited researchers. Publishing on IntechOpen allows authors to earn citations and find new collaborators, meaning more people see your work not only from your own field of study, but from other related fields too.
In just a time span of 5 years, northcentral Nigeria has experienced about three earth tremors. Public commentators were quick to attribute the tremors to the over-abstraction of groundwater and construction activities in the area. This study sets out to investigate the cause of tremors in the study area and develop a scientifically viable method that predicts areas prone to earth movement in the event of future tremors using integrated techniques (geophysical, hydrogeological, nuclear, and GIS). The results obtained confirmed the incidences of tremors in parts of northcentral Nigeria. Field and other evidence obtained suggest that the tremors were caused mainly by quarry activities in parts of the area. This suggestion was corroborated by results obtained from the surface manifestation of movements, radon in the groundwater, quarry proximity, slope, etc. Also, the study discovered substantial radiological implications associated with radon in groundwater because of earth movement. It also confirmed as baseless the notion of associating the tremors in the area with the over-exploitation of groundwater. Finally, the study came up with a method that predicts areas prone to earth movement in the event of future tremors in the area and categorized them based on their likelihood of experiencing movement as highly likely, likely, and not likely.
Department of Geology, Bayero University, Kano, Nigeria
Zainab Tukur
Department of Biological Sciences, Bayero University, Kano, Nigeria
Idris Isa Funtua
Center for Energy Research and Training, Ahmadu Bello University, Zaria, Nigeria
Musa Abdullahi Ali
Department of Geology, Bayero University, Kano, Nigeria
Ewa Kurowska
Department of Forest Engineering, Poznan University of Life Sciences, Poland
Musa Suleiman Abdulhamid
Department of Physics, Bayero University, Kano, Nigeria
Adam Suleiman Murtala
Department of Geology, University of Jos-Nigeria, Nigeria
*Address all correspondence to: asabdullahi.geo@buk.edu.ng
1. Introduction
Despite the general belief that Nigeria is not situated on any recognized active seismic belt, quite a few earth tremors have been recorded since 1933 [1]. These tremors suggest that Nigeria may not be as aseismic as earlier envisioned. The intensities of these seismic events varied from 3.0 to 6.0, according to Akpan and Yakubu, 2010. These earthquake events were not given the needed attention by relevant authorities until lately. According to the National Space Research and Development Agency (NASRDA), one of the tremor events in northcentral Nigeria, which happened on Friday, September 7, 2018, at 5:11:32 am, had a moment magnitude of 2.6 and a local magnitude of 3.0. These seismic activities have prompted renewed calls for proper investigations of earthquake possibility, particularly in northcentral Nigeria. However, conflicting attempts to reveal their source have led to assumptions on whether these earth tremors are tectonic or non-tectonic related [2]. Therefore, there is a need for scientific-based evidence to explain the origin and potential impact of these earth tremors. Shiwua [3] suggested that the incidence of earth tremors should not be overlooked because frequent tremors could be a build-up and forewarning of a major earthquake. Moreover, the lack of intraplate earthquakes makes them unpredictable, resulting in adverse consequences. Even with the occurrence of these events in Nigeria, practical measures such as the establishment of a database on groundwater quality, quantity, dynamics, vulnerability, and structural reinforcements for slope stability and to break floods, for example, are not well thought out.
According to Adepelumi et al. [4], a faulting event that resulted in previous earth tremors experienced in northcentral Nigeria was probably provoked by massive quarrying and blasting activities in the area. Despite the stress analysis conducted by the study, this concept is overly simplistic. Oluyide and Okunola [5] attributed the tremors in north-central Nigeria to non-tectonic slope instability and avalanches.
This study aims to develop a method that has the potential of predicting areas prone to movement in the event of future tremors in the study area. It seeks to reiterate why it is imperative to integrate the obvious knowledge of earth’s dynamism and Nigeria’s seismicity history. Achieving this may lead to measures that might aid the confining subsurface tectonic activities, limit potential damages resulting from earthquakes, and considerably reduce the potential risks to humans.
A unique aspect of this work is the incorporation of radon gas as a parameter in the prediction of earth movement, which ordinarily is not the case in most work of this nature. Natural disasters have a great influence on the national economy and social development. The precursors and prediction unavoidably remind one of the times when people tried to relate previous observable phenomena to an earthquake. Earlier observations were about changes in the water level in wells, distinct spring flows, and the burning and cracking of the land. Today, it may be difficult to observe these phenomena; however, they may be quantified, and other parameters that cannot be detected without instruments are monitored.
Radon is a natural gas that is produced in geogenic materials through the radioactive decay of the radium element. Radon can leave rocks and soils more easily by escaping into fractures and pore spaces between grains of soil. Measurements of this gas both in soil and in groundwater have shown that spatial and temporal variations can provide knowledge about geodynamic events. Radon has potential use in earthquake prediction studies because its concentration variation in the subsurface has been observed to precede an earthquake. The first evidence of a correlation between radon and earthquake occurrence came from an observation of radon concentration in well water prior to the Tashkent earthquake of 1966 [6]. This evidence stimulated research work in this area soon afterward in many countries. Radon observations, both in soil gas and in groundwater, revealed many premonitory changes in its concentration before an earthquake [7, 8, 9, 10, 11, 12, 13, 14, 15, 16]. As a result of these experimental correlations, radon is considered one of the few promising signs that can be used in earthquake prediction studies.
The first measurements of radon as a seismic precursor dated back to 1927, but the first recording that encouraged research on seismic precursors was detected before the Tashkent earthquake of 1966. The pre-earthquake stress gradients mobilized underground fluids, carrying some dissolved gases to the near-surface region, mainly through faults, lineaments, and thermal areas [16]. This kind of anomaly may sometimes last for a short duration; therefore, continuous monitoring of sub-soil radon is necessary to correlate such anomaly with earthquake.
To set up an automatic radon monitoring station, geologically sensitive locations are selected for the measurement of subsoil radon concentrations. This suggests a relationship between the investigated indicators and tectonically related processes related to the tremors. These signs are further classified into: (a) radon exhalation from the earth’s crust; (b) exhalation of helium, argon, and others; (c) temporal variation in water level or discharge of springs; and (d) temporal variation in temperature and dissolved ions in the water of the monitoring sites [17].
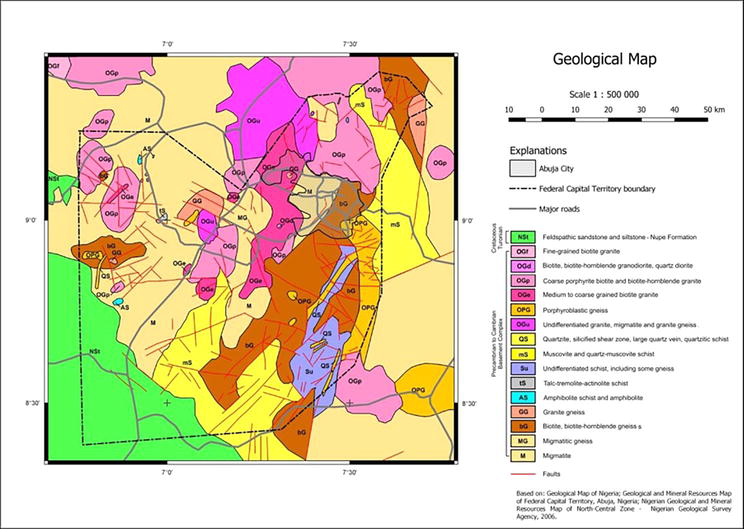
The area covered by this work is located within latitude 9° 03′ 28.26” N and longitude 7° 29′ 42.29″ E. It covers the entire Federal Capital Territory (FCT) (Figure 1). The widespread rock units of this area consist of “Older granites” of the pan-African granitoid and migmatite-gneiss complex. This comprises an inhomogeneous cluster of gneisses (ortho- and para-), migmatites, and successions of basic and ultrabasic rocks. Petrographically, the pan-African Orogeny caused the recrystallization (via partial melting) of the migmatite and gneissic rocks.
Figure 1.
Updated geologic map of the FCT based on field investigation and complemented by [18] (geologic and mineral resources map of the FCT) (inset: Map of Nigeria depicting the location of the study area).
The migmatite-gneiss complex comprises rocks that vary between 600 million years and 3 billion years, that is, from pan-African to Eburnean, which is reflected by the numerous chrono-successions of the migmatite-gneiss complex, the majority of which originated during the orogenic cycle. The rocks of the migmatite-gneiss complex are characterized by varying mineralogy, chemical composition, texture, and structure. These variations are attributable to the progressive/gradual regional metamorphism of meta-sedimentary rocks [19].
The methods utilized in this study are divided into: (a) geological, (b) hydrogeological, (c) geophysical, (d) nuclear, and (e) geographic information systems (GIS). These methods are discussed further based on the objectives of the study as follows:
Detailed field studies of structural patterns and geology of parts of northcentral Nigeria affected by tremors.
Geophysical study of the area to ascertain the different subsurface geologic units and groundwater saturation of each unit.
Evaluation of the trend of earth movement and its effect on groundwater quality, quantity, vulnerability, and dynamics in the area.
Determination of the cause of sudden movement within the subsurface of the area.
Evaluation of the safety or otherwise of activities such as borehole drilling, quarrying activities, sand mining, and construction activities on earth movement in the area.
The study area was gridded, and measurement was taken for each of the methods (geophysical, hydrogeology, nuclear, and geological investigations) aimed to achieve the following:
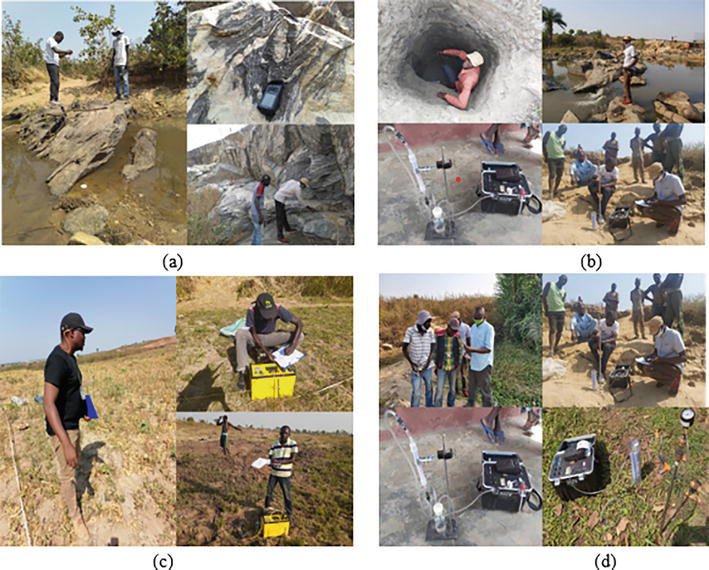
Geological investigations: This involves the study of geological structures and their trend, lineaments, and rock types in the study area (depicted in Figure 2).
Hydrogeological investigations: This entails the study of hydrochemical/physicochemical parameters of groundwater, water table, flow pattern, aquifer types and production of hydrogeological map, and compliance of water quality to national and international standards.
Geophysical investigations: This entails the study of gravity maps, electrical resistivity profiling, geo-electric section production, production of basement relief map, slope and water percolation investigation, and earth movement prediction.
Nuclear technique: The technique involves the measurement of radon in groundwater and the evaluation of its seismic relationship and radiological implication on the health of the inhabitants of the area, radon exhalation and emanation coefficient in rocks, evaluation of seismic relationships, determination of the structure regarded as radon entry points, and the radiological implication of air quality in the area.
Geographic information system (GIS): The technique employed to produce the digital elevation model (DEM), lineament extraction, superimposition of different maps for information deductions, and update of geologic and other maps of the area.
Figure 2.
Photograph of the (a) geology team depicting some activities, (b) hydrogeology team taking the measurement of water quality parameters, (c) geophysical team conducting vertical probing of subsurface geo-electric layers, and (d) nuclear team conducting radon measurement in groundwater sample and depth profiling.
The techniques above were utilized to derive/deduce relevant information with regard to earth movement, faulting, radon entry points, groundwater quality and quantity, radiological implication, and prediction/forecasting of areas prone to movement in the case of future tremors.
3.1 Radon measurement in groundwater and subsoil
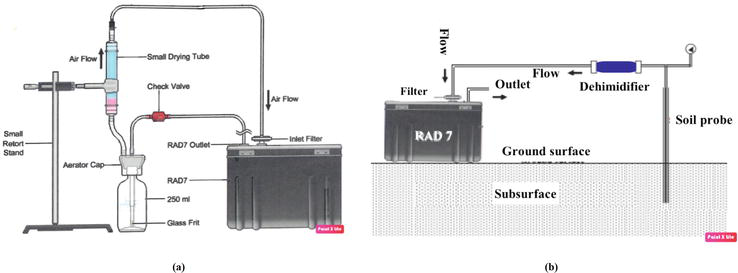
The setup for radon in the groundwater is designed to achieve the close loop concept of measuring radon in water as provided in the RAD 7 manual (Figure 3a). A detail of the protocol of radon measurement in groundwater and subsoil can be found in [19].
Figure 3.
(a) Setup adopted during in situ measurement of radon concentration in groundwater [20]; (b) setup for soil radon depth profiling.
3.1.1 Radon in groundwater
As discussed above, radon has potential use in earthquake prediction studies because its concentration variation in the subsurface radon has been observed to precede an earthquake. The first evidence of a correlation between radon and earthquake occurrence came from observing radon concentration in groundwater before the Tashkent earthquake of 1966 [6]. Radon concentration in groundwater from different locations in the study area was used as one of the parameters for the predictive method and is given a weight of five (5).
3.1.2 Radon in the subsoil
Radon observations, both in soil gas and in groundwater, revealed many precursory changes in its concentration before an earthquake [7]. As a result of these experimental correlations, radon is considered one of the few promising precursors that can be used for earthquake prediction studies. Radon in the subsurface is also used as an input in the method developed and was given a weight of five (5).
3.1.3 Groundwater percolation
Percolation is the movement of water through the soil itself. Percolation contributes greatly to earth movement by initiating the movement of the mass of rock, debris, or earth down a slope under the direct influence of gravity. In this method, percolation was also used as one of the parameters and was given a weight of ten (10).
3.1.4 Elevation
The elevation is a factor that can be responsible for inducing slope instability. Higher elevation has been attributed to increased surface runoff. There is also evidence that suggests elevation has a major influence on the spatial and temporal distribution of the landslides. In this study, elevation was also considered as a parameter and was given a weight value of ten (10).
3.1.5 Quarry proximity
The work conducted has discovered that quarry activities in the study area are the main culprit implicated for earth movement in the tremor, which results in the tremors being felt. Also, it was discovered that surface manifestation of earth movements in the area is closely related to quarry proximity, meaning that all movement manifestations observed were proximally close to the quarries or far from the quarries. Therefore, quarry proximity was also used as a parameter in the prediction method and was given a weight value of ten (10) because it’s a major contributor to earth movement.
3.1.6 Lineament
Lineaments are structurally controlled linear or curvilinear features identified by their relatively linear alignments. It is a linear feature in a landscape that is an expression of an underlying geological structure such as a fault. Lineament narrates in detail a much broader and more pertinent structural pertain that may be an indication of possible areas affected by movement within the subsurface. In the methods developed, lineament is one of the most important features showing subsurface elements or structural weaknesses such as faults and, as a result, is a parameter that is taken into consideration and assigned a weight value of five (5).
3.1.7 Slope/basement relief
The outward and downward displacement of slope-forming materials under the influence of gravity is greatly influenced by the slope. Once rock material is broken down into smaller, unstable pieces by weathering, the material has the potential to move down the slope. The steeper the slope, the greater the potential for gravity to pull earth material down a slope, and as a result, the slope is also a major parameter considered in the development of this method. In this case, the slope is assigned a weight value of ten (10). The consideration of basement relief as a parameter in the development of the prediction method is because it is a sloppy continuation in the subsurface. It has the tendency of influencing subsurface movement, especially when associated with percolation and groundwater abstraction.
The total weight value assigned to all the eight parameters considered in the prediction method is sixty (60), and the earth movement prediction map that could be generated will categorize an area as likely (weight between 40 and 60), moderately likely (between 20 and 39), and unlikely (between 0 and 29).
3.2 Validation of the method
The prediction method (RQ-PABLES METHOD) developed for the prediction of areas prone to earth movement was validated in the field using areas/locations with a surface manifestation of movement and quarry proximity. The method was developed using cumulative weight assigned and generated from seven parameters, namely, percolation, elevation, radon in groundwater/radon in sub-soil, lineament, quarry proximity, basement, and slope. The weight value ranges from 1 to 10 depending on the influence of each of the parameters that could result in triggering the earth movement.
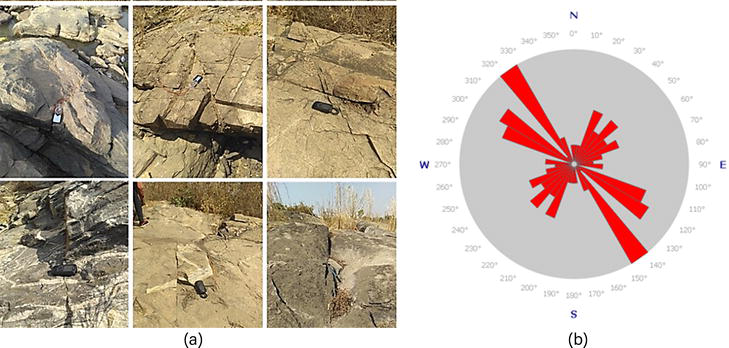
The occurrence of earth tremors contradicts the earlier thought of the aseismic nature of Nigeria. It is relevant to mention that some of the villages and towns troubled by the recent seismicity are located on the Atlantic fracture system. As suggested by Adepelumi et al. [4], the SW-NW trend of the fault makes that stretch of land vulnerable to seismicity because of stresses produced within the earth’s crust, that is, partial reactivation of the ancient faults. Displacements and fractures were explored in different outcrops across several localities in Abuja possibly associated with the NNE–SSW faults, and their orientations were measured. A collection of the observed faults and fractures are presented in Figure 4a. The mapped fracture trends (Figure 4a) define a major NW-SE trajectory as shown on the rosette plots (Figure 4b). Logically, the measured trends might denote that the tremor is tectonic based on the regional geological background (the North Atlantic fracture systems), field measurements of the structural patterns, and prior aeromagnetic data. However, this rationale is subjective and hindered by the dearth of seismic data. Goki et al. [2] in their study related the recurring earth tremors to the reactivation of fault systems associated with these Atlantic Fracture Zones. This deduction is supported by the fact that the tremor epicenters of the recent Mpape tremor in Abuja fall along the major fractures and their projections appear to align with the Chain Fracture Zone in the Atlantic. However, the mechanism for the reactivation was not fully elaborated on or explained by Goki et al. [2]. Based on our observations carried out around quarry sites, reports from inhabitants in the vicinity insinuate that the earth’s tremors can be linked to the current pervasive and uncoordinated detonating and blasting activities performed at quarry sites. Accordingly, the new fractures crosscutting the major faults of the gneissic basement complex were noted at the quarry sites as well as road cuts (Figure 5). Although it was not established if these new fractures were deep-seated, the discordance and fractures they created are evidence that supported the reactivation theory.
Figure 4.
(a) Fracture trends from field measurements on granitic rocks. (b) Rose diagram indicating the NW-SE trend of the fractures.
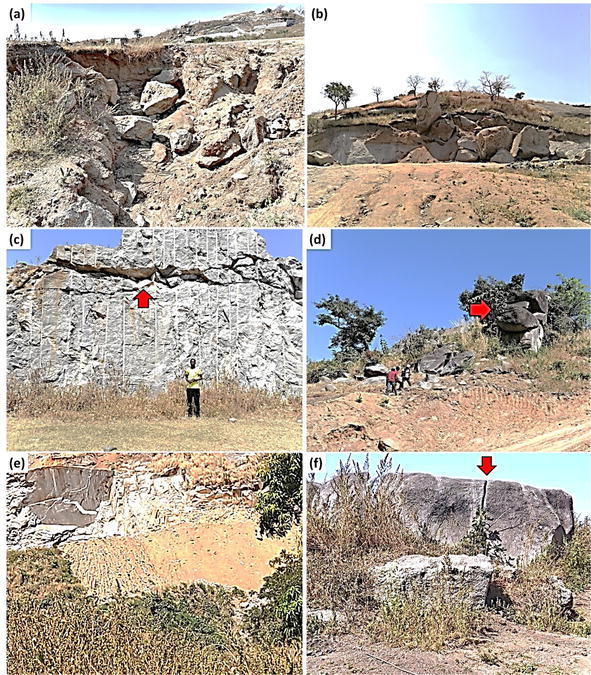
Figure 5.
Field photographs of (a) rock slump, (b) clusters of fragmented boulders at Mpappe, (c) major fracture at a road cut at Wasse, (d) boulders set at a hill at Bwari, (e) landslide behind a quarry site at Dutsen Alaji, and (e) fragmented granite boulder.
Most of the structures observed in the field are northwest–southeast oriented (Figure 4a and b) and are mainly found around areas with high quarrying activities such as Mpape and Dutsen-Alaji. These structures were neither found to be associated with certain rock types nor appear to be induced by human activities in those areas. An important field observation was the identification of some volcanic rocks (basalt and pumices) in the study area, which were not reported by earlier works in the area. This development needs to be followed up to ascertain the extent and nature of occurrences.
4.1 Parameters of movement prediction
The parameters used in the prediction of locations prone to movement in the case of future tremors in the area are radon in groundwater, radon in the subsoil, percolation, elevation, quarry proximity, lineament, slope, and basement configuration. These parameters were assigned weighted values depending on their perceived contribution to earth movement as indicated earlier.
4.1.1 Radon in groundwater
A summary of the result of the measurement of radon in 128 samples of groundwater is provided in Table 1. These include the activity concentration of radon in groundwater from the area, which ranges from 609.00 to 92,500.00 Bqm−3 (0.61 to 92.50 BqL−1) with a mean value of 16628.19 Bqm−3 (16.63 BqL−1). These values exceeded both the EPA’s MCL of 11.1 BqL−1 and the NIS limit of 0.1 BqL−1. The calculated annual effective dose due to ingestion and inhalation of groundwater from the area ranged from 0.13 to 19.43 mSvy−1 with an average of 3.49 mSvy−1 for ingestion, while the range was 0.002 to 0.23 mSvy−1 for inhalation and a total annual effective dose with a range between 0.13 and 19.66 mSvy−1 with an average of 3.53 mSvy−1.
Radon in groundwater (Bq/m3)
Radon in groundwater (Bq/L)
Annual effective dose from ingestion (mSv/y)
Annual effective dose from inhalation (mSv/y)
Total annual effective dose
TDS (mg/L)
TUB (NT)
COND (mS/cm)
TEMP (°C)
pH
(mSv/y)
Lowest
609
0.61
0.13
0.002
0.13
1.03
0.24
8.72
25.5
1.53
Highest
92500
92.5
19.43
0.23
19.66
548
429
1457
39.28
14
Mean
16628.19
16.63
3.49
0.04
3.53
127.46
19.81
194.32
32.1
6.76
Table 1.
Highest, lowest, and mean values recorded for radon in the groundwater; calculated annual effective dose due to ingestion and inhalation; total annual effective dose; and some physicochemical parameters.
TUB = turbidity, COND = conductivity, TEMP = temperature.
Radon at 0.33m (Bq/m3)
Radon at 0.66m (Bq/m3)
Radon at 0.99m (Bq/m3)
In-situ radon diffusion length at 0.33 (m)
In-situ radon diffusion length at 0.66 (m)
In-situ radon diffusion length at 0.99 (m)
Min
15.2
15.2
10.02
0.005
0.005
0.003
Max
48,500.00
59,600.00
81,200.00
15.96
19.62
26.73
Ave
4,257.47
5,061.19
9,993.15
1.4
1.67
3.29
Table 2.
Values at depths below earth’s surface.
The dose coefficients given in ICRP Publication 137 were determined based on a dosimetry approach. This considers the physical phenomena that determine the distribution of radionuclides in the body to quantify the energy deposited per unit mass in the various regions of the body. It also gives a weighting based on the toxicity of the radiation and the radiosensitivity of the tissues using an epidemiological approach.
4.1.1.1 Radon in groundwater as a precursor to earth movement
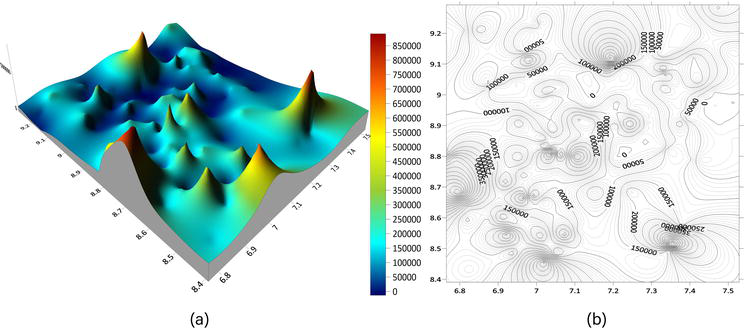
The results of radon in groundwater suggest that radon in groundwater from the study area is closely related to other physicochemical parameters of the water such as temperature, and this might not be unconnected with the local geology of the area, geothermal gradient, depth to aquifers, and the possibility of radon entry point created by seismic activities experienced in the area in the past 5 years, which causes radon release from basement fractures into groundwater bodies. The tainting of groundwater by radon gas to the spatial extent (Figure 6) seen in these results might also suggest the widespread nature at which radon entry points are created within the surface. Movements within the subsurface potentially create openings (fracture) within the basement, which are referred to as “radon entry points” through which radon gas is exhaled into groundwater bodies in both primary and secondary fractures, which serve as an aquifer.
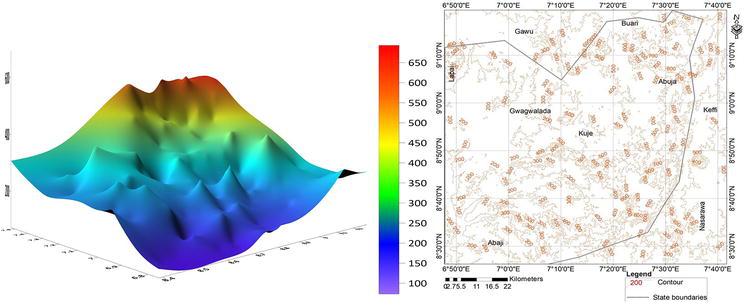
Figure 6.
Radon activity concentration in groundwater: (a) 3D map; (b) contour map.
4.1.1.2 Radon in the subsoil as a precursor to earth movement
Radon profiling at different depths (0.33, 0.66, and 0.99 m) within the subsurface was conducted at 130 locations that covered the entire study area. Radon activity concentration in soil at a depth of 0.33 m (33 cm) ranged from 15.20 to 48,500.00 Bq/m3 with an average value of 4257.47 Bq/m3. At a depth of 0.66 m (66 cm) below the ground surface, the values obtained ranged from 15.20 to 59,600.00 Bq/m3 with a mean of 5061.19 Bq/m3, while at 0.99 m (99 cm) below the ground surface, the values recorded ranged from 10.02 to 81,200.00 Bq/m3 with a mean value of 9993.15 Bq/m3. About 88.5% of the values recorded were observed to have exceeded the 200 Bq/m3 action level recommended by the International Commission on Radiological Protection (ICRP). High radon activity concentration coupled with the downward increase in radon within the subsurface may also be a pointer to the effect of seismic activities experienced in the study area during recent times. Earth tremors recently experienced in the area might have caused some openings (fractures) within the basement rocks, which eventually serve as radon entry points into groundwater and the overburden. Naturally, radon from the basement travel upward into the overburden, and this might manifest in the form of radon increase with depth. This result clearly indicates how radon activity concentration in the area increases with depth (Table 2).
4.1.2 Lineament
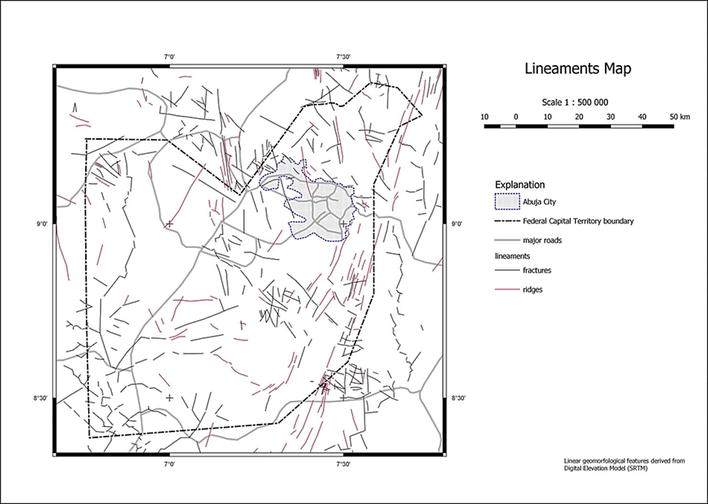
Lineament density depicts the frequencies of subsurface movement represented by subsurface structures such as fractures, veins, joints, and other indicators of points of weakness in the subsurface. Simply put, a lineament is a linear feature in a landscape that is an expression of an underlying geological structure such as a fault. Typically, a lineament appears as a fault-aligned valley, a series of fault or fold-aligned hills, a straight coastline, or indeed a combination of these features. The lineament map of the study (Figure 7) indicates higher lineament densities around the northeastern, southeastern, southwestern, and northwestern portions of the study area, while the central and western portions have the lowest density in that order. This suggests that the subsurface movement is likely to be intense in that same order. This also corresponds to the basement relief map (Figure 7), suggesting that movement is likely to be intense at depth. These are also areas where radon entry into groundwater is expected.
Figure 7.
Lineament density map of the study area.
4.1.3 Basement relief and slope
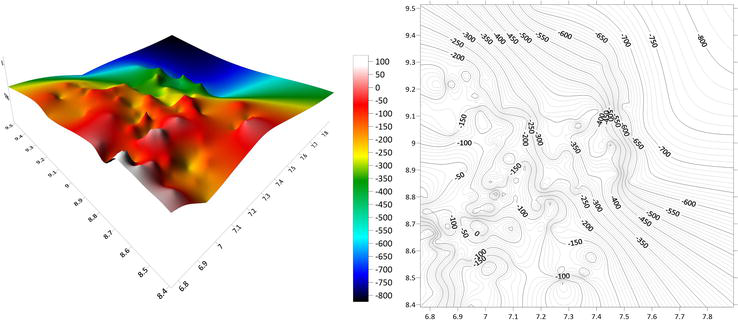
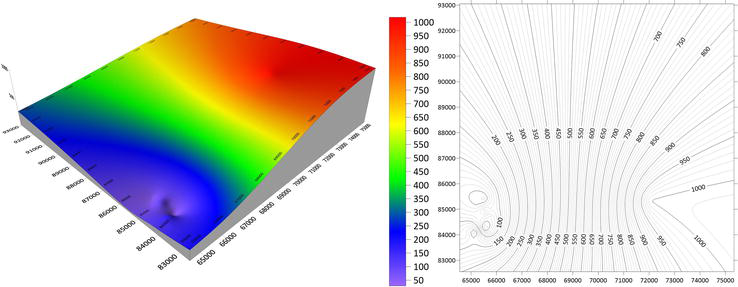
The basement relief as extracted from vertical electrical sounding result indicates that the basement is the deepest in the northeastern part of the study area (Figure 8) and shallower in the central portions, while it is intermediate in the southwestern part. This means that the thicker overburden is in the northeastern part, while it is thinner in the central part of the study area. In terms of slope, which significantly has a control on earth movement with slight triggers, especially when percolation is high, even the central portion, where the basement is shallower, is an area with potential for earth movement/landslide.
Figure 8.
3D basement relief/slope map of the study area.
4.1.4 Elevation
Elevation in the study area is the highest around the northeastern parts, while it is the lowest in the southwestern part. The north–south and northwestern portions are relatively flattened, while the other parts are rugged and mountainous. Most of the quarries are situated in areas of high elevation, where outcrops are dominant (Figure 9).
Figure 9.
3D elevation and contour map of the study area.
4.1.5 Quarry proximity
The quarry sites in the study area are mostly located in the northeastern and southeastern parts. A plot of quarry proximity to a particular location gives an insight into the possibility of a quarry activity having a significant effect on the stability of that area. This result suggests that this effect is intense in the northeastern–southeastern parts, while it is the lowest in the western parts (Figure 10).
Figure 10.
3D quarry proximity and contour map of the study area.
4.1.6 Groundwater percolation
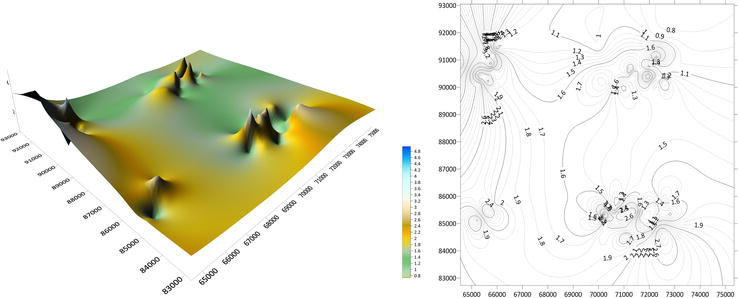
The groundwater saturation within the subsurface for a particular area can influence the stability of the area, especially when the effect of slope in such an area is intense. Ordinarily, the movement of the earth material on the sloping terrain is down a gradient. Therefore, in areas saturated with groundwater, especially when the earth material around those areas is made of clays, the slightest trigger or agitation can cause the earth material to move downslope. In this study, areas identified as vulnerable to movement because of groundwater saturation are the northwest, southwest, northeast, and around the southwestern portion of the study area (Figure 11).
Figure 11.
3D and groundwater percolation contour map of the study area.
4.2 Earth movement prediction
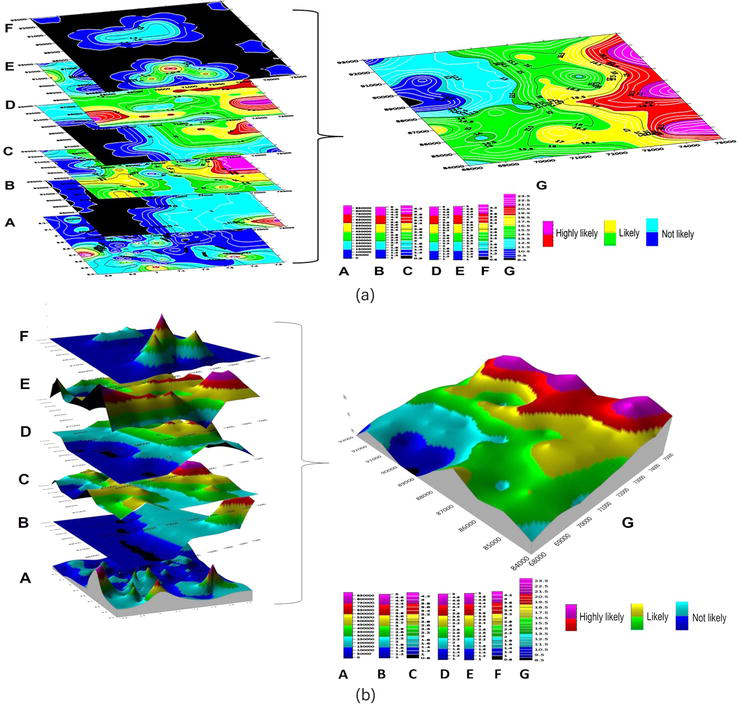
The earth movement prediction map was produced from the cumulative weight of all weighted averages extracted from radon, lineation, quarry proximity, slope, elevation, and groundwater percolation maps. These maps were generated from the measurements made in situ during the field campaign. The superimposition of all the maps generated can give insights into the likelihood of areas that could experience movement in the event of future earthquakes or earth tremors in the north-central part of Nigeria (Figure 11). These areas were categorized based on their likelihood of experiencing movement as highly likely, likely, and not likely (Figure 12a and b).
Figure 12.
(a) Superimposed 3D contour (b) surface maps of radon, quarry proximity, slope, elevation, lineament, and corresponding earth movement predictive map (A = radon in groundwater and subsoil, B = quarry proximity, C = slope, D = elevation, E = lineament, F = percolation, and G = predictive model).
4.2.1 Highly likely areas
The areas categorized as highly likely to experience earth movement in the event of a tremor or earthquake in the study area are mostly in the western parts of the study area. These areas also fall within locations where the surface manifestation of earth movement was observed during the field campaign. These areas include Mpape, Saupe, and Dushepe, all around the northeastern parts of the study area. These highly likely areas are further categorized into upper and lower or most highly likely, which are found around certain pockets of locations in the western parts of the study area around Burum, Sherete, and Gwau and highly likely (found close to the western edge and stretches/trends north southernly) (Figure 12a and b). Also, within the most likely areas are locations around Bogu, Tagwai, Kumeo, and Kashimoro, all around the southwestern parts of the area.
The relocation of quarry sites close to residential areas around this location is highly recommended to safeguard and protect likely damages in all ramifications in the area in the event of a future tremor.
4.2.2 Likely areas
The areas deduced as likely to experience movement in the event of future tremors are found in the north, south, and southwestern parts of the study area (Figure 12a and b) around Dakwa, Gwi, Gao, Yebu, Yabo, Nuku, Ebagi, and Abaji. These categories constitute/cover almost 50% of the study area. They are further categorized as most likely and likely. Most likely areas constitute about 30% of the total likely areas and are mostly found in the south, central, and northeastern parts of the area, while the likely areas constitute about 70% and are mostly located in the north, central, and southwestern parts of the study area. Surface manifestation of movement was observed neither in these areas nor in operational quarry sites. These areas are much safer than the areas discussed above; therefore, for the sake of the future, to obtain a license for quarry activities in these areas, there is the need to conduct and incorporate an earth movement prediction study in all environmental impact assessment reports. This is to make sure that the inhabitants are protected from any force majeure that could occur because of quarry activities.
4.2.3 Not likely areas
Areas categorized as “Not likely” are restricted to the northwestern parts of the study area (Figure 12a and b). Based on the assessment in this study, these areas are the safest; they are further categorized as “most unlikely and safe”. The safe areas are on the western and northwestern corners. The not-likely areas cover areas around Shimbo, Pate, Dako, Ghamgwa, and Babbantsauni villages. It was observed that areas with many quarries operating at the same time are more susceptible to stress build-up, which eventually triggers sudden earth movement. This phenomenon is likely the cause of tremors of higher intensities with resultant surface manifestations of movement observed around Mpape and its environment.
4.3 Effect of other activities on earth movement
The records of tremors in the study area have prompted so many speculations, which have not been scientifically proven as discussed earlier in the introduction. Some of the speculations are that the tremor was a result of the over-exploitation of groundwater in the area, while others tie it to massive construction activities in the area. All these speculations have not been proven scientifically.
4.3.1 Groundwater over abstraction
From the results obtained, this study has not discovered any effect of groundwater abstraction on tremors that were experienced in the area. The study also did not find any association between groundwater quality, as it relates to the tremor records in the area. With regard to quarry activities, this might have implications on groundwater dynamics in the area in two ways as follows:
Fractures created by blasting during quarry activities can change the groundwater flow direction. This direction is controlled by hydrodynamics, hydraulic heads, and interconnectivity between fractures.
Groundwater quantity in the area might be affected both negatively and positively.
Positively: As new fractures are created, the secondary porosity will be enhanced, serving as a groundwater storage conduit.
Negatively: The creation of fractures has the possibility of creating interconnectivity between fractures, which allows subsurface groundwater flow to change; as a result, groundwater levels from one location to another may change such that it decreases from one location and increases in another depending on the hydraulic characteristic of subsurface parameters related to groundwater.
These are possibilities that must be substantiated scientifically by monitoring certain parameters related to groundwater in the area over time.
4.3.2 Construction activities
Based on the finding of this study, apart from quarry activities, which may not be categorized under construction activities, other activities that are construction related do not result in tremors in the area as speculated by some commentators in the public domain. There is no doubt that the proliferation of quarry sites in the FCT has a direct implication on the resultant tremor that was felt many times around northcentral Nigeria, especially in the FCT.
This study set out to investigate reported cases of tremor in parts of northcentral Nigeria; study the causes and implications on groundwater quantity, quality, and dynamics; study the radiological implication of radon released into groundwater bodies because of the tremor; and study and come up with ways of determining areas prone to earth movement and mitigation measures to plan and contain future occurrence.
The study confirmed the incidences of tremors in parts of northcentral Nigeria. Field and other evidence obtained suggest that the tremors were caused mainly by the quarry activities in parts of the area. This suggestion was corroborated by results obtained from the surface manifestation of movements, radon in the groundwater, quarry proximity, slope, etc. Also, the study discovered substantial radiological implications associated with radon in groundwater because of the earth movement. The study also confirmed as baseless the notion of associating the tremors in the area with the over-exploitation of groundwater.
Finally, the study came up with a method that predicts areas prone to earth movement in the event of future tremors in the area.
5.1 Recommendations
This study did not attempt to find out the reasons behind the siting of quarries even in residential areas or areas already inhabited. Perhaps the siting/location of quarries in the FCT and environs is of dual objects: to explore and exploit the construction aggregate for the massive construction activities in the FCT or to pave the way or flatten rocky areas for future developmental activities; neither of these can be achieved without its advantages and disadvantages. The results discussed in this report are far-reaching in ascertaining the cause of tremor in northcentral Nigeria and its implications on the populace. To monitor future occurrences, mitigate effects, and reduce the possibilities and implications of the future occurrence due to activities of the likely culprits identified, the following recommendations are made:
Revocation, relocation, and reassigning of quarry licenses issued in the identified vulnerable areas.
Review and recommend more environmentally friendly blasting methods and procedures for quarry operators.
Include study of land movement and landslide possibilities in Environmental Impact Assessment (EIA) reports
Recommend standard distance for quarries from residential and other inhabited areas.
Conduct continuous quarterly radon assessments in groundwater to track and monitor spikes that could suggest earth movement.
Continuous monitoring of groundwater levels around FCT and environs to track quality, quantity, and dynamics, especially with regard to quarry activities in the areas.
The siting of licensed quarry should be well spaced such that, even if they operate at the same time, the stress built up would not be related in such a way that could trigger earth movement.
References
1.Tsalha MS, Lar UA, Yakubu TA, Kadiri UA, Duncan D. The review of the historical and recent seismic activity in Nigeria. IOSR Journal of Applied Geology and Geophysics (IOSR-JAGG). 2015;3(1):48-56
2.Goki NG, Onwuka SA, Oleka AB. Preliminary geological evidence for multiple tremors in Kwoi, Central Nigeria. Geo-environmental Disasters. 2020;7:22. DOI: 10.1186/s40677-020-00156-w
3.Shiwua AJ. Seismicity in Nigeria: The need for earthquake resistant structure. Zeszyty Naukowe Politechniki Częstochowskiej seria Budownictwo. 2013;19(1):171-178
4.Adepelumi AA, Ako BD, Ajayi TR, Olorunfemi AO, Awoyemi MO, Falebita DE. Integrated geophysical mapping of the Ifewara Transcurrent fault system, Nigeria. Journal of African Earth Sciences. 2008;52(4-5):161-166
5.Oluyide PO, Okunola OA. Hill-slope wash and rock avalanche in Nandu area, Gwantu District, Jema'a L. G. a. of Kaduna state. In: Onuoha KM, Ofodile ME, editors. Proceedings of the International Workshop on Natural and Man-made Hazards in Africa, Awka, Anambra State, Nigeria. Nigeria: Nigerian Mining and Geosciences Society; Jan. 31-Feb. 3, 1993
6.Ulomov VI, Mavashev BZ. A precursor of a strong tectonic earthquake. Academy of Sciences of the USSR Earth Sciences Sections. 1967;176:9-11
7.Talwani P, Moore WS, Chiang J. Radon anomalies and microearthquakes at Lake Jocassee, South Carolina. Journal of Geophysical Research. 1980;5(B6):3079-3088. DOI: 10.1029/JB085iB06p03079
8.Mogro-Campero RL, Fleischer RS. Likes Changes in subsurface radon concentration associated with earthquakes. Journal of Geophysical Research. 1980;85:3053-3057. DOI:10.1029/ JB085iB06p03053
9.Virk HS, Manwinder Singh NP. Singh Surinder Singh (1986) calibration of radon detectors. International Journal of Radiation Applications and Instrumentation. Part D. Nuclear Tracks and Radiation Measurements. 1986;12(1-6):739-742
10.Virk HS, Singh B. Radon anomalies in soil-gas and groundwater as earthquake precursor phenomena. Tectonophysics. 1993;227(1-4):215-224
11.Virk HS, Singh B. Correlation of radon anomalies with earthquakes in the Kangra Valley. Journal of Nuclear Physics. 1992;6(2):293-300
12.Virk HS. Uranium and radon surveys in western Himalayam. Current Science. 1997;73(25):536-538
13.Segovia N, de la Cruz-Reyna S, Mena M, et al. Radon in soil anomaly observed at Los Azufres geothermal field, Michoacan: A possible precursor of the 1985 Mexico earthquake (Ms = 8.1). Natural Hazards. 1989;1:319-329. DOI: 10.1007/BF00134830
14.King CY. Episodic radon changes in subsurface soil gas along active faults and possible relation to earthquakes. Journal of Geophysical Research. 1980;85:3065
15.Akpan OU, Yakubu TA. A review of earthquake occurrences and observations in earthquake science. Earthquake Science. 2010;23:289-294
16.Yang TF, Walia B, Chyi LL, Fu CC, Chen CH, Liu TK, et al. Variations of soil radon and thoron concentrations in a fault zone and prospective earthquakes in SW Taiwan. Radiation Measurements. 1992;40(2-6):496-502
17.Hartmann J, Levy JK. Hydrogeological and gas geochemical earthquake precursors – A review for application. Natural Hazards. 2005;34:279-304. DOI: 10.1007/s11069-004-2072-2
18.Geologic and Mineral Resources Map of Nigeria. Nigeria: Geological Survey of Nigeria (GSNA); 2006
19.Arabi AS, Zainab T, Funtua II, Mohammed AA, Ewa K, Abdulhamid MS, et al. Radon dynamics, activity concentration, and radiological risks associated with groundwater around tremor-prone Federal Capital Territory and environs, north-Central Nigeria. Arabian Journal of Geosciences. 2021;14:2479. DOI: 10.1007/s12517-021-08861-y
20.RAD 7 Manual. Electric Radon Detector Operational Manual. Durridge Company Inc.; 2019
Written By
Abdullahi Suleiman Arabi, Zainab Tukur, Idris Isa Funtua, Musa Abdullahi Ali, Ewa Kurowska, Musa Suleiman Abdulhamid and Adam Suleiman Murtala
Submitted: 22 February 2023Reviewed: 01 March 2023Published: 05 April 2024