Open Access is an initiative that aims to make scientific research freely available to all. To date our community has made over 100 million downloads. It’s based on principles of collaboration, unobstructed discovery, and, most importantly, scientific progression. As PhD students, we found it difficult to access the research we needed, so we decided to create a new Open Access publisher that levels the playing field for scientists across the world. How? By making research easy to access, and puts the academic needs of the researchers before the business interests of publishers.
We are a community of more than 103,000 authors and editors from 3,291 institutions spanning 160 countries, including Nobel Prize winners and some of the world’s most-cited researchers. Publishing on IntechOpen allows authors to earn citations and find new collaborators, meaning more people see your work not only from your own field of study, but from other related fields too.
This chapter sheds light on recent population trends in Tanzania. It explores the contribution of fertility, mortality, and migration to population growth. It uses social demography as an analytical framework to identify social, cultural, economic, and behavioral drivers of population trends. It highlights the importance of location most notably in rural areas where fertility rates are high and literacy is low. Rural-urban migration is also influential in driving recent urbanization. Because the majority of urban migrants are poor, low-skilled, and unemployed, this fuels high rates of poverty among urban youth. Their low human capital also restricts full participation in the productive economy, preventing the harnessing of a large dividend from recent demographic changes.
Open University of Tanzania, Dar-es-Salaam, Tanzania
*Address all correspondence to: christopher.awinia@out.ac.tz, chrisawinia@gmail.com
1. Introduction
This chapter explores the interrelationship between formal and social demography. Formal demography focuses on measuring formal demographic processes by relying on rigorous statistical and quantitative methods. It emphasizes quantification and statistical measures such as rates, ratios, and projections [1]. However, the field of demography has evolved over the past three decades to give increasing attention to social consequences [2] and drivers of the dynamics of fertility, mortality, and migration. These social forces include household structure, gender relations, culture, economic organization, and political economy [1, 2, 3]. Work in this vein includes Durkheim’s study of suicide rates and their relation to social structural arrangements [4]. With increasing population data from Tanzania’s Population and Housing Census, Demographic and Health Survey (DHS), and Household Budget Survey (HBS) Tanzanian demographers can increasingly study the social dimensions of recent demographic change, but also the implications of these demographic shifts.
Formal demography as a subfield relies on statistical methods and analysis to describe population trends and dynamics [3]. It studies quantitative aspects of population data and statistics [5]. It typically relies on advanced mathematical methods and modeling drawn from population censuses and surveys in order to present and forecast key population indicators. In Tanzania, the Population and Housing Census (Census) analyzes sex ratios, cohorts, population growth rates, trends, density, geographic distribution, household size, dependency ratio, housing and land ownership, and key population characteristics such as marital status, disability, orphanhood, literacy, occupation and employment, mortality, fertility, migration, and urbanization [3, 6].
Social demography, on the other hand, seeks to understand the dynamics that underlie formal demographic trends [7, 8, 9]. While formal demography provides statistical description, social demography analyzes underlying causes, enabling factors, and drivers of change [5]. It examines how demographic change relates to social and economic inequality, literacy levels, gender roles, and other social factors. Social demography also looks at how demographic patterns vary across different groups within a population, such as by race, ethnicity, and income groups. In summary, formal demography focuses on the mathematical and statistical analysis of population data, while social demography is concerned with understanding the socio-cultural context in which demographic patterns occur [1, 10].
Recent intercensal studies with data to inform social demography analysis in Tanzania include the DHS and HBS [11]. The DHS offers a comprehensive analysis of sample-size population and housing characteristics, household composition, parental survival, school attendance rates, access to water and sanitation, health insurance coverage, tobacco use, wealth index, birth registration, food security, fertility, contraceptive use, family planning, birth intervals, age at first marriage, sexual activity, child and maternal mortality, nutrition, care, gender-based violence, female genital cutting, women’s economic empowerment, malaria, and Human Immunodeficiency Syndrome (HIV) [10, 12]. In essence, they document the social context that underlies recent demographic change.
HBS on the other hand provides information on social implications of recent demographic change. In Tanzania, the HBS provides information on dwelling facilities and asset ownership, household size, composition and dependents, marital status, ownership of birth certificates, national identity cards, housing construction materials, number of persons sleeping in a room, housing tenure, housing connection to facilities and connection to the national electricity grid, sources of energy for lighting and cooking, drinking water, sanitation facilities, financial access, health and education, food security. Others are household expenditure, poverty, inequality, and time use [7, 13].
Current demographic changes in Tanzania can alter the core of its society [14]. These changes are themselves driven by social, cultural, economic, reproductive, biological, behavioral, and human development forces [10, 14]. In turn, they affect the rate of population growth, migration, fertility rate, and age structure [1, 5, 6, 15]. The Total Fertility Rate (TFR) at the time of writing this Chapter was 5.2 births per woman. The intercensal population growth rate (PGR) 2012–2022 was 3.7 percent translating to a population doubling time (PDT) of 22 years 2022–2044 [6].
2.1 Social demography methods
Tanzania’s social demography data come from three main sources, including the Census, intercensal surveys, and administrative records [16]. Census is usually conducted every 10 years and intercensal surveys every 5 years in between the censuses. Administrative data was being collected routinely, continually, and administratively [16, 17, 18].
The Census is a classical source for formal demographic analysis [9, 16, 19]. A population census is a total process of collecting, compiling, evaluating, analyzing, publishing, and disseminating demographic data taken at a specified time to all persons in a country or specified location of a country [6, 19]. The population census attempts a comprehensive coverage of the national population, yielding a large sample size that allows it to produce estimates to the smallest geographical levels, and population sub-groups. It produces core population statistics that can be used to calculate vital rates from civil registration data, and it also supplies the sampling frame for intercensal surveys.
There are several steps in preparing a census. The process begins with the demarcation of enumeration areas (EAs), producing questionnaires, preparation of instruction manuals, conducting a pilot census, and training of census personnel. Subsequently, the launching of publicity campaigns, preparing for data processing, tabulation, production, and dissemination of census results [18, 19, 20].
The Census methodology adopted was typical of formal demography. It has two types of questionnaires namely (a) a short-form questionnaire with 37 questions which are administered in about 70 percent of all enumeration areas and (b) a long-form questionnaire with 62 questions was administered to the remaining 30 percent of the enumeration areas. The questions in the short form include the respondents’ name, relationship to the head of household, sex, age, disability, marital status, citizenship, place of residence, the place where the respondent spends most of his/her daytime, birth certificate, literacy, education attainment, levels of education, general and maternal deaths, agriculture and livestock, citizen in diaspora, social security fund, and lastly the total number of persons in the household by sex. The long form includes 25 extra questions under the following themes:
Survival of parents
Place of birth
Place of residence
Education levels attained
Economic status
Fertility
Mortality
Housing conditions and ownership of selected assets
Census results were presented in district estimates broken down into rural and urban parts. Sample households for the long questionnaires were determined through cluster sampling where a cluster of an EA was first selected. Each district was divided into rural and urban parts. Within the rural and urban parts of the EA, a sample was selected at random with an equal probability by systematic sampling. The use of systematic sampling ensured a good balance between urban and rural representation in the sample from the districts.
Census information involves drawing estimation on the number of persons in the different categories such as educational attainment, number of children, or occupation usually analyzed by basic sex-age breakdown.1
The census provides a snapshot of population rates, ratios and distribution, and intercensal trends. It, however, does not provide information on underlying dynamics that drive observed demographic change. The main drivers of demographic change were fertility, mortality, and migration. Tanzania conducted intercensal surveys focused on behavioral, social, cultural, gender, income, and non-income determinants of main drivers of demographic change [9, 10, 16, 17]. Intercensal surveys were useful for collecting detailed social, economic, cultural, and political data, which cannot be accommodated in the full-scale census. They were also instrumental in identifying emerging issues in between censuses. Several factors were taken into account in determining the nature of questions to be collected in intercensal surveys. These included the information needs of stakeholders, information availability, international comparability, willingness of respondents to provide information, and resource availability. Intercensal surveys can take many forms including multi-subject, specialized surveys, multi-phased, panel, and longitudinal surveys [12, 16, 18, 22].
Social demographers in Tanzania rely on the DHS to link formal and social demography. The main objective of DHS is to calculate demographic rates including fertility, infant and child mortality, adult and maternal mortality, and disability. It also collected the following set of information to provide an explanation of social demography and demographic change. These include:
The HBS also used a two-stage cluster sample design. The first stage involved the selection of EAs as primary sampling units (PSUs) which were also based on the sampling frame that was delineated for the census. A total of 796 PSUs (69 from Dar-es-Salaam, 167 from other urban areas, and 560 from rural areas) were selected.
Social demographers also rely on routine administrative data that are compiled from various administrative processes. They were mainly extracted from vital statistics recorded in civil registration systems such as birth, death, divorce, school, hospital, employment, food production, distribution, market price information records, and statistics [13].
Intercensal surveys and administrative data provided vital information for triangulating formal and social demography. They allowed social demographers to delve into underlying dynamics that can explain the demographic change.
Tanzania’s population structure is changing, and these changes can have lasting effects on society, culture, economy, and political life. Already, the nation’s growth rate has been steadily rising since the first census in 1967. The population sex distribution had not changed significantly over the decades. However, the proportion of youth has increased where youth under 35 now account for more than half of the total population [6, 23, 24]. This is a significant demographic change because for the first time youth dominate the population pyramid, increasing the dependency rate, and subsequently as a proportion of the population under poverty [6, 23, 24, 25].
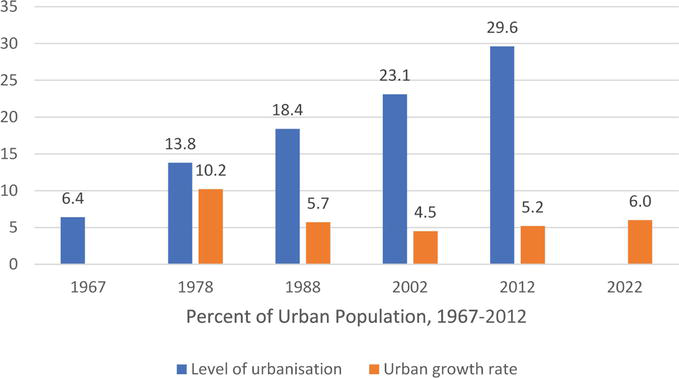
Another remarkable demographic change is urbanization [10, 26]. As seen in Figure 1, the percentage of urban population has steadily grown since the first post-independence census of 1967.
Figure 1.
Percent of urban population, source: Population and housing census, 2012.
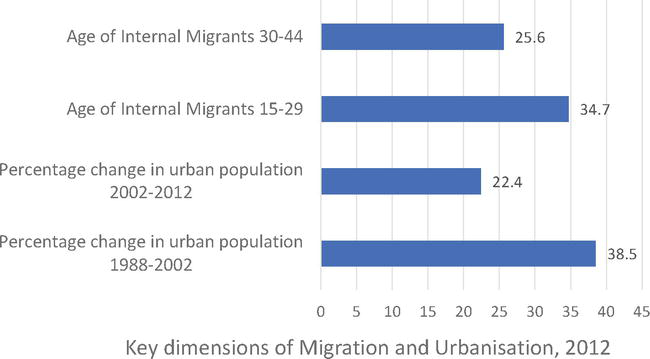
The rate of urban growth has remained high above the national rate of population growth of 3.2 percent [6, 14, 23, 24]. The concentration of youth was higher in urban areas, largely driven by youth-dominated rural-urban migration [26]. Dar-es-Salaam, the main urban center accounted for 31 percent of all internal migrants in 2012 (Figure 2).
Figure 2.
Key dimensions of migration and urbanization, source: Urban monograph, population and housing census, 2012.
The high proportion of youth among migrants means that urban areas can increasingly be described as young, poor, high fertility, and low-skilled [27]. Poverty is both an effect and driver of demographic change. Poor rural households had higher household population size, dependency rates, reported illness and injury, low literacy levels, and access to social amenities such as access to water supply, energy sources, and electricity [27].
A combination of urban migration, poverty, youthful population is transforming the urban population structure. The growth in urban youth population has been followed by high urban youth employment, the rise of street vendors, the rise of informal urban housing and settlements; and rising patterns of infectious diseases including new HIV transmissions, tuberculosis (TB), cholera, pulmonary infections; higher rates of Coronavirus (Covid) infections [28].
The potential gains from urbanization include increased commerce, trade, concentration of financial services, community infrastructure, and facilities, and better supply of utilities, housing, and transport. These served as “pull-factors” in the migration to cities. On the other hand, rapid urbanization increases traffic congestion, air pollution, informal housing and slums, sewerage pollution, and strain on existing urban infrastructure such as transport, housing, healthcare, schools, and water systems. Typically, urban areas had high inequality rates where the population living in disadvantaged parts of urban areas suffered from extreme poverty [10, 13, 19, 27].
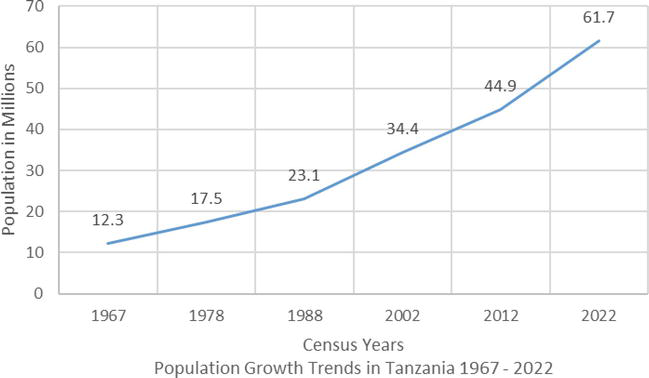
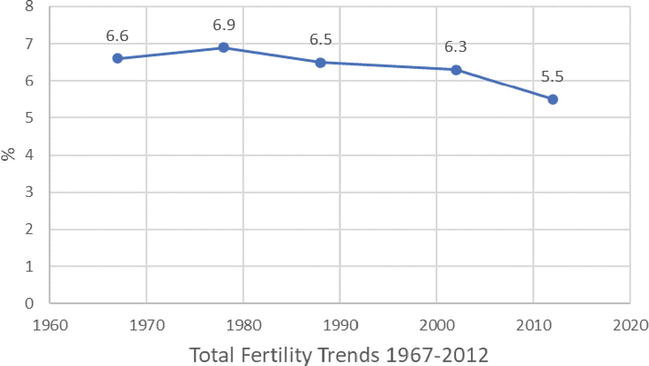
The growth of the national population also reflects patterns of fertility, age composition, urbanization, and changes in life expectancy [6, 14]. The country’s TFR has declined since the first census in 1967, but it still remains high. Population growth accelerated (Figure 3) [6] because fertility remained high (Figure 4), especially among adolescent and young women, low-income groups, and rural families.
Figure 3.
Population growth trends in Tanzania; source: Preliminary results, population and housing census, 2022.
Figure 4.
Total fertility trends; source: Preliminary results, population and housing census, 2022.
National fertility rates peaked between the late 1960s and the start of the new millennium and this “baby-boom” period has profound implications for Tanzania’s population and its economy [14]. The “youth bulge” from this period of growth can be turned into a positive “demographic divided” if proper attention is given to human capital development targeting this population group. Human capital in this instance refers to health, education, and skills needed to transform the economy; as well as access to decent employment [29]. However, the participation of youth in productive employment remains minimal. Although youth were the majority in the population pyramid, they were often uneducated or lacked relevant skills to take advantage of emerging economic opportunities, and were most vulnerable to new infections of HIV. In this case, they remained unharnessed for effective participation in economic transformation. This provides an important nexus between social demography, population studies, social policy, and economic development. This nexus needs to be studied carefully in order to determine the right policies needed to take advantage of population change.
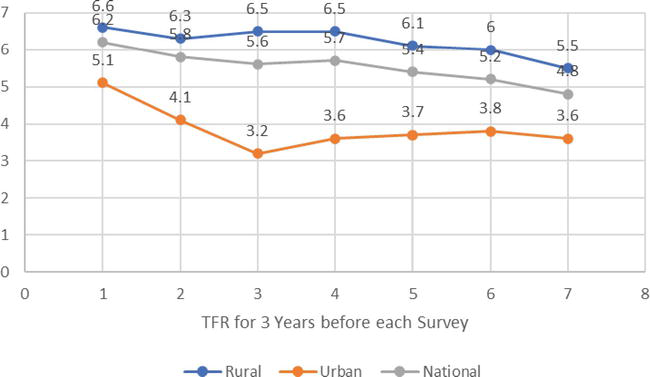
Even as fertility declines nationally, this decline is not even across population groups. The declines vary depending on several factors including rural location, age, level of education, and income. Empirical evidence shows main demographic groups with fertility rates above the average TFR were young women between 18 and 24; women who lived in rural areas, and among low-income groups [11, 12, 30, 31]. Empirical evidence from surveys and archives shows rural fertility was driving national trends nationally as shown in Figure 5.
Figure 5
Preliminary results, population and housing census, 2022.
Although fertility as a whole is declining, it is still relatively high among women with low education and income. Age-specific fertility rate peaked between ages 20 and 29. A main policy focus here was to control TFR and subsequently, PGR would delay the age of first childbirth. Programs to do so seek to extend universal, free, compulsory education from seven to 11 years of the first 4 years of secondary education. This policy has led to limiting the age of the first childbirth for young women [11]. Early pregnancy remained common among school-going girls, contributing to a high drop-out rate, and widening gender disparities beginning in secondary education [32].
Social demography factors contributed to low teenage median age at first birth. The median age at first birth reflects the age at which half the women in a cohort have already had their first child. This median age was 19.8 years among females aged 25–49.
A further disaggregation of trends among young women under age 19 demonstrated high early fertility (Table 1) which affects the TFR, i.e., the average number of children a woman would have by the end of her childbearing years.
Age
%
15
4.4
16
11.4
17
23
18
38.2
19
56.7
Table 1.
Proportion of adolescents and young women who have started birth 2015–2016, Tanzania.
Source: TDHS, 2017.
There was a drastic rise in the proportion of women who had started childbearing by age 19. The Government undertook concerted efforts to increase the median age at first birth through measures such as extending compulsory education and economic empowerment to adolescent girls and young women (AGYW) [32, 33]. Increasing the median age at first birth would help reduce birth rates. Relevant policies included extending compulsory basic education from 7 to 11 years, addressing early, child-forced, and arranged marriages, strengthening knowledge and awareness on contraceptives and family planning use targeting adolescent and young women, and socioeconomic empowerment of adolescent and young women [23, 24, 34, 35]. However, despite these efforts, early childbearing remains largely unchanged: the percentages of women aged 15–19 who had begun childbearing was 26 percent in 2005–2005; it decreased to 23 percent in 2010; but increased again to 27 percent in 2015–2016 [12].
Increasing the spacing of births is another way to reduce TFR. This can be done by improving access to family planning and contraceptive use in the population. It is also contingent on other factors such as knowledge, attitude, and practices favorable to contraceptive use, and family planning; socio-cultural issues that influence the number of desired children, and other structural barriers such as location, socioeconomic status, and level of education [36, 37]. The median birth interval rate was 35 months or 2.9 years since the preceding birth. It increased modestly over the last decade with a median interval lengthening by 1.6 months between 2004 and 2005 and 2015–2016 as shown in Table 2.
TDHS Year
No. of Months
91–92
33.3
1996
33.7
1999
33.4
2005–2005
33.4
2010
33.9
2015–2016
35
Table 2.
Trends in birth interval (median number of months since preceding birth), Tanzania 1991–1992 to 2015–2016.
Improvements in social development have fostered modest gains in life expectancy [23, 24, 38, 39]. These gains were specifically driven by improvements in social service delivery especially in primary health services, basic education among girls, and provision of clean, portable drinking water. On the other hand, these gains were offset by slow progress in reducing age dependency rates, reducing inequalities, or raising incomes [40, 41, 42].
Poverty is also a key driver of recent demographic change [13]. Rural areas were the largest contributor to TFR, in part because of lower socioeconomic conditions, illiteracy levels, women’s equality, empowerment, and opportunities especially for AGYW [43, 44, 45, 46, 47, 48, 49, 50]. High fertility in rural communities also stems from low rates of contraceptive use, high preference for large progenies, or early marriage. Women in rural areas express preference for larger families because they need assistance with domestic work and childcare. Indeed, data show how adult women bear a heavy domestic workload (15+ years). In most cases (73.1 percent) adult women are responsible for fetching water [13, 22]. They are occasionally assisted by female children under 15 years (4.7 percent) or male children under 15 (2.8 percent) [13].
Longer distances from home to the water source in rural areas are among the factors of the increased demand for domestic labor, and hence the preference for high fertility. About 22.6 percent of households were located more than 1 kilometer from a water source; 6.5 percent between 2 and 5 kilometers; 1.3 percent between 5 and 8; and 0.8 greater than 8 kilometers [6]. High demand for domestic work was determined by the predominance of farm work in rural dwellings, and disproportionately less access to services such as water supply, electricity, and other energy sources. Rural women typically also keep small livestock within their homestead. Rural women want multiple children, including those late in their reproductive lives, because they expect children to assist in these domestic chores as they age [22]. It was also more difficult for rural women to access modern contraceptive and family planning services. Most (98.8) rural women know about modern contraception, but many who would like to use it lack access (53.2 percent).
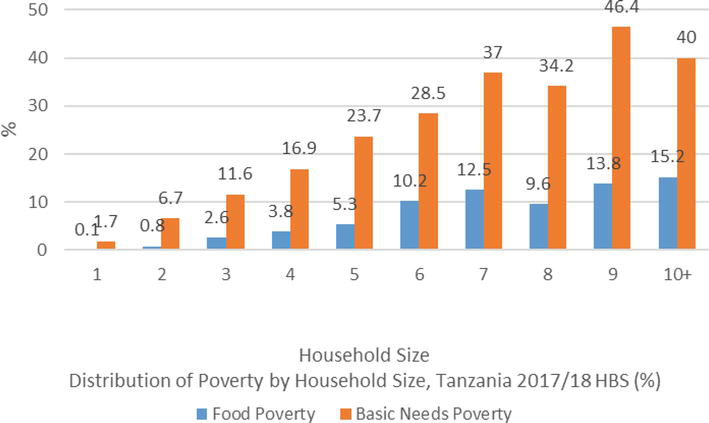
Poverty was a contributing factor to fertility and population growth [13, 22]. Multidimensional poverty among poor households served to transform them as drivers of recent demographic change. It can be seen from Figure 6 below there was a direct relationship between household size and poverty.
Figure 6.
Relationship between household size and poverty; source: TDHS, 2017.
Thus, a clear relationship exists between the poverty of households and their fertility. Poverty raises the demand for high fertility while lowering the knowledge and use of modern contraception. Literacy rates especially among women represent a barrier to fertility reduction among women from poor households [51]. Poverty is a driver of high fertility. In turn, high fertility exacerbates poverty.
Poverty can be measured in multiple ways. One is food poverty, the proportion of the total population whose food consumption per adult equivalent falls below the food poverty line [52]. A second is absolute poverty, the population below the poverty line. People who live in extreme poverty or sometimes referred to as abject, or absolute poverty. These represent the proportion of the population who cannot afford a single meal with sufficient nutrient levels usually denoted as calorific intake. Calorific intake is taken as a measurement because different foods generate different calories. A basket of foods yielding the minimum required calorific levels per adult equivalence is used to generate the food poverty line [53]. The poverty line depicting the minimum food basket for estimation of calorific intake was calculated from prevailing food prices. The extreme poor are defined as those whose consumption falls below the national food poverty line [14]. It consequently follows that extreme poverty is sensitive to the national price index. A rise in the food price index (i.e., a rise in food prices) would trigger a rise in the proportion of people in extreme poverty. The concept of adult equivalence is also relevant at this point. The required calorific intakes are higher for adults than children [14].
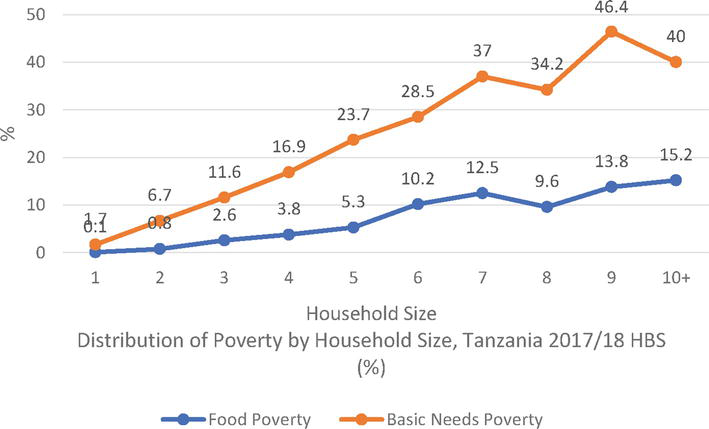
Figure 7 shows how demographic change in the form of rising population growth can affect household size, with implications on food and income poverty.
Figure 7.
Rising population growth affect on household size: Source: HBS, 2017–2018.
A third metric is basic needs poverty, or the proportion of the total population unable to meet basic needs which, according to the Human Development Index (HDI) include education, health, safe drinking water, shelter, and clothing [51, 52, 54, 55]. Other categories considered in this basket include utilities, transport, and communication. The poverty line based on basic needs is the cost for a basket of basic needs and is therefore sensitive to changes in prices.
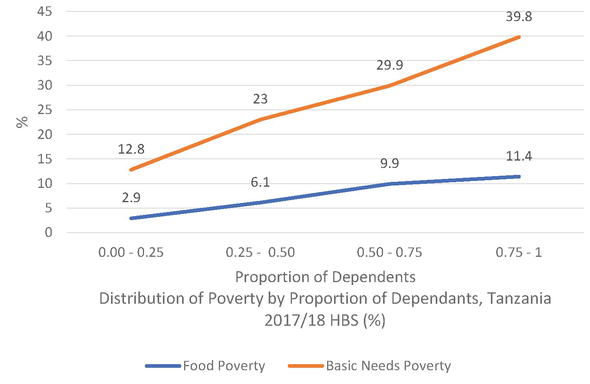
Social demography pays great attention to the relationship between quantitative and qualitative aspects of the total population. It is not enough to just analyze population growth rates and structure. One must also pay attention to how demography affects the distribution of welfare across the population [56]. How faster population growth affects inequality depends on rural-urban migration, economic growth, unemployment, health, and household structure. Figure 8 shows a direct relationship between household poverty and number of dependents.
Figure 8.
Relationship between household poverty and number of dependents.
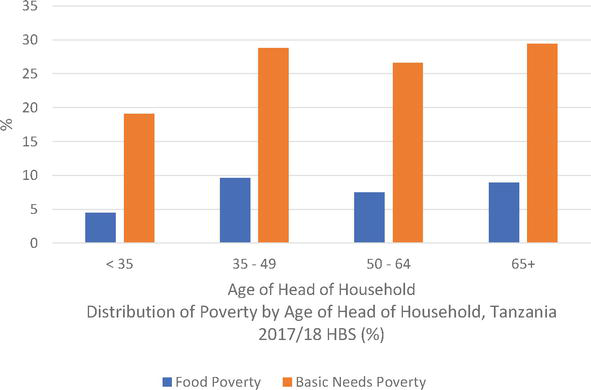
Several demographic factors fuel household dependency. These include life expectancy and high fertility. Poverty depends on the age structure of households. A household is less likely to be poor if it consists of household heads who are 35 years and younger as shown in Figure 9.
Figure 9.
Poverty and age structure of households.
Poverty and inequality are also key concepts in demographic analysis. Poverty is measured through headcount ratio, the number of people under a poverty line. Households are the primary unit in poverty analysis. It is noteworthy that poverty lines are determined by enumerating household incomes. However, household incomes are often based on expenditure records as proxies, even as they do not always reflect income. Households may spend income on luxuries and lack food and then they would still be considered poor. Households may also have income or assets but still be considered poor under the HDI. This is the case for pastoralists who own cattle but still fall short of meeting their minimum food intake [57].
Inequality, the other concept, reflects the even distribution of income within the population (6), [16]. It is measured by the Gini-coefficient where zero (0) denotes a situation of perfect equality where every person has the same consumption expenditure, and one (1) where there is total inequality where a few people hoard all the income [13, 49, 58].
The chapter explored the relationships between demographic and social demographic change in Tanzania. The country’s population has continued to grow, fueled by changes in fertility, mortality, and internal migration. These drivers themselves reflect trends in poverty, literacy, and infrastructure development. Poverty, especially, is a crucial factor. Partly because of the demand for domestic labor, rural women aspire to bear more children. This in turn reproduces rural poverty and high levels of unmet need for modern contraception. Overall, the relationship between family size and poverty works in both directions.
Although birth rates are lower in urban areas, rural-to-urban migration fuels a rapid growth of the urban population. Migrants are young and low-skilled, thus giving urban poverty a youthful face. Even though urban areas had the potential to spur economic transformation, low employment is an important brake. Much of the employment remains confined to the informal, low-pay, or illegal sectors, and this compromises the harnessing of a demographic dividend that is expected to follow impending falls in birth rates. The Government was making sensible choices in social policy including expanding education, primary health care, HIV prevention, and provision of antiretrovirals. However, high population growth continues to offset the gains expected from these policy investments. Social demography offers a cogent framework to explore the broad socioeconomic consequences associated with recent demographic changes in Tanzania.
References
1.Mahmud A. Differentiation between Formal Demography and Population Studies: A Discussion on the Nature, Scope and Importance of Social Demography. Kumargaon: Shahjalal University of Science and Technology; 2020
2.Caldwell JC. Demography and social science. Population Studies Journal. 1996;50(3):305-333
3.Gerandielle WK. What Is the Difference between Demography and Population Studies. New Delhi: PEDDIA; 2022
4.Muller AS, Abrutyn S, Pescosolido B, Diefendorf S. The social roots of suicide: Theorizing how the external social world matters to suicide and suicide prevention. Frontiers in Psychology Journal. 2021;12:621569. DOI: 10.3389/fpsyg.2021.621569
5.Klimczuk A. Introductory to Demographic Analysis: Selected Concepts, Tools, and Applications. London, UK, London: IntechOpen; 2021
6.United Republic of Tanzania [URT], Ministry of Finance and Planning [MoFP], National Bureau of Statistics [NBS] Tanzania Mainland, and President’s Office-Finance and Planning [PO-FP], Office of the Chief Government Statistician [OCGS], Zanzibar. 2022 Population and Housing Census: Administrative Units Population Distribution Report: Tanzania. Dodoma: URT, MoFP, NBS, PO-FP, OCGS; 2022
7.Oxford Reference Dictionary of Sociology, Overview: Social Demography [Internet]. 2011. Available from: https://www.oxfordreference.com/display/10.1093/oi/authority.20110803100515871jsessionid=DEFF904240B5884A9B8635D7D6442F49
8.Tabutin D. Whither demography? Strengths and weaknesses of the discipline over fifty years of change. Population Journal. 2007;62(1) INED:15-31
9.Crimmins EM. Demography: The past 30 years, the present, and the future. Demography Journal. 1993;30(4):579-591
10.Foote KA, Hill KH, Martin LG. Demographic Change in Sub-Saharan Africa: Population Dynamics of Sub-Saharan Africa. Michigan: ProQuest Ebook Central; 1993
11.Wizara ya Fedha na Mipango, Ofisi ya Taifa ya Takwimu–Tanzania na Ofisi ya Rais-Fedha na Mipango, Ofisi ya Mtakwimu Mkuu wa Serikali Zanzibar. Sensa ya Watu na Makazi ya Mwaka 2022: Matokeo ya Mwanzo. Dodoma, Tanzania: Wizara ya Fedha na Mipango, Ofisi ya Taifa ya Takwimu–Tanzania na Ofisi ya Rais-Fedha na Mipango, Ofisi ya Mtakwimu Mkuu wa Serikali Zanzibar; 2022
12.Ministry of Health [MoH], National Bureau of Statistics (NBS) Tanzania Mainland, Ministry of Health [MoH], Office of the Chief Government Statistician [OCGS] Zanzibar, and ICF. Tanzania Demographic and Health Survey and Malaria Indicator Survey 2022: Key Indicators Report. Dodoma, and Rockville: MoH, OCGS, NBS; 2023
13.Ministry of Finance and Planning-Poverty Eradication Division [MoFP-PED], National Bureau of Statistics [NBS] Tanzania Mainland, and World Bank. Tanzania Mainland Household Budget Survey 2017/18. Final Report: MoFP-PED, NBS and World Bank. Dodoma and Washington DC: MoFP-PED, NBS; 2020
14.Agwanda A, Amani H. Population Growth, Structure, Momentum in. Tanzania: ESRF; 2014 ISBN: 978-9987-610-96-9
15.Bumpass LL, Taeuber KE, Sweet JA. Studies in Population Social Demography. Massachusetts: Academic Press; 1978
16.Suharto S. Complementary Sources of Demographic and Social Statistics. New York: Department of Economic and Social Affairs, United Nations Secretariat; 2001
17.Meshack L. Social Cultural Factors Influencing Fertility of at Least Three Children among Women in Arusha District Council [thesis]. Tanzania: Mzumbe University; 2015
18.Ofisi ya Waziri Mkuu wa Jamhuri ya Muungano wa Tanzania na Ofisi ya Makamu wa Pili wa Rais, Zanzibar. Sensa ya Watu na Makazi ya Mwaka 2022: Mwongozo wa Kitaifa wa Matumizi ya Matokeo ya Sensa. Dodoma: Ofisi ya Waziri Mkuu wa Jamhuri ya Muungano wa Tanzania na Ofisi ya Makamu wa Pili wa Rais, Zanzibar; 2022
19.Ministry of Planning, Economy and Empowerment [MoPEE], National Bureau of Statistics [NBS]. Tanzania Census 2002 Analytical Report. Vol. X. Dar-es-Salaam: MoPEE, NBS; 2006
20.United Republic of Tanzania [URT]. Questionnaire for the 2022 Population and Housing Census. Dodoma: NBS; 2022
21.President’s Office, Planning Commission [PO–PC]. 1988 Population Census Methodology. Dar-es-Salaam: PO-PC; 1988
22.Mainland, Ministry of Health (MoH) [Zanzibar], National Bureau of Statistics (NBS), Office of the Chief Government Statistician (OCGS), CIF. Tanzania Demographic Health and Malaria Indicator Survey 2022 Key Indicators Report. Rockville Maryland: MoH, NBS, OCGS; 2023
23.Ministry of Finance and Planning (MoFP) [Tanzania Mainland], President’s Office Finance and Planning [Zanzibar], National Bureau of Statistics (NBS), Office of the Chief Government Statistician (OCGS). 2022 Census Preliminary Results: Dodoma. Dodoma: MoFP, NBS, OCGS; 2022 Available from: https://www.nbs.go.tz/nbs/takwimu/Census2022/matokeomwanzooktoba2022.pdf
24.Economic and Social Research Foundation [ESRF]. Tanzania Human Development Report 2017: Social Policy in the Context of Economic Transformation. Dar-es-Salaam: ESRF; 2018
25.Boucher FC. What is Doubling Time and How it is Calculated? [Internet]. 2015. Available from: https://populationeducation.org/what-doubling-time-and-how-it-calculated/
26.National Bureau of Statistics [NBS] Ministry of Finance and Planning, Office of the Chief Government Statistician (OCGS) President’s Office Finance, Economy and Planning Zanzibar. Migration and Urbanisation Monograph: NBS and OCGS. NBS, OCGS; 2015
27.Awinia C. Structural Barriers, Constraints and Urban Youth Employment: The Case of Ilala Municipality. Dar-es-Salaam: Mkuki wa Nyota Publishers; 2014
28.Awinia CS. Poor structural quality of housing conditions as a reflection of underlying urban poverty and inequalities: The case of Mnyamani and Kisiwani settlements in Dar-es-salaam. Journal of Building and Land Development; Dar-es-Salaam. 2021;22(1):1-15 ISSN: 0856-0501
29.National Bureau of Statistics [NBS]. Women and Men in Tanzania: Facts and Figures 2017. Dar-es-Salaam: NBS; 2017 Available from: https://www.nbs.go.tz/nbs/takwimu/WomenAndMen/women_and_men_booklet.pdf
30.National Bureau of Statistics [NBS] Ministry of Finance and Planning, Office of the Chief Government Statistician (OCGS) President’s Office Finance, Economy and Planning Zanzibar. 2012 Population and Housing Census Vol. IV Fertility and Nuptiality. NBS and OCGS; 2015
31.Ministry of Health, Community Development, Gender, Elderly and Children [MoHCDGEC], National Bureau of Statistics [NBS] Tanzania Mainland, Ministry of Health [MoH], Office of the Chief Government Statistician [OCGS], and CIF. Tanzania Demographic Health and Malaria Indicator Survey (TDHS-MIS). Rockville Maryland: MoHCDGEC, NBS, OCGS, MoH; 2016. pp 85-183
32.Awinia C. Free basic education and gender disparities in Tanzania: An empirical assessment of challenges and policy options: Huria Journal of the Open University of Tanzania Vo. 26. No. 2: 2019 ISSN: 0856-6739, Available from: https://www.ajol.info/index.php/huria/article/view/198490
33.Kikula I, Kipokola J, Shivji I, Semboja J, Tarimo B, editors. Researching Poverty in Tanzania: Problems, Policies and Perspectives. Mkuki wa Nyota Publishers; 2005
34.Bernardi L, Hutter I. The anthropological demography of Europe. Demographic Research Journal. 2007;17:18, 541-566. DOI: 10.4054/DemRes.2007.17.18
35.Exavery A, Shamte A, Bietsch K, Mosha D, Mbaruku G, Masanja H. Levels and correlates of non-adherence to WHO recommended inter-birth intervals in Rufiji, Tanzania. BMC Pregnancy Childbirth Journal. 2012. DOI: 10.1186/1471-2393-12-152
36.Amaral EFL. Theories of demography. Population and Society Journal. 2022
37.Sanga LA, Mtuy T, Philemon RN, Mahande MJ. Inter-pregnancy interval and associated adverse maternal outcomes among women who delivered at Kilimanjaro Christian medical Centre in Tanzania, 2000-2015. PLoS One. San Francisco. 2020;15(2):e0228330
38.United Republic of Tanzania. The Constitution of the United Republic of Tanzania of 1977 Chapter 2 of the Laws. United Republic of Tanzania; Dar-es-Salaam. 2005 Available from: https://www.parliament.go.tz/uploads/documents/publications/en/1475140028-The%20Constitution.pdf
39.Narayan D, Pritchett L, Kapoor S. Moving out of Poverty: Success from Bottom-Up. Vol. 2. London: Palgrave Macmillan; 2009
40.Sen A. Development as Freedom. Oxford: Oxford University Press; 1999
41.World Bank. Poverty Assessment in Tanzania. World Bank; 2018
42.UNDP. Overcoming Human Poverty. New York: Oxford University Press, UNDP; 1998
43.Fafchamps M. Rural Poverty, Risk and Development. Edward Elgar Publishing Limited; 2003. pp 146-188
44.Awinia CS. The sociology of intra-Africa pastoralist migration: The case of Tanzania: Migration and society section. Journal of Frontiers Sociology. 2020;5
45.Awinia CS. Loss of ecological control, pastoralist migration and indigenous. Tanzania Journal of Population and Development. forthcoming ISSN: 0856-0227
46.Cyril S, Oldroyd JC, Renzaho A. Urbanisation, Urbanicity, and health: A systematic review of the reliability and validity of Urbanicity scales. BMC Public Health Journal. New York. 2013;13:513
47.Ushakov D. Migration and Urbanisation: Local Solutions for Global Economic. Pennsylvania: IGI Global; 2019
48.National Bureau of Statistics (NBS), World Bank. Tanzania’s Productive Social Safety Net: Findings from the Impact Evaluation Baseline Survey: Dar-es-Salaam, 2016. Washington D.C: NBS, World Bank; 2020
49.Fields GS. Poverty, Inequality and Development. Cambridge: Cambridge University Press; 1980
50.Aho G, Lariviere S, Martin F. Poverty Analysis Manual: With Application in Benin. Quebec City: Universite Laval; 1998
51.Kane S, Kirby M. Wealth, Poverty and Welfare. London: Palgrave Macmillan; 2003
52.National Bureau of Statistics and Oxford Policy Management Ltd. Developing a Poverty Baseline in Dar-es-Salaam: Tanzania. Printpak (Tanzania) Ltd; 2000
53.Bagachwa MSD, editor. Poverty Alleviation in Tanzania: Recent Research Issues. Dar-es-Salaam: Dar-es-Salaam University Press; 1994
54.Challenges. In: 2020 Lines T. Making Poverty a History. Pennsylvania: Zed Books Ltd: IGI Global; 2008
55.Repinki G, Stahl H. Poverty and Poverty Reduction Strategies in the East-African Community (EAC). Arusha: GTZ; 2005
56.Kotler P, Lee NR. Up and out of Poverty: The Social Marketing Solution Toolkit for Policy Makers. Philadelphia: Wharton School Publishing; 2009
57.Sachs JD. The End of Poverty: How we Can Make it Happen in our Life Time. Penguin Books; 2005
58.Taylor M. Christianity, Poverty and Wealth: The Findings of Project 21. Geneva: WCC Publications;
Notes
The estimation was arrived by following formula [21].
Let Xcb be the number of persons in category c of a variable in sex-age group b in the rural/urban part of a district. An estimate X̂cb of Xcb was computed by the following formula:
X̂cb=Mm∑i=1mxcibE1
Where;
Xcib: Number of persons in category c of a variable in sex-age group b in the i̇th sample EA in the rural/urban part of a district
M: Number of EAs in the rural/urban part of the district
m: Number of sample EAs in the rural/urban part of the district
Estimates at a regional level were derived by summing up district estimates over all districts within the region. National level estimates were the sum of regional estimates. The linear estimates thus obtained were adjusted by using ratio estimation in order to result in the same age and sex composition as the results on a complete basis.
Let denote the population in sex-age group b derived on a complete basis by Xb, and the estimate of number of persons in sex-age group b obtained on the basis of data from long questionnaires by X̂b. The estimate X̂b may not coincide with Xb. The final estimate for Xcb was derived by multiplying the ratio of Xb to b X̂b into the linear estimate X̂cb
Census data based on the long questionnaire is subject to sampling errors. Sampling errors of estimates for selected variables were estimated. For the sake of simplification
VX̂=M21−f1mm−1∑i=1mxi−x¯2E2
Where;
VX̂: Variance of the estimate X̂
xi: Value of the variable X in the ith sample EA, e.g., the number of literate persons in the ith sample EA
x¯: Mean of xi within the district, i.e., an average of xi for m sample EAs in that district
f: Sampling fraction, i.e., m/M
M: Number of EAs in the rural/urban part of the district
Variance of the estimate at a regional level was calculated for rural and urban parts separately as the sum of district level variances within the region, and variance of the national estimate was the sum of regional level variances. Variance for the total of rural and urban areas was the sum of variances for rural and urban parts.
The standard error is the standard deviation of the estimates, namely the square root of variance and the relative standard error is the coefficient of variation (C.V.) of the estimate, i.e., the ratio of standard error to the estimate as expressed in percentage. Standard errors and the coefficients of variation for selected items are at a national level.
The sampling error of the estimate was considered approximately twice the standard error. Estimates at regional level were derived by summing-up district estimates from all districts within the Region. National level estimates were the sum of regional estimates. Linear estimates that were obtained were adjusted by using ratio estimation in order to result in the same age and sex composition as the result on a complete basis [6, 21].
Written By
Christopher S. Awinia
Submitted: 12 February 2023Reviewed: 24 May 2023Published: 24 April 2024