
Abstract
Aging is one of the great challenges in modern societies after their demographic transition. Changes in population age structure affect socioeconomic organization and force a reconsideration of social structures consolidated under a pyramidal age composition, which is slowly vanishing. To study the impact of aging, National Transfer Accounts (NTA) and its natural extension, National Time Transfer Accounts (NTTA), are valuable data sources. They provide national cross-section age profiles of the main economic (market and nonmarket) variables, informing about how resources are produced, shared, and consumed by individuals of different ages co-living at the same moment. This chapter presents selected applications of NTA data to show its potential to study the generational economy, including both the demographic dividend—how aging affects economic growth—and the effects of aging on the welfare system. Overall, the NTA has proved to be a precious data source to enrich the analysis of the effects of aging on our societies.
Keywords
- aging
- demographic dividend
- generational economy
- intergenerational transfers
- national transfer accounts
- welfare state
1. Introduction
The change in population age composition is a rising challenges in contemporary societies. Over the past century, steady declines in mortality, followed by a decline in birth rates, have caused most countries to transition toward societies with a much greater percentage of elderly. According to United Nations projections (see [1]), in 2050, one in every six people in the world will be over 65 years of age, and the proportion will rise to one in four by 2100, compared to one in 11 in 2019. Europe, and particularly South European countries, are among the most affected by this change in population age structure. In 2019, one in five Europeans was over 65 years old, and it is expected to be one in four in 2050, and one in three by 2100.
The change in the population age structure implies the need to adapt social structures and institutions that exist today but are only consistent with a pyramidal age composition. To understand this, it is useful to think carefully about how the human lifecycle is organized, from an economic perspective. It can be divided into three broad periods, the exact limits of which can be discussed. In the first stage, which can generally be referred to as “childhood”, individuals need to consume, but they do not have the ability to generate the necessary resources to finance it. Then, during the so-called “active age”, individuals have the capacity to generate income and resources and, obviously, they continue to consume. Finally, during the “retirement” age, people again lose the ability to produce, while they continue to need resources to finance their consumption. In short, people do need to consume throughout our lives but only have the ability to directly finance such consumption while they are able to work. That is, there is a “deficit” during childhood and retirement, and a possible “surplus” during the working age. Hence, societies need mechanisms that allow the intertemporal redistribution of income from the working age to the other two lifecycle periods. There are three basic mechanisms of resource allocation. First, individuals can reallocate income intertemporally through markets: we can save during our working years and use these savings when we retire. The parallel reasoning does not work for children, though, as they (or their parents) might not have the ability to take out a loan at birth to be repaid during their working life. Thus, the main mechanism of intertemporal reallocation is not the market, either for children or for the elderly, but two other institutions: the family and the state, respectively. However, the intervention of families and the public sector implies that the redistribution of resources is not necessarily intertemporal (between different moments in the lifecycle of the same person) but intergenerational (between different age groups).
The role of markets, families, and the public sector in the intertemporal and intergenerational redistribution of resources changed radically over the past century in advanced countries, mainly due to two trends. On the one hand, economic development led to an extension of marketization. This process is closely related to the abovementioned demographic transition. In traditional societies, the family looked after the economic needs of all its members, redistributing resources from working adults to children and the elderly through the so-called intergenerational pact. On the other hand, in addition to the growing development of the capital market, the so-called welfare state was set up and became consolidated, through which the public sector comes into play as a redistributor of resources. Like families, the public sector focuses on redistribution between different generations by implementing social spending programs mainly aimed at economically dependent age groups but financed with taxes and contributions from working individuals.
In this chapter, we aim to analyze how National Transfer Accounts (NTA) estimates contribute to analyzing and understanding what has been called the generational economy: how individuals of different ages, co-living at the same moment in a given society, interact to produce, share, and consume resources. The next section is devoted to shortly describing the methodology, while Section 3 presents its natural extension, the National Time Transfer Accounts (NTTA), to incorporate nonmarket activities and obtain the full picture of resource production and consumption in society. Section 4 presents selected recent applications of NTA in order to show its potential to analyze the role of the generational economy and consequently to offer a broader view of the effects of aging on welfare. Final remarks are presented in Section 5.
2. National transfer accounts
National Transfer Accounts (NTA) is a methodology designed to provide an accounting framework of economic flows to and from the residents of a country, classified by age, in a given year. As such, they give information about the economic lifecycle and age reallocations, offering a cross-sectional picture of the intergenerational transfers within an economy. The aggregate values of NTA are consistent with those in National Accounts (NA), but they provide additional information, such as showing how resources in a given year are allocated across ages. The construction of NTA was initiated at the start of this century as part of a collaborative international network, and the first results for 23 countries were published in 2011 in [2]. Nowadays, the NTA project involves more than 90 countries around the world, and its corresponding methodological manual has been published by the United Nations Population Division [3].
The idea behind NTA methodology is easy to understand: individuals need to consume across their whole lifecycle, but they can only produce resources to finance that consumption during a limited period (typically, the working age). This means that a system for transferring resources across ages is needed. NTA disentangles how resources move between different age groups by means of family transfers, government intervention, and capital markets. The starting point is the transformation of the NA identity for a given year as:
which implies that total income resources must equal total income uses. The left-hand side includes the resources, where YL is labor income, YA asset income, and TG+ and TF+ represent public and private transfers received by individuals. The right-hand side collects, in turn, income uses: C is consumption, S stands for savings, and TG− and TF− are transfers from individuals to the public sector—and to other individuals—respectively. Private transfers, mainly made by the family, are not measured in NA. In fact, NTA is the first standardized attempt to measure them in a comprehensive way. Rearranging this equation, the following expression is obtained:
In NTA methodology, the difference between consumption and labor income is known as the lifecycle deficit (LCD) which, in fact, can be positive (a deficit) or negative (a surplus, that is, consumption is lower than labor income). This difference between consumption and labor income has to be financed with reallocations through the three ways illustrated on the right-hand side of Eq. (2): asset-based reallocations (ABR)—measured as the difference between asset income and savings (YA-S), net public transfers (TG) or net family transfers (TF)—in both cases calculated as the difference between inflows (+) and outflows (−), that is:
It should be stressed that Eq. (3) holds both for the whole economy and for each specific age group for which NTA is obtained. During nonproductive ages (essentially childhood and retirement), the LCD is expected to be positive (a deficit), while during most of the working age, it should be negative (a surplus). When positive, the LCD needs to be financed via the three mechanisms on the right-hand side of Eq. (3). For example, children would be expected to finance their LCD primarily via family transfers (TF) and public transfers (TG), such as education and health services, ABR being almost nonexistent.
In the case of the elderly, they receive, especially in developed countries, a high amount of TG (mainly pensions and health) and probably use ABR (dissaving, asset income), while TF would be limited, even negative (transfers from the old to younger family members), if the other two mechanisms are sufficiently developed. When the LCD is negative, labor income is higher than consumption, so individuals can save, although they typically pay more in taxes than they receive in public transfers. Eq. (3) highlights an interesting characteristic of the so-called generational economy: the standard of living of the society is heavily dependent on the success of the working-age population in generating sufficient resources to finance the LCD of the two economically dependent age groups (children and the elderly). This means that the population age structure is a critical factor in the analysis.
For illustration purposes, Figure 1 shows NTA estimations for six selected countries. In particular, it shows the per capita age profiles of consumption (C) and labor income (YL) as stated in the left-hand side of the previous Eq. (2), as well as the LCD (the difference between them). All the profiles are estimated in terms of the average per capita labor income for ages 30–49, the standard normalization method employed in NTA in order to ease international comparisons. Figure 1 allows verification of the expected inverted U-shape of labor income during working ages, with small differences between countries in the age pattern, the age of maximum wage, and also at the exit ages of the labor market. As for consumption, the pattern is also similar across countries, presenting some divergences for old ages, when some countries present an increase in per capita consumption (the United States, the United Kingdom from age 50; France and Sweden from age 75), while it remains quite stable in others (Spain and China).
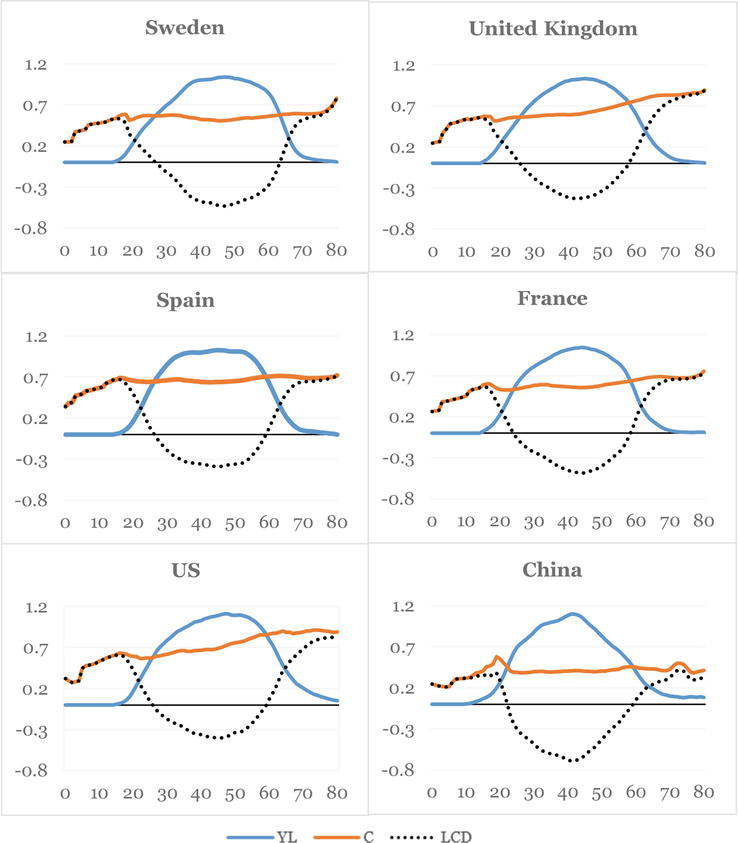
Figure 1.
Per capita age profiles of consumption (C), labor income (YL), and lifecycle deficit (LCD) in selected countries (in terms of the national average labor income for ages 30–49). Source: Authors’ elaboration with data extracted from AGENTA project (
NTA estimates require complex estimation procedures that combine NA aggregates, household surveys, and other external sources. NA aggregates need to be reclassified in the relevant categories shown in previous equations, subject to the availability of microdata, allowing variables to be imputed by age. Micro data come from household surveys including data on consumption and/or income, taxes, and transfers. External information on transfers and public consumption is employed to improve or complement the information given by household surveys. This procedure is standardized in order to make estimates comparable, while it is conditional on the data existing in each country. In some cases, it has been possible to obtain estimates using harmonized international surveys. In the case of Europe, several projects have obtained (AGENTA, WELTRANSIM) or are obtaining (WELLCARE, SUSTAINWELL) estimates combining the European Union Statistics on Income and Living Conditions (EU-SILC) and the Household Budget Survey (HBS) and other harmonized surveys for European countries.1
3. Incorporating nonmarket activities: the national time transfer accounts
It is well-known that the macroeconomic aggregates do not consider those activities that are not exchanged through the market. Neither does traditional NTA, as it is consistent with NA. However, human well-being rely, in large part, on these kinds of activities, such as housework and care for/by other family members, to cite two of the most remarkable. For that reason, a thorough analysis of the generational economy requires the consideration of all kinds of production and consumption activities and how resources are shared by the individuals living at the same moment. Moreover, incorporating nonmarket activities is a necessary condition for a proper analysis of the generational economy from a gender perspective as, typically, women are more specialized in nonmarket activities, while men are more specialized in market production.
The so-called National Time Transfers Accounts (NTTA) is the natural extension of NTA to measure and value the resources produced, consumed, and shared in society aside from the markets (see [4] for an excellent review of the method). NTTA uses the information collected in time-use surveys to estimate age profiles of production and consumption of nonmarket activities, typically differentiating housework and care. Unlike market production, home production cannot be saved. Hence, consumption must equal production at a given moment of time, in aggregate terms. Differences arise at each age group, leading to transfers. The real interest in measuring nonmarket activities lies in knowing the total production in a society, and how it is shared by the different community members. Once the age profiles (in this case, production, consumption, and transfers) have been estimated in terms of time, in a second step, they need to be monetized and finally aggregated to the standard NTA in order to capture the whole picture of the generational economy.
Counting Women’s’ Work project (CWW) summarizes estimations of NTTA in different countries around the world, allowing for interesting comparisons. For example, in India, total nonmarket production is estimated as 45% of the national GDP, while only 21% in Turkey (Figure 2). Nonmarket activities are also important in developed countries, such as United States (31%) and Spain (24%).
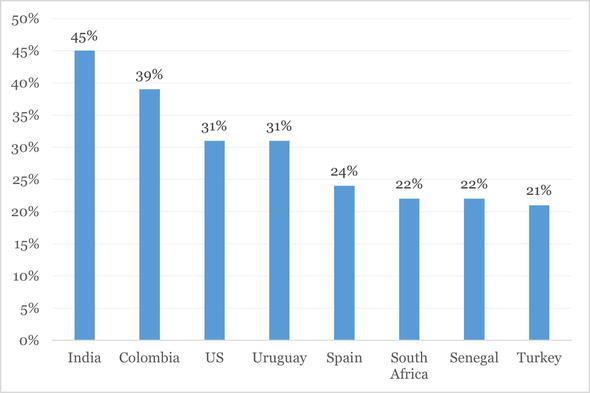
Figure 2.
Estimation of the contribution of nonmarket economy to GDP in different countries. Source: Authors’ elaboration with data from CWW, based on NTTA estimates for each country (
Regarding the distribution by gender, NTTA estimations confirm that women perform the majority of nonmarket activities around the world, while market production is led by men (Figure 3). Developed countries show higher participation of men in nonmarket activities, although still far from an equal share.
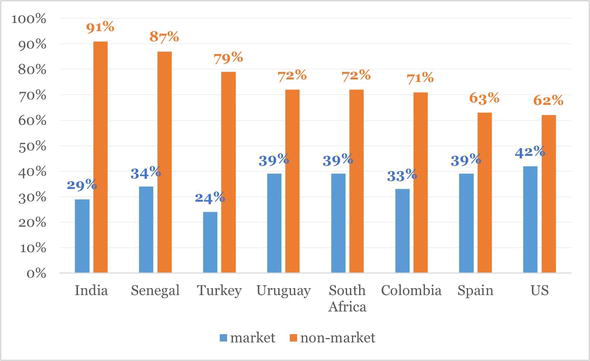
Figure 3.
Estimation of women’s contribution to market and nonmarket production in different countries. Source: Authors’ elaboration with data from CWW, based on NTTA estimates for each country (
Figure 4 details the age profiles of time devoted by men and women to nonmarket activities in four European countries, estimated in AGENTA project using harmonized time use surveys collected in HETUS 2000.2 We have selected four countries, representative of the four well-known welfare state models: Sweden for the Nordic system; United Kingdom for the Anglo-Saxon; France for the Conservative, and Spain for the Mediterranean.3 In all four countries, the gender gap in time devoted to household production is remarkable, but interesting features can be identified. Sweden shows the lowest difference in total time devoted to home production between men and women, while Spain presents the highest, with the UK and France somewhere in between. This gender difference is higher during working ages, and particularly coinciding with early parenthood ages, while it tends to decrease later and follow a different path: after age 50 in Sweden, 60 in France and Austria, and 65 in Spain, although it remains clearly higher in this last country. Gender differences for working ages are likely related to female participation in the labor market (the highest in Sweden, the lowest in Spain), which in turn is linked to the welfare state organization. Nordic welfare state is based on policies promoting female employment, while Mediterranean countries had much weaker family policies by the beginning of the 21st century (the period of the data employed in the estimations). Figure 4 also shows that, from age 50–55, when childrearing practically disappears, housework production increases for both men and women and it starts to decrease again at very old ages (70–75+). It is worth mentioning that time devoted to home production by women is always the highest in Spain, while exactly the opposite happens for men (the lowest at any age in this country).
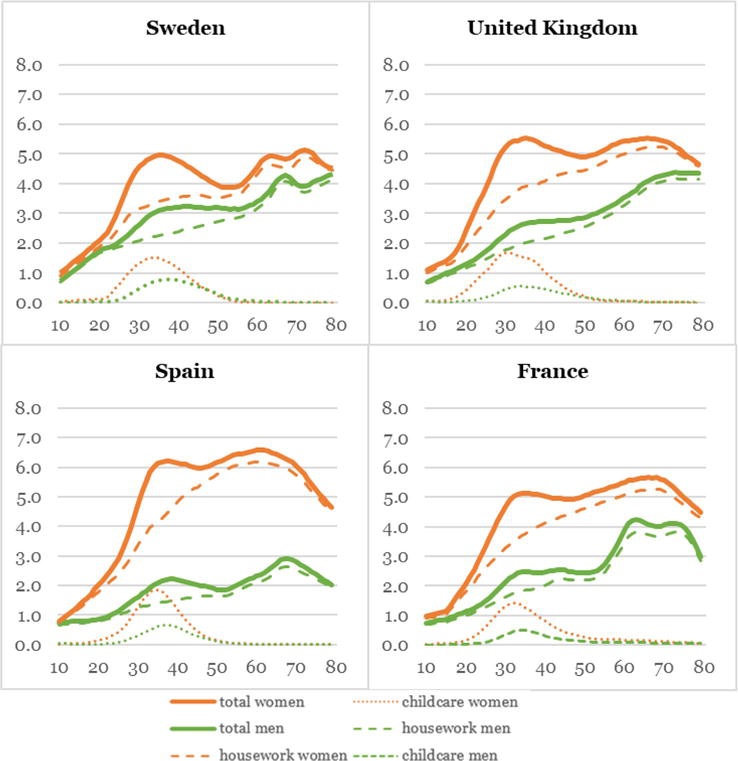
Figure 4.
Per capita age profiles of time devoted to nonmarket activities by gender in four European countries (in hours per day). Note: Total profiles of nonmarket activities collect childcare, housework, and interhousehold production (nonmarket services provided to outside the own household). Source: Authors’ elaboration with data from AGENTA project, available at:
Several studies using more recent data show some convergence of the gender profiles, although a gender gap still remains in the majority of countries. For example, in [7], the 2010 wave of the Spanish Time Use Survey is employed use the 2010 wave of the Spanish national TUS to obtain closer age profiles for men and women than those estimated previously in AGENTA, although the gender gap is still high compared to other countries.
The difference between nonmarket production and consumption is called nonmarket LCD, symmetrically to the LCD obtained from the traditional NTA. Figure 5 shows the age profiles of monetized nonmarket LCD in the same four countries shown above, again differentiated by gender. For ages 0–10, the LCD matches consumption, as there is no production. The first remarkable feature is the difference in the level of profiles, caused by the monetization method: as wages are much lower in Spain than the other countries considered, although Spanish women dedicate more hours to home production, the total value of their outcome is significantly lower. Therefore, in central working ages, the nonmarket surplus for Spanish women is the lowest, and it barely exists for men. Second, it is clearly observed that the surplus period for men is much shorter, and it coincides with the childrearing period. After age 45–50, it becomes a deficit for the rest of their lifecycle, while women start with their surplus at younger ages (20–25), and it remains for the rest of their lives (only in Sweden does it finish at very old ages).
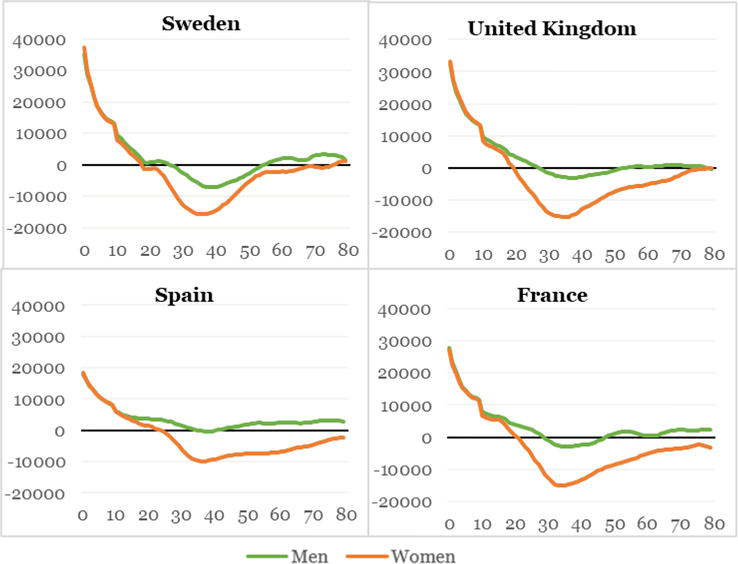
Figure 5.
Per capita age profiles of nonmarket lifecycle deficit by gender in four European countries (in € per year). Source: Authors’ elaboration with data from AGENTA project (available at:
Traditional NTA disaggregated by gender typically shows a less favorable lifecycle deficit profile for women, especially during working ages, reflecting both their lower participation and the gender wage gap in the labor market. Incorporating NTTA into traditional NTA would help to properly understand how society is actually organized as regards production, consumption, and sharing of resources. Some studies combining NTTA with NTA profiles include [8] for Germany, [9] for Italy, [10] for Hungary (although in this case results are not disaggregated by gender), and more recently [11] for 15 European countries. For illustration purposes, Figure 6 shows the estimations of market and total LCD for Spain in 2010, using AGENTA data for NTA and results in [7] for NTTA. As expected, the differences in lifecycle deficit between men and women shrink when monetized NTTA profiles are aggregated to the traditional NTA (solid lines). It is worth mentioning that, as previously obtained in [7], Spanish women spend more time working than men at any age, although they participate less in the labor market. However, as the monetary value assigned to domestic production is low, women present a lower total surplus over working ages.4 From age 65, however, as labor income disappears and only market production remains, the total deficit becomes higher for men.
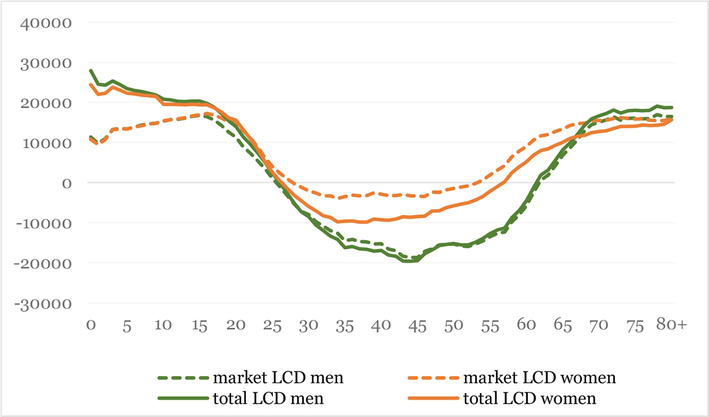
Figure 6.
Per capita age profiles of market and total lifecycle deficit (LCD) in Spain (2010) (in € per year). Source: Authors’ elaboration with data from [
4. Some applications of NTA data
4.1 The effects of the demographic transition on economic development: measuring the demographic dividend
In this section, we include applications related to the use of NTA data to evaluate the impact of the demographic transition on economic development. That process started in Western countries, which are already experiencing the aging process, followed by middle and low-income countries.5 After several attempts to analyze the interplay between demographics and economic growth, population age structure was explicitly introduced in the analysis by Bloom and Williamson [13]. They coined the term “demographic gift” to refer to the positive effect on economic development in the early stages of the demographic transition, when the working-age population relatively increases with respect to those on the extremes of the lifecycle (children and the elderly). The term was later renamed the demographic dividend (see [14]), defined as the growth rate of the support ratio (working age divided by total population). All countries, through the demographic transition to aging societies, have (had) a demographic dividend period (understood as positive growth of their support ratio).
In the analysis of the demographic dividend, NTA becomes a valuable source of data, as it allows demographic indicators to be enriched with economic content. In particular, NTA is used to transform the pure demographic support ratio into an economic support ratio, computed by dividing the number of effective producers (instead of the working-age population) by the number of effective consumers (instead of the total population). Effective producers are computed by multiplying the working population by the per capita age profile of labor income, while effective consumers are the product of the total population and the per capita age profile of consumption. Among the papers using NTA in the analysis of the demographic dividend, it is worth mentioning the seminal one by Mason ([15]), followed by others such as [16, 17, 18]. Estimations show that most high-income countries have already finished their demographic dividend period and are right now in a postdividend stage (see [18]), with decreasing economic support ratios. In particular, this is the case of European countries, as shown in Figure 7, reproduced from [19].
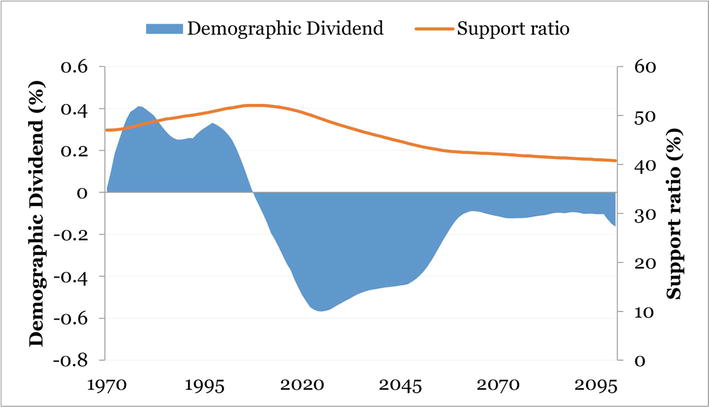
Figure 7.
Support ratio and demographic dividend in Europe, 1970–2100. Source: Reproduced from [
In Ref. [20], Mason and Lee took a step forward by introducing a possible second demographic dividend, which would follow the first under certain circumstances. The idea behind the second demographic dividend is simple: in aging societies, as people live longer, they have incentives to save more and accumulate assets during their working ages. This would eventually lead to an economy more capital intensive and possibly to higher productivity. However, this second demographic dividend is not automatic, and it will highly depend on agents’ behavior and public policies (for instance, individuals may not incentivized to save for their old age if they trust in the government and/or their families to care about them). Again, NTA is a precious source of data for estimations of the second demographic dividend (see [18] for the most recent results in this line).
An additional element to consider is the fact that the demographic transition has coincided in time with another relevant event affecting population composition: the education expansion. Indeed, the population has not only changed in terms of age structure but also in its level of education, as the educational attainment of the younger generations has been growing steadily (although not homogenously) around the world. Although some research has been devoted to analyzing the role of education in economic development (see [21] for a review), only a few studies have considered the change both in age structure and in level of education. Again, the information provided by NTA is especially valuable for this kind of analysis if the age profiles are differentiated by educational attainment. In Ref. [22], authors used NTA disaggregated by level of education in Spain and Mexico, two countries with different path in the demographic transition, to disentangle the age and education effects on the demographic dividend. They performed a simulation exercise using the population projections by level of education in [23]. Their results (Figure 8) show that the education effect has always been higher than the age effect in the demographic dividend. Moreover, it could continue to be positive (although decreasing) throughout the twenty-first century, while the age effect became negative for Spain before 2020 (a little later in Mexico). In Spain, the effects of the sharp demographic transition caused by the baby boom (from 1957 to 1977) and the subsequent baby bust are clearly visible, leading to a strong decrease in the age effect from 2015 to 2040 (coinciding with the retirement of those numerous generations).
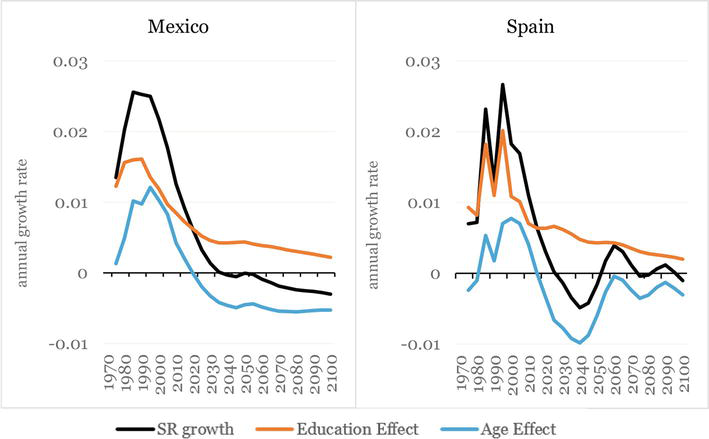
Figure 8.
Age and education effects on the demographic dividend in Mexico and Spain (1970–2100). Source: Reproduced from [
In Ref. [22], the authors employ a mechanical projection method combining NTA profiles and other economic information with population projections. There are a variety of projection strategies that allow the different dimensions of the complex interaction among economics and demographics to be captured to a different extent. In a later work [24], an Overlapping Generations (OLG) model is used, calibrated with NTA data, individuals being heterogeneous according to their level of education, to isolate age and education effects in the demographic dividend in Spain historically (1850–2000). In this case, the OLG model structure allowed the endogenous evolution of capital intensity and productivity (all aspects of the second demographic dividend) to be captured. They found that age transition explains around 17% of the per capita growth ratio in the period, while education expansion accounts for nearly 10%.6
Finally, more recently, NTA estimates and population projections were used in [25] to investigate how aging would restructure global GDP as a result of the continuation of the demographic transition. Overall, NTA has proved to be a valuable data source to enrich the analysis of the effects of aging on economic development.
4.2 Analyzing the welfare state: who is actually protected?
This section summarizes how NTA has been used to analyze the role and development of the welfare state. This institution is, undoubtedly, one of the main social achievements of the past century. It aims to ensure a minimum quality of life for all citizens, regardless of any other condition. Although it was created with a clear vocation of redistributing resources from the rich to the poor, nowadays, the most important social transfers actually act as intergenerational redistribution devices. This is the case of the three main pillars of the welfare state (education, health, and pensions), which redistribute resources from working-age people (who bear the highest taxes) to economically dependent ages: children (mainly through public education) and, especially, the elderly, who are the main recipients of public pensions and health services. As a whole, the welfare state is organized as a pay-as-you-go (PAYGO) system, in which the available resources at any given time (obtained from social contributions and taxes mainly raised from the working-age population) are distributed among the recipients of social transfers (mainly on the two lifecycle tails). For this reason, the population age structure is crucial to keep it running. Demographic change, together with the PAYGO financial rule, inevitably implies intergenerational redistribution. This is more explicit in the public pension system (organized as a PAYGO system in most countries), while it is also present by definition in the education and health system (which are also financed through an implicit PAYGO scheme).
NTA provides valuable information to observe how the welfare state effectively works by redistributing resources across generations at a given moment. The age profiles of taxes and public transfers paid/received at each age in each country inform about both the relative size of the welfare state and its specific composition (which social transfers are more important). Although, as expected, NTA data show that the level of development of the welfare state is not homogenous across countries, a common feature is almost universal: the welfare state tends to protect the elderly much more than children. This is clearly observed in Figure 9, built with NTA data of per capita public transfers received by the elderly (65+) and the young (0–24) in 15 different countries, with regard to their level of consumption. Figure 9 shows important differences across countries in the protection of the elderly and children, it always being much higher for the former than the latter. In Finland, the country with the highest transfers to the young, the government funds 46% of children’s consumption, while in the UK it hardly reaches 20%. For the elderly, the differences are much larger, going from 99% of public financing of elderly consumption in Sweden to just 28% in the US.
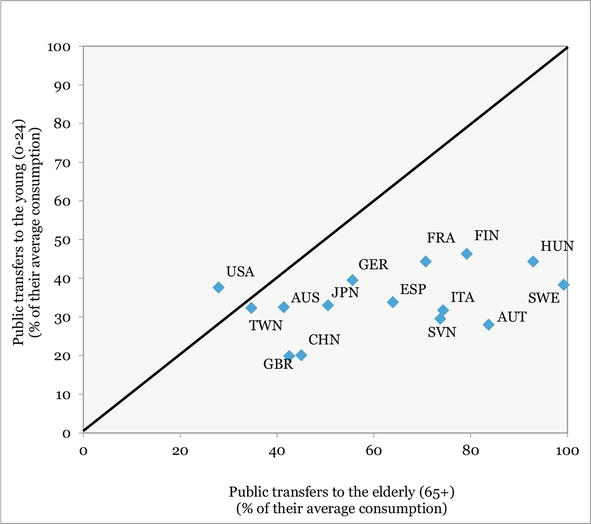
Figure 9.
Public transfers received by children (ages 0–24) and the elderly (ages 65+) as a percentage of their average consumption. Source: Authors’ elaboration with data from NTA project (
Overall, Figure 9 informs that, to some extent, the public sector has replaced the traditional role of families in caring for their elders, socializing (“from all to all”) this duty in most European countries. However, the welfare state has not evolved in the same line as regards childrearing, which has mainly remained as a family duty, aside from this socialization process.
This fact has been analyzed using standard NTA (see, for example, [26, 27]). Recently, in [28], NTA data have been used to go a step forward, analyzing the interplay between the welfare state and private transfers as redistribution devices at both inter and intragenerational levels. The authors chose four European countries representing the four different welfare state regimes: Austria (Conservative), Finland (Nordic), Spain (Mediterranean), and the UK (Anglo-Saxon). By employing a microsimulation model, authors can project the cross-sectional NTA age profiles disaggregated by gender, educational level, and family structure, simulating the lifetime net transfers received by individuals from both the government and the private sphere (mainly the family). Their analysis confirms the expected results by gender and educational level, showing interesting differences according to the welfare state regime. For instance, a gender gap in labor income is present across countries independently of the level of education. When differentiating by parenthood status, the gender gap remains but is always larger for parents. Moreover, fathers tend to earn more labor income than childless men, while the opposite happens to women. Austria (conservative welfare state regime) shows the highest difference in labor income between mothers and nonmothers, while Finland (social-democratic) presents the lowest, probably due to public policies promoting full employment.
More interestingly, the microsimulation exercise performed in [28] computes an estimation of the total (public and private) transfers to be received by the generation born in 2010 according to their level of education and parenthood status over their whole lifecycle. Results are summarized in Figure 10. Private transfers received are positive for any country and educational level, being larger for the childless: they receive resources from their parents when they are children, but later, they do not have to rear their own children. Public transfers, however, show differences. First, they are positive for low and medium levels of education but negative for the highly educated (revealing that this group pays more taxes than benefits received, contributing to the distributional role of the welfare state). More interestingly, the net contribution of highly educated parents is higher than that of the childless, except in Austria. Second, public transfers received tend to be higher for parents but, with the sole exception of the low educated in the UK, they are not enough to equal the total amount received by childless people. Austria shows a similar amount of total transfers for low and medium-educated parents and nonparents, but this is not the case for the highly educated, for the medium and high levels of education in the UK, or for Finland and Spain in any educational attainment.
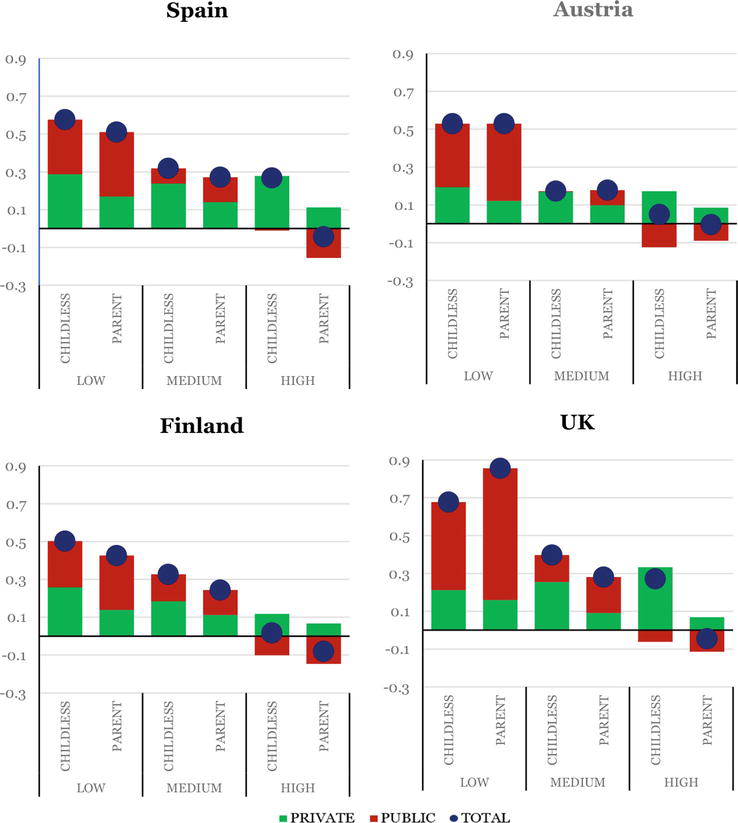
Figure 10.
Lifetime net transfers as a share of lifetime labor income for representative individuals born in 2010 (by educational level and parenthood status). Source: Reproduced from [
5. Final remarks
This chapter outlines the National Transfer Accounts (NTA) method and gives an updated account of some of the main applications developed so far. NTA breaks down National Accounts by age. More specifically, it identifies the age pattern of Life Cycle Deficit (LCD)—defined as the difference between consumption and labor income at any age—and it measures how the surplus at working age is transferred to dependent ages through the three available resource allocation devices (assets market and public and private transfers). A key feature of the methodology is to offer, for the first time, an explicit account of the private transfers given and received through the family. Moreover, National Time Transfer Accounts (NTTA) complete the picture by estimating production, consumption, and transfers of home production (in terms of time) also occurring in the private sphere.
NTA estimates offer valuable information to analyze the interaction between economics and demographic change and the political process that led to the development of the welfare state. NTA data are increasingly used in this direction, while some applications have been developed within the project. In this work, we have focused on two main applications. In Section 4.1, we gave an account of different attempts to investigate the interplay between demographic and economic development. First, NTA estimates allow us to measure the extent to which, at the earlier stages of the demographic transition, a demographic dividend occurs while the working population grows faster than the total population. Second, NTA data help to investigate the extent to which this first dividend can be followed by a second demographic dividend as long as positive effects arise from the education transition and/or from capital intensification.
Section 4.2 focuses on the lessons that NTA data offer on the income redistribution produced by the welfare state at inter and intragenerational levels. NTA and NTTA provide a better understanding of the roots of the gender differences observed in production and, consequently, in the LCD. They can also be employed to measure the extent to which parents might end up subsidizing childless individuals if public transfers do not compensate for the lower private transfers received by parents over their lifecycle.
Overall, the contribution of NTA to enrich the analysis of the economic effects of aging is undeniable. Today, most high-income countries have completed their demographic transition. They can only expect positive effects of aging on economic growth through improvements in worker productivity, coming from capital accumulation and/or further improvements in educational attainment. Interestingly, their experience could greatly help developing countries, which started their demographic transition much later. They can still benefit from the demographic dividend to shape better policies and foster the second demographic dividend. For these countries, the availability of rigorous analysis about how public policies can help to make the most of the demographic dividend period is crucial.
Acknowledgments
Financial support was received by the WELLCARE project (a project of the Horizon 2020 Joint Program Initiative More Years, Better Lives, grant numbers PCI2021-121913 and PCI2021-121975); and the Spanish Ministry of Science, Innovation, and Universities, Spain (grant number PID2020-114040RB-I00).
The authors thank their co-authors Marian Fink, Thomas Hovarth, Tanja Istenic, Ivan Mejía-Guevara, Elisenda Rentería, and Martin Spielauer, for agreeing to reproduce some of our common research results in several figures in this chapter. Likewise, the authors are especially grateful to Ron Lee and Andy Mason, the NTA project founder members, who have always supported and encouraged our work in this project. They have also agreed their results on estimations of the demographic dividend in Europe to be reproduced in this chapter (Figure 7).
References
- 1.
United Nations. World Population Prospects 2022. UN Population Division. 2022. Available from: https://population.un.org/dataportal/home [Accessed: January 9, 2023]. - 2.
Mason A, Lee R, editors. Population Aging and the Generational Economy: A Global Perspective. Chentelham: Edward Elgar; 2011. DOI: 10.4337/9780857930583 - 3.
United Nations. National Transfer Accounts Manual: Measuring and Analysing the Generational Economy. New York: Population Division, Department of Economic and Social Affairs, United Nations; 2013 - 4.
Donehower G. Methodology of the National Time Transfers Accounts. In: Urdinola P, Tovar J, editors. Time Use and Transfers in the Americas. Cham, Switzerland: Springer; 2019. pp. 5-40. DOI: 10.1007/978-3-030-11806-8 - 5.
Vargha L, Seme A, Gál R, Hamer B, Sambt, J. Manual of NTTA methodology and guidelines to the AGENTA NTTA data explorer. AGENTA project, deliverable D.2.3: 2016. Available from: http://www.agenta-project.eu/Jacomo/upload/publications/d-2.3-submitted.pdf [Accessed: December 10, 2022] - 6.
Istenič T, Vargha L, Sambt J. Is there a connection between welfare regimes and inter-age reallocation systems? The Journal of the Economics of Ageing. 2019; 14 :art. 100202. DOI: 10.1016/j.jeoa.2019.100202 - 7.
Rentería E, Scandurra R, Souto G, Patxot C. Intergenerational money and time transfers by gender in Spain: Who are the actual dependents? Demographic Research. 2016; 34 :689-704. DOI: 10.1080/13545701.2011.582822 - 8.
Kluge FA. The economic lifecycle by gender–results combining monetary and time use estimates. Comparative Population Studies. 2014; 39 (4):707-726. DOI: 10.12765/CPoS-2014-13en - 9.
Zannella M. Reallocation of resources between generations and genders in the market and non-market economy. The case of Italy. The Journal of the Economics of Ageing. 2015; 5 :33-44. DOI: 10.1016/j.jeoa.2014.09.003 - 10.
Gál RI, Szabó E, Vargha L. The age-profile of invisible transfers: The true size of asymmetry in inter-age reallocations. The Journal of the Economics of Ageing. 2015; 5 :98-104. DOI: 10.1016/j.jeoa.2014.09.010 - 11.
Hammer B, Spitzer S, Vargha L, Istenič T. The gender dimension of intergenerational transfers in Europe. The Journal of the Economics of Ageing. 2020; 2020 (15):100234. DOI: 10.1016/j.jeoa.2019.100234 - 12.
Galor O. From stagnation to growth: Unified growth theory. In: Aghion P, Durlauf S, editors. Handbook of Economic Growth. Vol. 1. Amsterdam: Elsevier; 2005. pp. 171-293. DOI: 10.1016/S1574-0684(05)01004-X - 13.
Bloom DE, Williamson JG. Demographic transitions and economic miracles in emerging Asia. World Bank Economic Review. 1998; 12 (3):419-456. DOI: 10.1093/wber/12.3.419 - 14.
Bloom DE, Canning D, Sevilla J. The Demographic Dividend: A New Perspective on the Economic Consequences of Population Change. Santa Monica, CA: RAND; 2003. DOI: 10.7249/MR1274 - 15.
Mason A. Demographic transition and demographic dividends in developed and developing countries. In: United Nations Expert Group Meeting on Social and Economic Implications of Changing Population Age Structure. New York: United Nations Population Division. Mexico; 2005 UN/POP/PD/2005/2. Available from: https://www.un.org/development/desa/pd/sites/www.un.org.development.desa.pd/files/unpd_egm_200508_09_mason.pdf [Accessed: October 10, 2022] - 16.
Lee R, Mason A. Fertility, human capital, and economic growth over the demographic transition. European Journal of Population. 2010; 2010 (26):159-182. DOI: 10.1007/s10680-009-9186-x - 17.
Mason A, Lee R, Jiang JX. Demographic dividends, human capital, and saving. The Journal of the Economics of Ageing. 2016; 7 :106-122. DOI: 10.1016/j.jeoa.2016.02.004 - 18.
Mason A, Lee R, Abrigo M, Lee S-H. Support ratios and demographic dividends: Estimates for the world. In: Population Division, Department of Economic and Social Affairs, Technical Paper 2017/1. New York: United Nations Publications; 2017 - 19.
Lee R, Mason A. The Demographic Dividend, an Opportunity for the Development of the Economy and the Welfare State. Barcelona: The Social Observatory, La Caixa Foundation; 2021. Available from: https://elobservatoriosocial.fundacionlacaixa.org/en/-/el-dividendo-demografico-una-oportunidad-para-el-desarrollo-de-la-economia-y-del-estado-del-bienestar [Accessed: November 25, 2022] - 20.
Mason A, Lee R. Reform and support systems for the elderly in developing countries: Capturing the second demographic dividend. Genus. 2006; 52 (2):11-35. DOI: 10.2307/29789308 - 21.
Johnes G, Johnes J, editors. International Handbook of the Economics of Education. Cheltenham: Edward Elgar; 2004. p. 872. DOI: 10.1080/00131940802368562 - 22.
Rentería E, Souto G, Mejía-Guevara I, Patxot C. The effect of education on the demographic dividend. Population and Development Review. 2016; 42 (4):651-671. DOI: 10.1111/padr.12017 - 23.
Lutz W, Butz WP, KC S. World population and human capital in the twenty-first century. In: Wittgenstein Centre Data Explorer. Oxford: Oxford University Press; 2014 Version 1.2 - 24.
Sánchez-Romero M, Abio G, Patxot C, Souto G. Contribution of demography to economic growth. SERIEs. 2018; 9 (1):27-64. DOI: 10.1007/s13209-017-0164-y - 25.
Mason A, Lee R, members of the NTA network. Six ways population change is affecting the global economy. Population and Development Review. 2022; 48 (1):51-73. DOI: 10.1111/padr.12469 - 26.
Patxot C, Rentería E, Sanchez-Romero M, Souto G. Measuring the balance of government intervention on forward and backward family transfers using NTA estimates: The modified Lee arrows. International Tax and Public Finance. 2012; 19 :442-461. DOI: 10.1007/s10797-012-9220-5 - 27.
Gál R, Vanhuysse P, Vargha L. Pro-elderly welfare states within child-oriented societies. Journal of European Public Policy. 2018; 25 :944-958. DOI: 10.1080/13501763.2017.1401112 - 28.
Spielauer M, Horvath T, Fink M, Abio G, Souto G, Patxot C, et al. Measuring the lifecycle impact of welfare state policies in the face of ageing. Economic Analysis and Policy. 2022; 75 :1-25. DOI: 10.1016/j.eap.2022.05.002
Notes
- The AGENTA Project obtained the first set of standard NTA estimates using EU surveys (available at http://dataexplorer.wittgensteincentre.org/nta/). WELTRANSIM Project (https://www.weltransim.eu/) built disaggregated NTA by education level and family type in four European countries. SUSTAINWELL project, starting soon, will extend these efforts to more European countries, building more standard estimates and going deeper at micro level, while WELLCARE (www.ub.edu/wellcare) is extending NTA to measure in more detail all the elements defining the economy of care.
- Data available in AGENTA dataexplorer (http://dataexplorer.wittgensteincentre.org/nta/). The estimations are based on data from HETUS (wave 1). See [5] for a description of the methodology and the results.
- See [6] for an analysis of how to use NTA to study the organization of the welfare state and its socioeconomic implications.
- In [11] the opposite result for Spain is obtained: a higher total contribution for women. This is due to the fact that they use a different valuation method to monetize NTTA profiles, in particular the average net wage of the economy instead of the replacement method. Moreover, they argue that these results can be regarded as a lower bound of alternative valuations of unpaid work in relation to paid work.
- An outstanding example of the cross- fertilization between economics and demographics literature is Galor’s Unified Growth Theory in [12], which extends endogenous growth models to introduce a changing demographic structure.
- In this case, the OLG model structure allowed the endogenous evolution of capital intensity and hence the second demographic dividend to be captured. There are a variety of projection strategies that allow the different dimensions of the complex interaction among economics and demographics to be captured in different ways.