Open Access is an initiative that aims to make scientific research freely available to all. To date our community has made over 100 million downloads. It’s based on principles of collaboration, unobstructed discovery, and, most importantly, scientific progression. As PhD students, we found it difficult to access the research we needed, so we decided to create a new Open Access publisher that levels the playing field for scientists across the world. How? By making research easy to access, and puts the academic needs of the researchers before the business interests of publishers.
We are a community of more than 103,000 authors and editors from 3,291 institutions spanning 160 countries, including Nobel Prize winners and some of the world’s most-cited researchers. Publishing on IntechOpen allows authors to earn citations and find new collaborators, meaning more people see your work not only from your own field of study, but from other related fields too.
The context of reception is an important theoretical and empirical tool for understanding immigrant assimilation. Yet, this concept has been narrowly defined as a gender-neutral socioeconomic and political context that immigrants encounter at arrival. We argue that this concept can be useful for understanding immigrant women’s workforce assimilation, but that it needs to be expanded to incorporate the gender-specific characteristics of immigrant flows at arrival. Gendered cohort dimensions such as the sex ratio, share of women migrating unmarried, and share of men and women who are highly educated shape immigrant women’s employment trajectories and contribute to national origin differences in labor force participation. We leverage a synthetic double-cohort approach using U.S. Census data from 1990 to 2019 to track immigrants’ work trajectories over years since migration. We propose a five-group typology to simplify the analysis of national origin variation in patterns of workforce incorporation. We assess the impact of individual socioeconomic and gendered cohort characteristics at different points in the adaptation process (arrival, medium, and long term) to demonstrate the utility of a gendered context of reception for understanding national origin variation in immigrant’s modes of incorporation.
French Institute for Demographic Studies (INED), Aubervilliers, France
Chenoa Flippen
University of Pennsylvania, Philadelphia, USA
Emilio Parrado
University of Pennsylvania, Philadelphia, USA
*Address all correspondence to: sandra.florian@ined.fr
1. Introduction
Immigrants represent more than 160 million workers worldwide, 42 percent of whom are women [1]. In the United States, where 13.7 percent of the population is foreign born, immigrant women constitute 16.3 percent of all employed women [2]. Scholars and politicians increasingly recognize the importance of immigrant women’s economic contributions to their families and to the global economy [3, 4]. However, immigrant women in the U.S. hail from diverse countries and gender role contexts, and their labor force participation (LFP) rates vary greatly [5, 6, 7]. Understanding immigrant women’s workforce incorporation requires considering how migration contributes to changing gender roles and female independence, dimensions of assimilation that do not readily apply to men [8, 9].
Research on immigrant women’s employment has proliferated in recent decades. Most studies find that immigrant women exhibit lower LFP rates, higher unemployment, and lower wages than immigrant men and native-born women, revealing immigrant women’s double gender- and nativity-based disadvantage in the labor market [4, 8]. However, patterns of female labor force assimilation vary dramatically across national origin groups. While traditional indicators of human capital, such as education and language proficiency, as well as individual’s family structure account for part of this variation, large disparities remain even net of compositional differences across groups [6, 8, 10].
To account for these differences, scholars have turned their attention to how gender norms shape employment patterns. Studies have shown that factors such as sending country female LFP [11, 12], gender LFP ratio and fertility rates [5], gender equality indices [13], gender role attitudes, religion, and other measures of cultural traditionalism [14, 15, 16] correlate with immigrant women’s LFP at destination. Findings indicate considerable continuity in labor market attachment with women from more gender traditional countries exhibiting lower LFP after migration than their counterparts from more gender egalitarian origins. Although analyzing indicators of gender norms in source countries has enhanced our understanding of immigrant women’s LFP, these measures capture average population characteristics for entire sending countries, and fail to account for selectivity of migration flows [17]. Because immigrants differ in their levels of traditionalism from the overall population in their countries of origin, national-level indicators of cultural gender norms do not necessarily characterize immigrant women [18].
Moving forward the literature on immigrant women’s labor market incorporation, we argue for the utility of three key methodological approaches. The first is assessing the impact of gendered characteristics of immigrant flows at the time of migration on immigrant women’s labor supply. This approach takes into account the selectivity of migration flows produced by gendered aspects of both sending and receiving areas. We consider three gendered immigrant cohort aspects at arrival: characteristics relating to immigrant women themselves (the share of women arriving single and the share arriving with a college education); characteristics relating to immigrant men’s economic potential (the share of men arriving with a college education); and relational dynamics (the cohort’s gender ratio). We argue that higher shares of women migrating single and greater representation of women in immigrant cohorts signal demand for female immigrant labor in receiving areas, and thus will favor their LFP [9, 18]. A higher proportion of immigrant men arriving with a college education, in contrast, is indicative of male privilege and male immigrant labor demand, that until 2015 imposed restrictions on immigrants’ wives’ employment [19]. The impact of the share of immigrant women who are college educated could be more complex. Better-educated cohorts would be expected to average higher LFP, as human capital increases the returns to employment [20]. However, immigrant women’s education is also highly correlated with that of immigrant men. To the extent that highly educated immigrant women are disproportionately accompanying men with restrictive employment visas, the educational composition of migration flows could have counterintuitive effects on female LFP.
Second, we argue for the importance of analyzing immigrant women’s workforce trajectories, as opposed to average employment levels at a single point in time. We draw on data from the 1990 and 2000 U.S. Censuses and the American Community Survey corresponding to the periods between 2005 and 2009, 2010–2014, and 2015–2019 [21] to construct synthetic immigrant cohorts for different ages and periods of arrival. We include the 14 largest national groups in the United States, where sample sizes are too small for country-level analyses, we consider regional groups. Using synthetic cohorts, we are able to track immigrant women’s LFP trajectories, analyzing cohort variation in LFP entry levels and growth rates over time.
Finally, to simplify the analysis and facilitate the drawing of broader conclusions, we use group-based trajectory modeling (GBTM) to identify groups that follow similar LFP patterns. We then use linear probability models with splines to analyze differences in LFP at arrival (starting points), and trajectories over time (growth rates) in the medium and long term. This strategy provides important insights into the evolution of national origin disparities in immigrant women’s LFP over time that are not evident in group averages.
Results show that gendered migration cohort characteristics help explain immigrant women’s LFP, accounting for between one-fourth to more than half of the remaining disparities after adjusting for individual characteristics across national origin for certain groups. Overall, findings document the importance of human capital characteristics and cultural gender norms, as well as historically produced structural aspects of the context of reception that shape immigrant women’s LFP.
Women’s LFP has grown rapidly over the second half of the twentieth century, significantly reducing the gender gap in employment. For the 2010–2019 period, LFP rates in the United States were 74% for Black, White, and Hispanic native-born women, and 83% for Asian native-born women [21]. In contrast, the LFP rate for immigrant women was only 65% for the same period. However, LFP varies tremendously by country of origin. Immigrant women from Mexico, India, Korea, and of Arab descent exhibit LFP rates at or below 60%, while rates for women from the Philippines and the Caribbean exceed 80% [6, 7, 9]. Several theories have been proposed to explain this variation.
2.1 Modes of incorporation and immigrant women’s LFP
Early theories of immigrant incorporation posited a relatively universal process of gradual assimilation driven largely by the characteristics of immigrants themselves [22, 20]. However, more recent and critical perspectives revealed a variety of modes of incorporation across groups [23, 24]. The concept of modes of incorporation draws attention to the importance of two sets of factors shaping adaptation: the context of origin and the context of reception.
The context of origin shapes immigrants’ socioeconomic characteristics at the time of migration, including educational attainment, labor market experience, financial capital, and family structure, all factors that have a powerful impact on immigrant women’s labor supply. Educational attainment increases LFP by raising the returns to employment and the opportunity cost of not working [20, 25]. LFP also increases with time of U.S. residence and fluency in English. In contrast, traditional gender expectations that come with marriage and childrearing increase women’s domestic labor, constraining women’s time for paid employment [4, 13, 15, 26].
These socioeconomic characteristics explain a significant proportion of national origin variation in immigrant women’s LFP [6, 10]. Groups with higher human capital endowment, such as those from Europe, Canada, the Philippines, China, and the Caribbean, exhibit high employment rates, while those with lower levels of education and English language proficiency, such as Mexicans, have lower LFP [9, 10]. Yet, there are also notable exceptions who do not conform to these expectations. For example, women from India and South Korea average high levels of educational attainment, but exhibit relatively low levels of LFP [6, 9]. While a disproportionate share of these women are married and have young children at home, these characteristics do not completely explain the relatively low levels of LFP among these groups [9].
Indeed, after adjusting for individuals’ levels of human capital, family characteristics, and length of residence, significant disparities in immigrant women’s LFP remain [4, 6, 10, 11], prompting scholars to examine how other aspects of the context of origin, such as gender attitudes and roles, also influence immigrant women’s LFP in receiving societies. Scholars have argued that source country gender norms infuse a repertoire of preferences, beliefs, and values that exerts a persistent influence on women’s post-migration labor supply [13, 14]. Several measures have been used to assess the impact of gender cultural norms in countries of origin, including home country female LFP [11], fertility rates, gross domestic product [5], gender equality indices [13], gender role attitudes, religion, and other measures of cultural traditionalism [14, 16, 27, 28], which are all correlated to women’s LFP after migration.
However, cultural norms are not homogenous within sending societies, but rather tend to vary across rural and urban areas and by level of education. In addition, women are not randomly drawn into migration, but are instead often selected on many dimensions that shape individuals’ gender roles and attitudes [17]. As such, national level gender cultural measures do not necessarily apply well to immigrant women, particularly to female-driven migration and flows with more single women. Given these limitations, He and Gerber [18] proposed a sequence of marriage and migration framework, distinguishing between women who migrated single from those who migrated together with or after their husbands, as a way of capturing cultural norms net of immigrant selectivity.
Far less attention has been devoted to how the context of reception shapes national origin variation in immigrant women’s economic assimilation. The context of reception refers to opportunity structures in communities of settlement. This includes factors such as immigration policies, economic opportunities, ethno-racial stratification, level of nativism and acceptance of newcomers, and social capital in co-ethnic communities. The context of reception can be positive (providing legal entry, access to jobs, and resettlement assistance); indifferent (providing legal entry, but without resettlement assistance), or negative (with hostility and active opposition to immigrants) [24, 29]. Social and economic opportunities in local communities, particularly related to the labor and housing market, are also important for immigrant’s incorporation. Immigrants in welcoming communities that offer jobs and housing opportunities assimilate faster and more successfully, whereas those in hostile communities with barriers to employment and housing have a harder time incorporating into the host society [29].
While crucial for understanding immigrant incorporation, the context of reception has been described as a gender-neutral environment, overlooking the gendered nature of opportunity structures shaping economic assimilation. However, the demand for immigrant labor is highly gendered, with men and women often working in starkly different industries [7, 30, 31]. This gendered labor demand also intersects with immigration policies, which often favor certain classes of workers. When employment-based immigration pathways include sex-segregated occupational niches, they can have a profound effect on the LFP of immigrant spouses, who are often precluded from working in the formal economy for extended periods after migration. We argue that it is important to incorporate these gendered aspects of receiving contexts when attempting to explain immigrant women’s incorporation [32].
2.2 Gendered migration cohort characteristics
One way to capture dimensions of both the context of origin and context of reception is to focus on gendered characteristics of migration flows at arrival, which reflect sending country norms, differential selection into migration, and gendered aspect of labor demand in receiving countries [9]. In this chapter we consider three dimensions of gendered migration dynamics: those pertaining to immigrant women themselves, those pertaining to their male peers, and relational dynamics.
For the characteristics of women themselves, we consider the share arriving single and their educational composition. Given that single immigrant women tend to marry soon after arrival, marital status years after migration does not adequately capture the greater economic independence implied by higher rates of single women at arrival [32]. We argue that the share of immigrant women arriving single captures gender roles in sending countries and receiving areas, including the forces shaping selection into migration [26, 33]. Countries with stronger patriarchal norms tend to discourage the migration of single women, such as Latin American, South Asian, and Arab countries [18, 28, 34]. Most women from these regions tend to arrive married. Marriage and young children have historically constrained women’s employment; however, the effect of marriage and children significantly vary by national origin [4, 6]. Low proportions of single women at arrival may also indicate poor demand for immigrant women’s labor in the receiving context, while the opposite is true in flows with high representations of single women. In the latter case, immigrant women are also more likely to find other employed co-ethnic women at arrival who can facilitate the search for employment.
Likewise, the educational composition of co-ethnic women at arrival could shape immigrant women’s LFP even net of their own educational characteristics. All else equal, more well-educated women within a migration cohort should encourage the cohort’s LFP, as they are more likely to find employment and, thus, constitute a form of social capital connecting co-ethnics to employment information and networks. However, the potentially employment-promoting effect of highly educated co-ethnic women could be hampered by other factors, such as immigration policies that restrict employment.
The second dimension we consider relates to migrant male peers. We considered the proportion of co-national men with college education at arrival as an indicator of their economic potential. Migrant flows comprised of highly educated men tend to signal male privilege in sending and receiving contexts. Having a highly educated partner could also reduce women’s pressure to augment and diversify family income [6, 26]. Moreover, in disproportionately male, highly educated migration streams, women often enter the United States as spouses of H1-B visa holders. Prior to 2015 H1-B visa spouses were ineligible for employment, unless they were able to secure their own visa sponsor [19]. While a path to employment was subsequently created for those with dependent spousal visas, there remain numerous requirements that can delay or even preclude employment among this class of migrants. Because H1-B intensive industries employ a disproportionate share of men, the impact of these policies is highly gendered. Moreover, H1-B work visas are highly unevenly distributed across countries, with India and China alone accounting for 84% of such visas [35]. The gendered impact of these policies could therefore also contribute to national origin differences in immigrant women’s LFP.
Finally, we also consider relational dynamics, namely the sex ratio of the migration flow. The gender composition often reflects cultural norms about women’s roles [16, 18] and migration-related governmental strategies in sending countries [7], both of which could influence immigrant women’s LFP in receiving communities. The gender ratio also signals the extent to which labor demand in receiving contexts is gendered [5, 7]. When migration is driven by labor demand in male-dominated sectors or more patriarchal sending environments, men tend to be overrepresented in the flow, such as the case of agriculture- and construction-driven Mexico-U.S. migration [32]. The converse is true when immigrant labor demand is female-dominated, such as nursing and other health-care driven migration from the Philippines, where the government also actively encourages women’s migration [7, 36]. Thus, analyzing differences in the gender ratio of the immigrant flow at arrival provides insights into how cohort gender norms and gendered labor demand structure employment over and above individual level predictors.
Data for the analysis come from the 5% samples of the 1990 and 2000 decennial U.S. Census, and the 5-year American Community Surveys 2009 (covering 2005–2009), 2014 (covering 2010–2014), and 2019 (covering 2015–2019). The sample includes immigrant women ages 16 to 54 living in U.S. households between 1990 and 2019 and who arrived between 1980 and 2014 at ages 15 to 44. Individuals living in group quarters and those enrolled in school are excluded from the sample.
3.2 Measurements
Labor force participation (LFP) is defined as being employed or unemployed but actively looking for employment, according to the U.S. Census definition. LFP is measured with a dichotomous variable, where 1 designates in the labor force, and 0 not in the labor force.
National origin. We used place of birth to identify immigrants’ country of origin. We classified immigrants into 14 mutually exclusive dummy variables corresponding to their country or region of origin (the latter for groups with smaller sample sizes). The groups include Europe (referent), Canada, Mexico, Central America, South America, Cuba, China, Vietnam, Korea, India, other Asian countries, Africa, the Philippines, and Caribbean countries. We exclude immigrants of unknown origin and those from Australia/New Zeeland (0.33% and 0.31% of the original sample, respectively) due to small samples sizes.
Years since migration is a continuous variable used to trace LFP trajectories over time. It is measured in 3 splines, the first comprising 0–2 years (reference), which captures LFP rates at arrival; the second 3–10 years, assessing growth rates in the medium term; and the third 11 years or more, measuring growth rates in the long term.
Age at migration is measured in 5-year interval dummy variables including 15–19, 20–24 (referent), 25–29, 30–34, 35–39, and 40–44.
Period of arrival is measured in 4 categories 1980–1989 (referent), 1990–1999, 2000–2009, and 2010–2019.
Human capital is captured by indicators of education and English proficiency. Education is measured in four categories including less than high school, high school (referent), some college, or college degree or higher. English proficiency is measured with a dummy variable that takes the value of 1 for those who did not speak English well or at all, and 0 otherwise.
Family structure is assessed by marital status and the presence of young children. Marital status is measured with a dummy variable that takes the value of 1 for married women with a spouse present in the household, and 0 otherwise. Young children are assessed by a dummy variable that takes the value of 1 for individuals with pre-school age, less than 5 years old, children in the household at the time of the survey.
The gendered context of reception is assessed using four immigrant gender characteristics at the cohort level. The proportion of single women at arrival is calculated as the average proportion single in each cohort during the first 4 years in the U.S. Similarly, the proportion of college educated women and the proportion of college educated men is the average proportion with college education in each cohort by sex during the first 4 years in the U.S. The sex ratio is the number of men to women in each cohort at arrival, estimated as the average during the first 4 years after migration. A sex ratio equal to 1 represents a balanced sex composition, with equal numbers of men and women. A sex ratio greater than 1 reflects a male-predominant immigrant flow, whereas a sex ratio less than 1 indicates a female-predominant immigrant flow.
Our primary analytic strategy is to assess immigrant women’s LFP trajectories over time, and to examine differences across national origin groups at different points in the adaptation process. The study of immigrant assimilation has been limited by the lack of longitudinal data. Most studies rely on cross-sectional data, yet cross sectional approaches do not allow us to distinguish changes in labor market outcomes that accrue with assimilation, often measured as years since migration, from shifts in the composition of immigrant cohorts over time – for example, due to increases in education in sending countries [25, 26, 37].
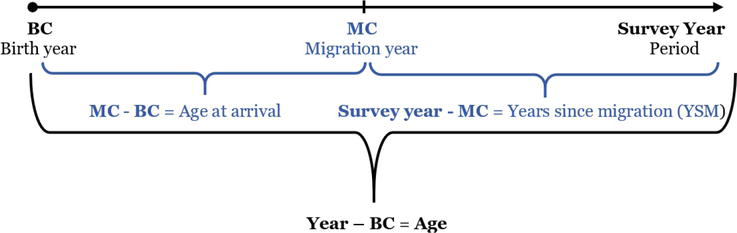
Using synthetic cohorts, which combine multiple waves of cross-sectional data to track migration cohorts over time, represents a more adequate strategy to assess immigrant labor market assimilation. A limitation of this method is that it does not track the same individuals over time, but rather reconstructs cohorts’ trajectories using demographic principles. Nevertheless, this method is able to take into account change across both birth and immigration cohorts. As Figure 1 illustrates, birth cohorts (in black), address the issue of age-period-cohort identification, that is the impossibility of adding these three variables in a regression model because the third one, for example age, can be calculated using the other two (survey year minus year of birth). Immigration cohorts (in blue), address the duration-period-immigration age identification problem, considering years since migration (duration), year of migration (period), and age (at migration). A double cohort approach, which recreates trajectories for both birth and period of arrival cohorts, has been shown to be particularly advantageous [9, 38].
Figure 1.
Double-cohort method: Birth cohort (BC) and migration cohort (MC).
While this approach has become common in analyses of immigrant men’s employment, it remains underutilized in studies of immigrant women’s LFP. We propose a variation of the double cohort approach to analyze immigrant women’s LFP trajectories. Instead of tracking immigrant cohorts according to their year of birth and period of arrival, as in most prior studies, we follow cohorts as a function of their age at arrival, period of migration, and country/region of origin. For example, a cohort arriving to the United States in 1995 between ages 20–24 would have about 5 years of U.S. residence and be between ages 25–29 in 2000. By 2010, this cohort would have been in the U.S. for 15 years and would be between 35 and 39 years of age. While we do not track the same people over time, this variation of the double cohort approach allows us to better approximate LFP trajectories over years since migration, as cohorts age in the host country. The 14 national origin groups, 6 age-at-migration cohorts, and 4 periods of arrival results in 336 immigrant cohorts.
We further distinguish between the rates of LFP at arrival from growth rates over time to better understand whether the disparities in LFP across national origin groups are created at arrival or by differential rates of change with time in the host country. This approach also allows us to separately analyze the forces shaping immigrant women’s LFP at different points of time after migration. Employment patterns, and differentials, shortly after arrival are likely to differ from those in the medium- and longer-term. Groups with high levels of LFP at arrival could be responding to labor demand in specific occupational niches [18, 36, 39]. For these flows, we should expect little increase in LFP over time and the most salient question is the extent to which participation remains high. Alternatively, flows with relatively low LFP at arrival could signal situations where women are likely not the primary economic providers. Nevertheless, there is likely important variation in the timing and extent of increasing LFP over time, even among groups that begin with relatively low levels of workforce engagement. The impact of socio-demographic factors on immigrant women’s LFP could also vary depending on whether we consider participation soon after arrival or trajectories over time [5, 39]. For example, educational credentials are often not readily transferable across contexts [40, 41]. Thus, the impact of education on LFP at arrival may be muted. However, if highly educated women are able to gain employment opportunities more quickly than less educated women, human capital disparities in LFP could grow with longer durations of U.S. residence [25].
To facilitate the analysis and interpretation of LFP trajectories, we apply Group-Based Trajectory Modeling (GBTM) to the synthetic cohort trajectories to identify patterns of labor force assimilation. Similar to Latent Class Analysis (LCA), which aims at identifying groups or clusters with a similar categorical outcome, GBTM is designed to detect clusters that follow similar developmental trajectories [42]. The model assumes that the population distribution of trajectories emerges from a finite mixture of unknown order (or number of groups). The optimal number of groups is ultimately determined by the researcher. GBTM uses a multinomial modeling strategy to assign each immigrant cohort a probability of being in a cluster conditional on the number of groups and the shape of the group-specific trajectory. A limitation of GBTM is that the resulting clusters can be hard to interpret, demanding a thorough analysis from the researcher. We tested models with different group sizes from three to seven. We followed best accepted practices to determine the optimal number of groups using a combination of criteria, including the smallest Bayesian information criteria (BIC), parsimony in the number of groups that best fit the data, the size of the resulting groups, and the interpretability of the clusters [43]. We propose a five-group typology that we present in the results section.
We then use linear probability models for the multivariate analyses, specified in Eq. (1):
where the probability of LFP for individual i Pr(Yi = 1) is a function of the four mutually exclusive dummy variables p indexing period of arrival; the mutually exclusive dummy variables ni indexing country/regions of origin; the six mutually exclusive dummy variables ai indexing age at arrival; the three variables from the years since migration spline specification ti; the vector of individual’s socioeconomic covariates, ei, that is, human capital and family structure; and the vector of gendered cohort-level characteristics, gc, including the ratio of men to women, the share of women single, and the share of women and men who are college educated upon arrival for each cohort c. National/regional origin, age-at-migration, socioeconomic, and gendered cohort characteristics are interacted with the spline indicators (ni*ti; ai*ti; ei*ti; gc*ti; respectively), and σi is the error term.
We compute predicted values to assess the extent to which individual- and cohort-level characteristics help explain variation in LFP trajectories. To account for the clustering of observations within period-of-arrival, age-at-arrival, and national/regional origin, we compute robust standard errors clustered at the cohort level. This specification assumes that observations are independent across cohorts, but allows observations to be correlated within cohorts.
4.1 Immigrant women’s labor force incorporation typology
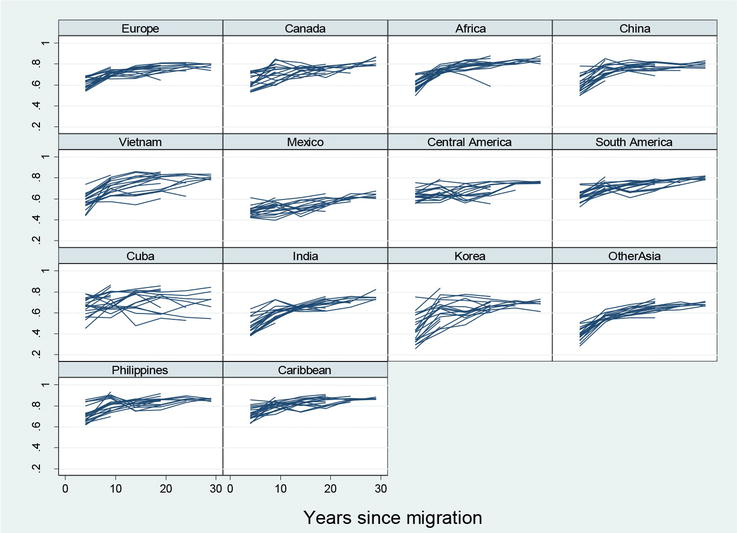
Figure 2 graphs the synthetic cohort LFP trajectories for immigrant women in the U.S. for the 14 national/regional origin groups. The different lines represent each cohort’s LFP trajectory by years since migration. The curves show each cohort’s initial LFP rate at arrival and the growth at roughly five-year intervals, reflecting changes in LFP as women age over time in the United States. Despite considerable variation in cohorts’ LFP at arrival and growth rates over time, the spaghetti plots reveal some common patterns by national origin. We describe the different patterns using two extreme cases, Mexico and the Philippines. The trajectories of Mexican women show relatively low levels of LFP at arrival, around 40%. Over time, their LFP increases very slowly. The overall rate of LFP among Mexican immigrant women does not exceed 70% for any of the cohorts. In contrast, women from the Philippines exhibit much higher levels of LFP at arrival, close to 70%. Unlike the Mexican case, LFP increases almost immediately after arrival, quickly reaching nearly 80%. Filipinas maintain very high rates of LFP throughout the years of observation.
Figure 2.
Immigrant women cohorts’ LFP by national origin and years since migration to the United States (Spaghetti plots). Source: U.S. Census 1990, 2000; American Community Survey 2005–2009, 2010–2014, and 2015–2019.
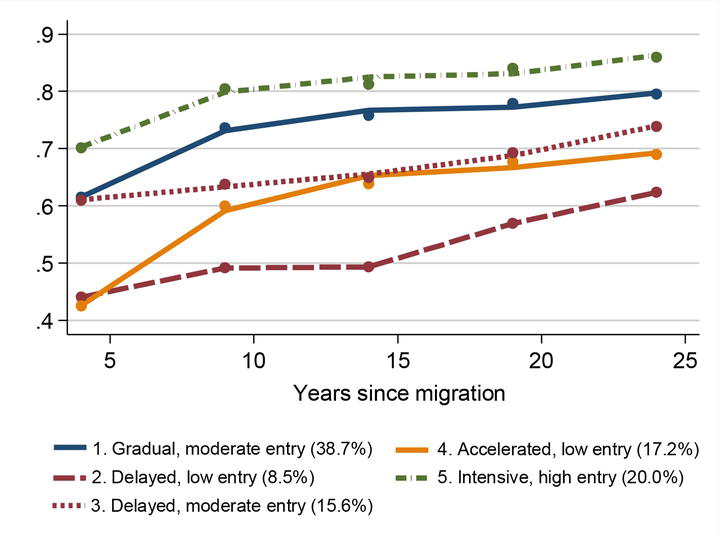
To better grasp this variation, we used Group-Based Trajectory Modeling (GBTM) to identify similar patterns of LFP trajectories across national groups. We propose a five-group typology, which synthesizes the patterns labor force incorporation by maximizing the between-group variation and minimizing within-group variation, as presented in Figure 3. While there is substantial heterogeneity among certain national origin cohorts, which are sometimes split among two or more clusters of the proposed typology, we assign national origin groups to the incorporation typology for which they have the highest probability of membership.
The first group illustrated in Figure 3 shows a pattern of gradual incorporation with moderate entry rates, and comprises 39% of the cohorts. These cohorts averaged nearly 60% LFP rate at entry, gradually increasing to over 75% over time. Most of this gain occurs during the first 10 years in the U.S., then the growth rate slows down. This pattern corresponds to cohorts from Europe, Canada, Africa, and China, and some cohorts from Vietnam and South America as observed in the Spaghetti plots in Figure 2. The second group depicts a pattern of delayed incorporation with low entry rates, a pattern representing 8.5% of the cohorts, the vast majority coming from Mexico. These cohorts exhibit low starting rates of LFP, at around 45%, which are followed by sluggish growth rates over time. After 10 years in the U.S. their LFP rates increase to barely 50%, taking more than 15 years to reach levels of 60%. The third group exhibits a pattern of delayed incorporation with moderate entry rates, and includes 16% of the cohorts. Similar to the former group, this group also exhibits slow growth rates, but start at rates slightly over 60%. This group illustrates the patterns found among cohorts from Central America and Cuba. A few cohorts from South America and India also fall into this group. It takes more than 15 years in the country for their LFP rates to increase to over 65%. The fourth group exhibits a pattern of accelerated incorporation with low entry rates, comprising 17% of the cohorts. These cohorts show rates of roughly 40% at arrival, but achieve rapid gains during the first years, surpassing the 60% level after 10 years in the country. This group describes the incorporation patterns of most cohorts from India, Korea, and other Asian countries. The last cluster shows a trajectory of intensive LFP, with high entry levels, and includes 20% of the cohorts, the vast majority coming from the Philippines and the Caribbean. These cohorts exhibit LFP rates over 70% at entry and after 10 years they surpass the 80% benchmark.
4.2 Explaining national origin differences in LFP trajectories
Explaining national/regional-origin differences in LFP requires first evaluating compositional differences in the predictors of employment across groups. Table 1 reports socio-demographic individual and cohort-level characteristics of the sample by country/region of origin following the five-group typology. The lowest rates of LFP are observed for the groups with delayed, low entry and accelerated, low entry LFP rates, i.e., cohorts from Mexico, India, Korea and other Asia, who exhibit average LFP rates below 60%. In contrast, cohorts in the intensive employment group, such as immigrant women from the Philippines and the Caribbean, exhibit the highest average LFP rates, above 80%. Most other groups exhibit rates slightly above 70%. The group typology does not clearly correlate with the length of residency; some of the longest settled groups exhibit relatively high LFP rates, such as women from the Caribbean who have been in the U.S. 14 years on average, whereas other exhibit the lowest average rates of LFP, such as cohorts from Mexico that have been in the U.S. for 13 years on average.
Demographic
Human Capital
Family
Gender Cohort Characteristics at Arrival
N
LFP
Age at survey (mean)
Years in the U.S. (mean)
Years education (mean)
% English not well
Married (%)
Preschool children (%)
Sex Ratio (M/W)
% Women single
% Women w/ college
% Men w/ college
Gradual, moderate entry
Europe
152,012
71.9
39.1
11.8
14.3
11.1
71.7
20.6
0.98
31.3
37.9
45.2
Canada
25,689
71.8
39.0
11.4
14.6
2.9
71.0
23.0
0.96
35.0
45.4
52.8
Africa
49,610
74.4
38.0
11.1
13.2
12.4
59.2
30.5
1.20
36.5
26.8
32.7
China
89,747
73.5
40.0
12.5
14.1
31.1
74.7
19.9
0.85
35.0
47.3
59.4
Vietnam
46,380
73.7
40.1
13.9
10.9
49.0
68.9
21.2
0.85
41.3
8.3
12.5
Delayed, low entry
Mexico
409,643
53.2
36.7
13.0
9.3
66.6
64.5
31.3
1.60
35.9
5.2
4.2
Delayed, moderate entry
Central America
143,569
67.9
37.7
13.1
10.0
56.0
50.2
25.0
1.30
46.8
7.9
5.7
South America
102,461
71.6
39.1
12.1
13.1
27.9
62.1
21.2
0.95
35.9
26.8
26.8
Cuba
22,674
72.3
39.9
11.2
12.5
54.1
54.9
15.7
1.08
27.7
18.7
16.6
Accelerated, low entry
India
103,582
59.5
36.9
10.5
15.1
12.1
87.3
30.8
1.18
17.4
66.4
73.7
Korea
37,345
58.7
40.4
12.6
14.2
36.3
77.0
19.2
0.75
27.8
44.0
51.9
Other Asia
88,479
57.1
38.6
11.9
12.8
24.5
75.0
26.0
1.03
33.1
35.3
43.4
Intensive, high entry
Caribbean
53,093
82.1
40.1
14.0
12.5
10.0
44.0
18.8
0.92
52.7
9.7
9.9
Philippines
81,430
81.4
40.1
12.8
14.5
3.3
69.1
19.3
0.62
32.6
49.6
45.2
Table 1.
Descriptive statistics for immigrant women’s demographic, human capital, family, and group-level gendered migration characteristics by national origin.
Note: Immigrant women ages 16–54, who migrated from ages 15–44, not living in group quarters, not attending school.
Source: U.S. Census 1990, 2000; American Community Survey 2005–2009, 2010–2014, and 2015–2019.
The lowest levels of human capital, measured by education and English ability, are observed for cohorts with delayed incorporation (low and moderate entry level), especially Mexican and Central American women. Low human capital is also observed for Vietnamese women, whose pattern of incorporation falls in between gradual and delayed. The opposite holds for cohorts in the accelerated, low entry incorporation group, such as women from India and Korea who have high levels of human capital, but still exhibit low rates of LFP. Other factors should also be considered, such as family characteristics, which roughly correlate with our LFP typology. High marriage rates, 75–87% are observed in the accelerated, low entry group, e.g. Indian and Asian women, whereas low marriage rates generally accompany high rates of LFP, such as for Caribbean and African women, who exhibit marriage rates of 44% and 59%, respectively. The presence of preschool-age children in the household also corresponds to low rates of LFP, such as the case of Mexican and Indian women, 31% of whom have preschool age children in the home, whereas cohorts in the intensive group exhibit a lower presence of young children in the home, such as Filipina and Caribbean women, among whom fewer than 20% have preschool age children in the home. The case of African women in the gradual group is more particular, combining a relatively high presence of young children in the home, 30%, with relatively high rates of LFP, 74%.
The gender cohort characteristics at arrival are estimated as cohort averages for the first 4 years after migration. A sex ratio higher than 1 indicates a male predominant flow, which is generally associated with lower female LFP, such as for cohorts from Mexico (1.60), Central America (1.30), and India (1.18). Conversely, sex ratios lower than 1, which indicate an overrepresentation of women, such as in cohorts from the Philippines (0.62) and the Caribbean (0.92) in the intensive group and China (0.85) in the gradual group, tend pair with high rates of immigrant women’s LFP. The pattern is less clear for cohorts from Korea that combine a female predominant flow (sex ratio = 0.75) with low rates of LFP (59%).
We explored the correlations between different gendered cohort characteristics, as shown in Table 2. Results indicate that the share of immigrant men and women entering with a college degree is highly and positively correlated (0.88). In contrast, the percent of women arriving single is moderately and negatively correlated (−0.61) with the percent of men with college education at arrival. Cohorts from Mexico and Central America exhibit the lowest percentage of college educated women at arrival, 5% and 8%, respectively, and college educated men at arrival, 4% and 6%, respectively. By contrast, 66% of women as well as 74% of men from India are college educated at arrival, followed by cohorts from Korea, China, the Philippines, and Canada, among whom between 44–50% of women have a college degree at arrival, as well as between 45–59% of men. Women predominate at arrival in most of these flows, with the exception of cohorts from India. The case of India reflects migration driven by male labor demand; 87% of women in these flows arrive married, most of whom are spouses of H1-B visa holders that until 2015 restricted their right to work [19].
Correlations among gender cohort charateristics at arrival.
p < 0.05.
Note: Cohort charatecteristics estimates for the first 4 years since migration.
As expected, cohorts with higher percentages of single women at arrival tend to exhibit higher rates of LFP, such as the case of Caribbean cohorts in which the majority of women, 53%, arrive single. Whereas immigrant flows with fewer single women at arrival, such as cohorts from India (17%) and Korea (28%), tend to exhibit lower rates of LFP.
We next investigate the extent to which national origin differences in LFP trajectories are explained by individual human capital and family characteristics. Table 3 reports coefficients from linear probability models predicting LFP trajectories by national origin. The results are organized around the five-cluster typology, with European women with 0–2 years of U.S. residence as the referent. Model 1 includes national/regional origin, age at arrival, their interactions with the splines of years since migration, and period of arrival. Model 2 adds individual-level predictors, human capital and family characteristics, and their interactions with the splines.
Coefficients from linear probability models predicting immigrant women’s LFP at arrival, medium- and longer-terms years after migration.
p < 0.10.
p < 0.05.
Note: Immigrant women ages 16–54, who migrated from ages 15–44, not living in group quarters, not Attending school.
Source: U.S. Census 1990, 2000; American Community Survey 2005–2009, 2010–2014, and 2015–2019.
Comparing the constants of the two models at the bottom of Table 3, we find an average LFP rate of 58% at arrival in Model 1, which increases to 77% after adjusting for human capital and family characteristics in Model 2. For European cohorts (the referent), the rate increases slightly every year during the medium term according to Model 2 (0.009 Column 4) and remains flat 10 years after migration (Column 6), reaching 85% after 10 years of U.S. residence. Differences in starting rates between European women and others in the gradual incorporation group are negligible, supporting the validity of the GBTM. There is also only moderate variation in medium-term growth across groups, and few differences in the long-term period. Overall, differences in socioeconomic characteristics, i.e. human capital and family composition, within the gradual group did little to alter the similarities in their LPF trajectories.
In contrast, controlling for socioeconomic characteristics reduced the disparities between European and Mexican women considerably, by 57% at arrival (reducing the coefficient from −0.144 to −0.061 in Columns 1 and 2, respectively) and by 51% in the medium-term growth rate (from −0.014 to −0.007 in Columns 3 and 4, respectively). The gap after 10 years between comparable European and Mexican women is reduced from 26 percentage points in Model 1 to only 12 percentage points in Model 2. Thus, compositional differences explain a relatively large share of differences between the gradual and delayed incorporation groups.
Accounting for individual characteristics also explained roughly 25% of the lower initial rates of LFP among the accelerated incorporation group relative to Europeans (26% for India (Columns 1 vs. 2); 22% for Korea, and 24% for other Asia). It also effectively reduced the difference in growth rates over the medium-term relative to European women (Columns 3 vs. 4). Similar explanatory power was evident among the intensive LFP group; the higher rate of LFP at arrival for Caribbean relative to European women is reduced from 0.118 (Column 1) to 0.076 (Column 2) and for Filipinas from 0.106 to 0.083, respectively.
The bottom part of Table 3 reports coefficients for the socioeconomic predictors of LFP for the three splines of years since migration. Consistent with our expectations, in several cases the effects vary over time. For example, compared to women with a high school education, those with a college degree were more likely — and those lacking a high school diploma were less likely — to be in the labor force in the years immediately after arrival. These educational disparities in LFP grew more pronounced over time, as the advantage of college educated women, and the disadvantage of the least educated women, expanded with increased U.S. experience. Likewise, women with some college increased LFP more rapidly than those who did not advance beyond high school. Thus, while European women with less than high school education could expect a LFP rate of 79% after 10 years in the United States, the rate would be 89% for those with some college. Moreover, accounting for human capital explained a sizeable share of the slow growth in LFP for less educated, delayed incorporation cohorts. Lacking English proficiency exerted a steadier influence on LFP over time, having a large negative effect on LFP (−0.077 in Column 4) that does not seem to diminish with time in the United States.
Likewise, the impact of family structure on immigrant women’s LFP varied over time. Both being married and having children under five are associated with lower LFP at arrival (−18% and − 20% in Column 2, respectively). However, these dampening effects attenuated somewhat with time in the United States, both during the medium and long term. In the medium term, for every year of U.S. residence (after the initial two) the LFP of married women and women with young children grew by 0.5% and 0.8%, and in later years by 0.2% and 0.3%, respectively.
The final step in the analysis is to examine the link between gendered characteristics and national/regional origin variation in immigrant women’s LFP. Table 4 reports summary results for models incorporating the four cohort-level gender characteristics. The models also control for national origin, age at arrival, period of arrival, and individual socioeconomic characteristics (full models not reported but available upon request). The top panel of Table 4 reports results from models estimated including one cohort-level variable at a time and then an integrated model, estimated with all four group-level variables. The integrated model should be interpreted with caution given the strong correlation between the share of men arriving with a college education, on the one hand, and the share of women with college education and the share of single at arrival, on the other. Table 4 reports overall effects, i.e., without interactions with the splines (Column 1), and the interaction effects (Columns 2, 3, and 4).
Coefficients for gendered cohort characteristics from linear probability models predicting immigrant women’s LFP.
p < 0.10.
p < 0.05.
Source: U.S. Census 1990, 2000; American Community Survey 2005–2009, 2010–2014, and 2015–2019.
The results in Column 1 of Table 4 document two salient group-level processes affecting LFP trajectories, namely the gender ratio and share of women single at arrival. They work in opposite directions. The gender ratio at arrival is negatively associated with immigrant women’s LFP (−0.017), while the opposite is the case for the share of women arriving single (0.042). These effects reflect gendered demand for immigrant labor. The interactions with the splines show that most of the effect of the gender ratio acts by reducing the medium-term growth rate (−0.012 Column 2), though the positive coefficient in the long term (Column 4) indicates that the impact of the gender ratio attenuates over time. The opposite holds for the impact of the share of women single at arrival, which may signal the extent to which migration is driven by women’s economic versus family considerations [18]. Results show that a higher representation of unmarried women at arrival is associated with an overall higher likelihood of women’s LFP (Column 1), net of individual-level characteristics, supporting the interpretation that women migrate in search of jobs within those flows. Although the association is negative at arrival (−0.121 Column 2), it is positive for the medium-term growth rate (0.027 in Column 3).
The effect of the share of co-ethnic women and men arriving with a college degree also varies by years since migration. The overall effect is negative for both of these variables at arrival (−0.164 and − 0.134 in Column 2, respectively), but the associations reverse during the medium-term years (0.023 and 0.013 in Column 3, respectively) and even off in later years. The integrated models (bottom panel of Table 4) show a similar pattern of effects, though the high correlation among these variables, as previously discussed, obscures their independent effects. Yet, the integrated models indicate a stronger effect for men’s than for women’s education at arrival. Cohorts with high representation of college educated men, like India, reflect the gendered nature of immigrant labor demand with a strong male preference. In these flows, women tend to follow their husbands and arrive with H1B dependent visas, which until 2015 prevented them from working, undermining women’s LFP at arrival [19]. However, since women in these flows also tend to be highly educated, the initial penalty dissipates rapidly during the medium term, and levels off over the longer term.
To help illustrate the different roles of socioeconomic background and gendered migration cohort characteristics, Table 5 reports the predicted probability of LFP for women arriving to the United States between 1990 and 1999 at the ages of 20 to 24. Model 1 presents the predicted probability of LFP with basic demographic controls (based on Table 3, Model 1). Model 2 shows the probabilities controlling for average socioeconomic characteristics, that is, individual human capital and family characteristics (based on Table 3, Model 2), and controlling for cohort gender characteristics (based on Table 4, integrated model with spline interactions). We present the probabilities at arrival, after 10 years, and 20 years since migration, respectively. As discussed in the multivariate results, socioeconomic composition explains a large portion of the differences in employment probabilities across national origin groups. If European women had the average socioeconomic composition of the whole immigrant sample their probability of employment after 20 years in the United States would decline from 76.8% (M1) to 70.6% (M2). The opposite applies to Mexican women, although the effect is larger at 10 years in the United States, consistent with the pattern of delayed incorporation. Mexican women would see their predicted probability of LFP after 10 years increase from 47% (M1) to 58% (M2) if they had the average socioeconomic characteristics of immigrant women, and to 59% (M3) if they had average gender cohort characteristics.
At arrival
10 Years
20 Years
M1
M2
M3
M1
M2
M3
M1
M2
M3
Gradual, moderate entry
Europe
59.1
56.4
63.1
70.8
68.6
66.8
76.8
70.6
69.7
Canada
62.4
58.2
67.6
68.9
66.1
64.0
75.7
68.7
66.8
Africa
58.2
58.0
60.8
74.0
73.2
72.6
80.8
74.1
73.0
China
55.8
54.8
64.9
73.6
73.3
71.0
78.2
73.9
71.7
Vietnam
57.5
60.9
60.3
70.3
76.6
74.4
77.5
79.0
77.2
Delayed, low entry
Mexico
44.7
50.3
43.9
46.7
57.8
59.0
57.7
64.4
64.9
Delayed, moderate entry
Central America
61.4
61.3
59.3
62.7
68.5
67.6
71.1
72.6
72.0
South America
59.4
57.6
61.2
68.6
68.7
66.5
75.8
71.5
70.3
Cuba
67.0
65.6
64.5
72.0
73.9
72.7
72.5
70.5
70.7
Accelerated, low entry
India
39.9
42.1
50.9
61.9
61.7
61.5
71.9
66.3
65.7
Korea
38.9
40.7
50.4
57.2
57.0
54.3
66.1
62.2
61.1
Other Asia
38.1
40.5
46.7
57.8
58.6
57.2
66.7
63.7
62.1
Intensive, high entry
Philippines
69.7
64.7
73.8
79.4
74.8
70.8
84.8
77.0
74.6
Caribbean
70.9
64.0
66.3
79.2
76.8
73.8
85.0
78.3
76.1
Table 5.
Predicted probabilities of being in the labor force with demographic controls (M1), human capital and family characteristics (M2), and gendered cohort characteristics (M3).
Note: Predicted probabilities for women arriving between 1990 and 1999 at age 20–24 at means based on the models presented on Tables 3 and 4.
In comparing the disparity between Europeans and Mexicans at 10 years after migration, European women exhibit 24 percentage points higher probability of LFP than Mexican women (M1), a difference that is decreased to 11 percentage points adjusting for individual socioeconomic characteristics (M2), and to 8 percentage points after controlling for gendered cohort characteristics (M3). That is, socioeconomic composition explains more than 55% of the disparity after 10 years, whereas 28% of the disparity between the two groups is attributable to gendered migration cohort characteristics.
An interesting pattern is evidenced for countries in the accelerated incorporation with low initial participation group, for whom adjusting for cohort gender characteristics increase their LFP at arrival. The effect is dominated by the high representation of educated men in Indian cohorts at arrival and women’s tendency to arrive married. For example, Indian women LFP rate at arrival would increase from 42% (M2) to 51% (M3) if they had average gender cohort characteristics. This finding suggests that a different gender context would increase Asian women’s LFP at arrival. Finally, the group with intensive employment, Filipinas and Caribbeans, would see their LFP rates decline over the medium and long term, if they were to have the average socioeconomic and gender cohort characteristics of all immigrant women.
The literature on immigrant assimilation has emphasized the heterogeneity in modes of incorporation, yet the limitations of traditional analyses of cross-sectional data have undermined our understanding of how these processes play out among immigrant women. In this chapter, we analyze the factors that shape the variation in labor force participation (LFP) trajectories for the 14 largest national/regional origin groups. We construct synthetic immigrant cohorts using U.S. Census and American Community Survey (ACS) data from 1990 to 2019, to track immigrant women’s LFP trajectories investigating national origin variation in LFP rates at entry, and growth rates in the medium, and long terms. We propose a five-group typology that synthesizes immigrant women’s national origin variation in patterns of labor market incorporation. We elaborate on the usefulness of the notion of the gendered context of reception for understanding different modes of assimilation.
Our analysis revealed that national origin variation in LFP trajectories clusters into five distinct patterns of workforce incorporation: (1) Gradual incorporation from moderate entry rates, typified by cohorts from Europe, Canada, Africa, China, and Vietnam; (2) Delayed incorporation with low initial participation, exemplified by Mexico, with low starting rates and slow growth rates; (3) Delayed incorporation with moderate entry rates, which characterizes cohorts from Central America, South America, and Cuba; (4) Accelerated incorporation with low entry rates, including India, Korea, and other Asian countries, with fast growth in the medium-term years; and (5) Continuous intensive LFP with high entry rates, which includes the Philippines and Caribbean countries. Despite this variation, the results show that most groups show evidence assimilation, increasing their rates of LFP in the years after migration.
Consistent with prior studies, controlling for individual socioeconomic characteristics, including educational attainment, English proficiency, and family characteristics, explains a large portion of LFP disparities across groups [6, 9, 10]. We contribute to the prior literature by showing that the effects of these individual-level characteristics vary by group and depend on whether we focus on the rates at arrival or change with time in the United States. We show that socioeconomic characteristics explain nearly half of the lower LFP at arrival among the groups with delayed incorporation, which includes Latin American countries, especially Mexico, relative to the gradual incorporation group, exemplified by Europe. They also explain a similar proportion of the slower rate of growth in LFP among the delayed incorporation group. Conversely, for the group with accelerated incorporation, including India, Korea, other Asian countries, around 25% of the lower entry level LFP at arrival relative to Europeans is explained by individual characteristics. For the accelerated group, the initial constraint stems not from lack of human capital, but the much higher propensity for women to arrive married. Moreover, accounting for individual-level characteristics, particularly education, explains a large part of their more rapid growth in LFP over time. A different pattern is found for the group with continuous intensive LFP. For this group, which includes cohorts from the Philippines and the Caribbean, socioeconomic controls reduced 22% and 36% of the higher LFP at arrival relative to Europeans, respectively, and for Caribbeans, explained their slower medium-term growth rate.
We found that educational attainment shapes LFP differently across periods of incorporation. While better educated women average higher LFP than their less educated counterparts, the differences are significantly smaller at arrival, and widen with longer durations of U.S. residence. Those with more than a high school education increase faster their rates of LFP over time, while the opposite is true of their less educated counterparts. These patterns highlight the difficulties faced by less educated immigrant flows, such as Mexicans, Central Americans, and some Asian groups, in finding work in the increasingly skill-oriented U.S. labor market. In contrast, the constraints on immigrant women’s LFP associated with family responsibilities, that is, being married and having children younger than age five in the household, significantly reduce LFP mainly at arrival. Married women and those with young children seem better able to combine work and family over time, as their LFP increases at a faster rate than other women with longer periods of U.S. residence.
Finally, we show that gendered migration cohort characteristics, namely the gender ratio at arrival, share of women arriving single, and share of women and men arriving with a college education, help explain an additional proportion of LFP gaps across groups. For example, the overrepresentation of men in migrant flows, such as the cases of Mexican and India, undermines immigrant women’s LFP rates, while the opposite holds for flows dominated by women, such as the Philippines. The link between these group-level characteristics and LFP changes over time. It is only after many years in the United States, i.e., more than 11, that women’s LFP in male-dominated migration streams begins to converge with those from more gender-balanced flows.
The share of immigrant women arriving single, in contrast, reflects the degree of female independence and labor demand driving women’s migration decisions. Results show that higher representations of single women in migration cohorts were associated with higher LFP, even net of individual-level characteristics. The share of women and men arriving with college education were associated with lower women’s LFP, with a stronger effect for the proportion of men with college education at arrival, an indicator of male privilege and male labor demand. While the aggregated effect on LFP was not significant, separating by length of U.S. residence showed that highly educated male flows, such as from India, were negatively associated with immigrant women’s LFP at arrival. Despite their initial disadvantage, these flows show more rapid increases in LFP over time. Taken together, national origin differences in these four gendered dimensions of migration flows help explain the gap in LFP that remains after controlling for individual-level characteristics.
Overall, this chapter shows the advantage of using a synthetic double-cohort approach and group-based trajectory modeling to summarize and understand the variation in the patterns of immigrants’ modes of incorporation. It also shows the importance of distinguishing LFP rates at arrival from growth rates in the medium and long term, and highlights the need to integrate the gender dimension in the concept of context of reception. This methodology also shows a more impressive and nuanced process of assimilation among immigrant women than that evinced in prior studies [4, 5, 10]. We argue that immigrant cohort gender characteristics at arrival can help us understand the variation in immigrant labor supply, providing important insights into the evolution of national-origin disparities in immigrant women’s LFP. Immigrant incorporation is shaped by not only by individual and family characteristics, but also by larger contextual forces, including cultural norms, government policies, and gendered labor demand.
Results also suggest the need for continued exploration of creative methodologies to capture the complexity of modes of immigrant assimilation. Future research should examine whether immigrant cohort effects largely follow national origin lines, as we suggest here, whether and how they are shaped by racial and ethnic lines, as well as by internal geographical patterns of settlement.
References
1.Rakotonarivo A. Who are the women on the move? A portrait of female migrant workers – ILOSTAT. International Labour Organisation ILO, ILOSTAT. 2020. Available from: https://ilostat.ilo.org/who-are-the-women-on-the-move-a-portrait-of-female-migrant-workers/ [Accessed 17 November 2022]
2.Carratala S, Svajlenka NP, Glynn SJ. A Profile of Immigrant Women in the Workforce – Center for American Progress. Center for American Progress (CAP). 2021. Available from: https://www.americanprogress.org/article/profile-immigrant-women-workforce/ [Accessed 17 November 2022]
3.Adserà A, Ferrer AM. The myth of immigrant women as secondary workers: Evidence from Canada. American Economic Review. 2014;104:360-364
4.Donato KM, Piya B, Jacobs A. The double disadvantage reconsidered: Gender, immigration, marital status, and global labor force participation in the 21st century. International Migration Review. 2014;48:S335-S376
5.Blau FD, Kahn LM, Papps KL. Gender, source country characteristics, and labor market assimilation among immigrants. Review of Economics and Statistics. 2011;93:43-58
6.Read JG, Cohen PN. One size fits all? Explaining U.S.-born and immigrant Women’s employment across 12 ethnic groups. Social Forces. 2007;85:1713-1731
7.Donato KM, Gabaccia D. Gender and International Migration. New York: Russell Sage Foundation; 2015
8.Lee T, Peri G, Viarengo M. The gender aspect of migrants’ assimilation in Europe. Labour Economics. 2022;78:102180
9.Florian S, Flippen C, Parrado E. The labor force trajectories of immigrant women in the United States: intersecting individual and gendered cohort characteristics. International Migration Review. 2023;57(1):95-127. DOI: 10.1177/01979183221076781
10.Schoeni RF. Labor market assimilation of immigrant women. Industrial and Labor Relations Review. 1998;51:483-504
11.Antecol H. An examination of cross-country differences in the gender gap in labor force participation rates. Labour Economics. 2000;7:409-426
12.Blau FD, Kahn LM. Substitution between individual and source country characteristics. Journal of Human Capital. 2015;9:439-482
13.Blau FD, Kahn LM, Comey M, et al. Culture and gender allocation of tasks: Source country characteristics and the division of non-market work among US immigrants. Review of Economics of the Household. 2020;18:907-958
14.Polavieja JG. Capturing culture: A new method to estimate exogenous cultural effects using migrant populations. American Sociological Review. 2015;80:166-191
15.Apgar L, McManus PA. Cultural persistence and labor force participation among partnered second-generation women in the United States. Social Forces. 2019;98:211-244
16.Wang S. The role of gender role attitudes and immigrant generation in ethnic minority Women’s labor force participation in Britain. Sex Roles. 2019:234-245
17.Feliciano C. Immigrant selectivity effects on health, labor market, and educational outcomes. Annual Review of Sociology. 2020;46:315-334
18.He Q , Gerber TP. Origin-country culture, migration sequencing, and female employment: Variations among immigrant women in the United States. International Migration Review. 2020;54:233-261
19.Banerjee P. Subversive self-employment: Intersectionality and self-employment among dependent visas holders in the United States. American Behavioral Scientist. 2019;63:186-207
20.Borjas GJ. Assimilation, changes in cohort quality, and the earnings of immigrants. Journal of Labor Economics. 1985;3:463-489
21.Flood S, King M, Rodgers R, et al. Integrated Public Use Microdata Series, Current Population Survey: Version 10.0 [Dataset]. Minneapolis, MN; 2022. DOI: 10.18128/D030.V10.0
22.Gordon MM. Assimilation in America: Theory and reality. Daedalus. 1961;90(2):263-285
23.Alba R, Nee V. Rethinking assimilation theory for a new era of immigration. International Migration Review. 1997;31:826-874
24.Portes A, Zhou M. The new 2nd-generation - segmented assimilation and its variants. Annals of the American Academy of Political and Social Science. 1993;530:74-96
25.Borjas GJ. The slowdown in the economic assimilation of immigrants: Aging and cohort effects revisited again. Journal of Human Capital. 2015;9:483-517
26.Baker M, Benjamin D. The role of the family in immigrants’ labor-market activity: An evaluation of alternative explanations. The American Economic Review. 1997;87:705-727
27.McManus PA, Apgar L. Parental origins, mixed unions, and the labor supply of second-generation women in the United States. Demography. 2019;56:49-73
28.Read JG. Cultural influences on immigrant Women’s labor force participation: The Arab-American case. International Migration Review. 2004;38:52-77
29.Portes A, Rumbaut R. Immigrant America: A Portrait. 4th ed. Irvine, CA: University of California Press; 2014
30.Flippen CA. Intersectionality at work: Determinants of labor supply among immigrant Latinas. Gender & Society. 2013;28:404-434
31.Flippen CA. Laboring underground: The employment patterns of Hispanic immigrant men in Durham, NC. Social Problems. 2012;59:21-42
32.Flippen CA, Parrado EA. A tale of two contexts: U.S. migration and the labor force trajectories of Mexican women. International Migration Review. 2015;49:232-259
33.Parrado EA, Flippen CA. Migration and gender among Mexican women. American Sociological Review. 2005;70:606-632
34.Hondagneu-Sotelo P. Gendered Transitions: Mexican Experiences of Immigration. Berkeley: University of California Press; 1994
35.USCI. H-1B Petitions by Gender and Country of Birth Fiscal Year 2018. Washington, D.C.; U.S. Citizenship and Immigration Service; 2018
36.Kofman E. Gendered global migrations. International Feminist Journal of Politics. 2004;6:643-665
37.Chiswick BR. The effect of Americanization on the earnings of foreign-born men. Journal of Political Economy. 1978;86:897-921
38.Myers D, Lee SW. Immigration cohorts and residential overcrowding in Southern California. Demography. 1996;33:51
39.Fuller S. Do pathways matter? Linking early immigrant employment sequences and later economic outcomes: Evidence from Canada. International Migration Review. 2015;49:355-405
40.Chiswick BR, Miller PW. The international transferability of immigrants’ human capital. Economics of Education Review. 2009;28:162-169
41.Fuller S, Martin TF. Predicting immigrant employment sequences in the first years of settlement. International Migration Review. 2012;46:138-190
42.Jones BL, Nagin DS. A note on a Stata plugin for estimating group-based trajectory models. Sociological Methods and Research. 2013;42:608-613
43.Jung T, Wickrama KAS. An introduction to latent class growth analysis and growth mixture Modeling. Social and Personality Psychology Compass. 2008;2:302-317
Written By
Sandra Florian, Chenoa Flippen and Emilio Parrado
Submitted: 25 January 2023Reviewed: 15 March 2023Published: 26 April 2023