Open Access is an initiative that aims to make scientific research freely available to all. To date our community has made over 100 million downloads. It’s based on principles of collaboration, unobstructed discovery, and, most importantly, scientific progression. As PhD students, we found it difficult to access the research we needed, so we decided to create a new Open Access publisher that levels the playing field for scientists across the world. How? By making research easy to access, and puts the academic needs of the researchers before the business interests of publishers.
We are a community of more than 103,000 authors and editors from 3,291 institutions spanning 160 countries, including Nobel Prize winners and some of the world’s most-cited researchers. Publishing on IntechOpen allows authors to earn citations and find new collaborators, meaning more people see your work not only from your own field of study, but from other related fields too.
The last half century has seen seismic transformations in the demographic outlook of many countries in sub-Saharan Africa, Asia, and Latin America. Because these transformations have coincided with equally profound economic change, they raise questions about the role of demographic change and its dividends in transforming the developing world. For instance, how much have the differences in onset, patterns, and management of fertility transitions fueled the growing economic divergence now seen across these regions? On the one hand, the four Asian Tigers reportedly leveraged their fertility transition to accelerate economic growth. On the other hand, a few countries in West Africa have yet to initiate their fertility transition, and the list of least-developed nations is increasingly restricted to African and high-fertility nations. In this chapter, we use new decomposition methods to estimate the dividends accrued by individual countries between 1970 and 2020 and to explore how these dividends contributed to the region’s economic growth and differentiation. The analysis begins by estimating the size of each country’s dividend; then, we consider factors that explain differences across national dividends. Finally, we estimate the percent contribution of this variation in dividends in explaining the cross-country variation in the economic outlook of this world region.
Department of Global Development, Cornell University, Ithaca, USA
Claude Mbarga
Institut de Formation et de Recherche Démographiques (IFORD), Yaounde, Cameroon
Michel Tenikue
Luxembourg Institute of Socio-Economic Research (LISER), Porte des Sciences, Esch-sur-Alzette, Luxembourg
Sarah Giroux*
Department of Global Development, Cornell University, Ithaca, USA
*Address all correspondence to: sh104@cornell.edu
1. Introduction
Over the past fifty years, remarkable demographic transformations have occurred in the global south. These coincided with major economic shifts, prompting inquiries into the role of demographic transitions in reshaping the developing world.
Historically, research on the consequences of demographic change for development initially centered on the relationship between population size and economic progress [1].
In 2003, however, Bloom, Canning, and Sevilla introduced a new perspective focused instead on the role of age structure and the so-called demographic dividend. As birth rates decrease (and before life expectancy increases), countries experience a temporary period of low age dependency, which promotes savings, investment, and economic growth. This dividend argument has gained considerable traction in both academic and policy circles over the past two decades. In research, the number of articles examining dividends on JSTOR rose from 9 in 2002 to 1094 in 2022. In the policy world, a growing number of nation-states have developed “road maps” to harness the demographic dividend [2], and the African Union named 2017 as the year of “Harnessing the Demographic Dividend…” [3]. However, the concept remains contentious for several reasons.
First, there are questions about whether the demographic dividend is a genuinely novel argument or merely a variation on the standard population growth and development perspective. Is the relationship between age structure and development fundamentally different from the links between total population growth and development? Second, it is challenging to measure the dividend in a compelling way that allows for historical analysis and cross-country comparison. Standard methods (NTA accounting, simulation, DemProj) tend to be data-intensive and more suitable for simulating future scenarios than accounting for past changes. Third, it remains to be seen whether the magnitude of dividends will be similar across all world regions. Current discussions of demographic dividends draw heavily upon data from East Asian countries between 1960 and 2000. In contrast, data from Latin America during the same period indicates that the benefits from demographic transitions did not yield the same level of economic advantages as those observed in East Asia [4].
This paper presents a novel decomposition method that can help address the questions above. Using this method, we examine the magnitude of demographic dividends across the global south over the past 50 years, explore the factors associated with the emergence of these dividends, and assess the extent to which patterns of dividend formation are similar or different across world regions.
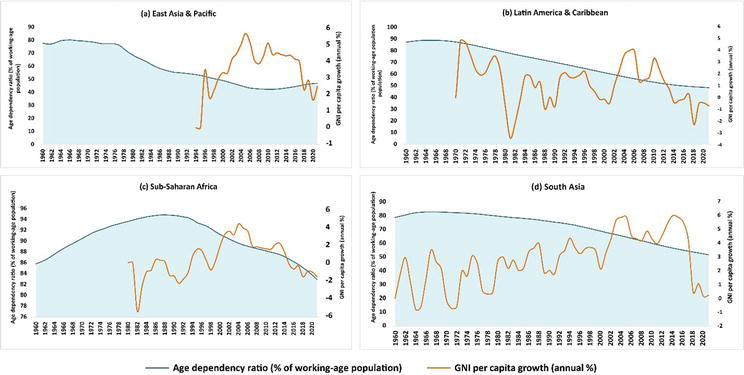
Between 1970 and 2020, the world’s population nearly doubled, increasing from 3.7 billion to 7.8 billion. GNI per capita rose from $802 in 1970 to $11,040 in 2020, increasing 13-fold during this half-century [5]. However, this increase was accompanied by growing income inequalities between countries and regions, particularly in Latin America and the Caribbean, sub-Saharan Africa, and East and South Asia.1Figure 1 highlights this variation, showing the 3-year-average annual GNI per capital Growth Rate over the past 50 years. It also highlights the wide regional variation in the pace of demographic change, as seen in the varying trends in age dependency ratios.
Figure 1.
Demographic and economic evolution in global South between 1960 and 2020. Source: Authors with WDI database.
2.2 Latin America and Caribbean
The socio-demographic landscape of Latin America and the Caribbean has evolved significantly since the 1490s when Europeans first arrived. In the 19th century, migration flows and declining mortality rates triggered a population surge. During the latter half of the 20th century, the total fertility rate (TFR) fell from 5.2 to 1.9, causing the annual population growth rate to decline from 2.5% to 0.8% [6]. Figure 1b, utilizing WDI 2022 data from 1970 to 2020, confirms this fertility decline and highlights a reduction in demographic dependency from 88% to 49%. These statistics indicate that the region initiated its demographic transition phase and began to benefit from the demographic dividend after 1980, when the dependency ratio fell below 80%.
Paradoxically, GNI per capita growth in the region fell during this time, mainly due to the 1980s debt crisis, which disrupted Western foreign investments and increased poverty and unemployment. Social inequalities, especially among vulnerable groups like the indigent and Afro-descendants, intensified. Additional factors, such as low education levels and urbanization rates, also hindered growth. Despite a reduced dependency ratio (from 71% to 49% between 1990 and 2020), the region failed to effectively harness the demographic dividend during this period [7, 8, 9]. While GNI tripled from $5969 to $15,243 between 1990 and 2020, it remained slightly below the global average.
2.3 Sub-Saharan Africa
Sub-Saharan Africa exhibits the world’s highest population growth, with a total fertility rate (TFR) of 4.7 children per woman in 2020, double the global average. The region’s population growth rate remained stable from 1970 to 2020, hovering between 2.68% and 2.65% [5]. Age dependency ratios consistently ranked highest, starting at 90% in 1970 and declining to 84% in 2020, peaking at 96% in 1988 (Figure 1d). Even today, Sub-Saharan Africa has yet to reach the critical threshold of 80% for the demographic dividend [5, 10, 11].
Despite this unfavorable population structure, the region has seen a gradual but modest increase in gross national income (GNI) per capita, with an average annual growth rate of 0.38%. Between 1990 and 2020 (Figure 1d), GNI per capita grew sevenfold, from $201 to $1500. Numerous studies [10, 11, 12, 13, 14, 15, 16, 17, 18] underscore the persistent challenges facing the region, including demographic factors, governance issues, limited educational expansion, low levels of women’s empowerment, and unique cultural constraints.
2.4 East and South Asia
South and East Asia, home to 23 countries and the world’s most populous region, offer compelling examples of economies that achieved significant demographic dividends. The population surged from 1.74 billion in 1970 to 3.63 billion in 2020, representing 46.33% of the global population [2]. Over three decades, the region experienced extraordinary economic progress and generated substantial wealth.
Figure 1a and c shows the economic and demographic evolution of East Asia & Pacific and South Asia from 1960 to 2020. The data reveal three significant trends in East Asia’s population growth: an initial increase from 0.17% to 2.34% (1960–1964), a slight rise from 2.3% to 2.6% (1964–1970), and a gradual decline from 2.6% to 0.4% (1970–2020).
This population change led to a demographic transition characterized by a continuous decrease in demographic dependency (from 79% to 47%), well below the 80% threshold required for capturing the demographic dividend (Figure 1a). East Asia entered its window of opportunity for a demographic dividend before 1970, propelling substantial economic growth, with an average annual GNI per capita growth rate (in constant $) of approximately 4% between 1970 and 2020, peaking at 6.9% in 2007 and 6.3% in 2010. By 2020, absolute GNI per capita had risen from $306 to $11,652, marking a 38-fold increase [5].
South Asia mirrors East Asia’s pattern, with a population growth rate declining from 2.31% to 1.02% (1970–2020), slightly higher than East Asia’s rate in 2020 [5]. Concurrently, the demographic dependency ratio fell from 82.66% to 51.66% (Figure 1c). These trends indicate that South Asia entered its demographic dividend window in the 1970s. The GNI per capita growth rate also increased significantly, with GNI per capita rising approximately sixteen-fold, from $118 to $1879.
2.5 A new argument
In 2003, Bloom, Canning, and Sevilla argued that high-fertility countries face development barriers because the working-age population’s earnings are siphoned into supporting a large number of dependents, rather than being saved or invested in ways that would boost economic growth. However, as countries undergo their demographic transitions, fertility decline creates a “window of opportunity” where the share of the working-age population (ages 15–64) is larger than the non-working-age share of the population (ages 0–14 and 65 and older). A country with a large and productive working-age population and a low dependency (or support) ratio is better positioned to spur economic growth and raise living standards. According to Bloom et al. [19], the change in age structure leads to a rise in per capita savings, which they refer to as an accounting effect, or a “mechanical” dividend. They also expected a behavioral effect, stemming from a rise in female labor participation and increased spending on children’s schooling [19].
To harness a dividend, fertility declines are a necessary, but not sufficient, condition. The country must additionally have, or build, the essential infrastructure and policies to put its growing workforce to work, such as investing in education and training, improving access to healthcare, and creating an enabling environment for entrepreneurship and job creation [20, 21]. At best, countries can miss the window of opportunity if they do not grow their economies before facing the eventual rise in age dependency stemming from older dependents. At worst, a large, inadequately educated and trained young population can lead to high levels of unemployment and social unrest [22].
Dividend theory thus refocused the population-development debate from its earlier emphasis on population size and high fertility to a focus on age structure. This aspect of demographic change is both theoretically interesting and empirically dynamic. While a country’s total population remains relatively stable over time, age structures can shift rapidly depending on the pace of the country’s demographic transition.
Yet this thesis is beset by a lack of firm consensus on the evidence, notably whether the dividend is automatic, large, and how it might depend on contextual conditions [23, 24, 25].2 Disparate findings sow theoretical confusion and muddle policy advice to countries hoping to bank on their fertility transitions. A consistent application of robust methodology across various countries and historical periods would foster a better sense of the magnitude and contextual variation in dividends.
2.6 Empirical approaches
Scholars have used a range of alternative approaches to estimating the size of dividends, including simulation, DemDiv Model [26], National Transfer Accounting [27, 28], and regression and decomposition-based models [12].
2.6.1 Simulations
Various simulation models have examined the relationship between population trends and the economy. These models typically investigate how demographic changes influence the economy, using equations based on economic theories and real-world data. For example, studies by Ashraf et al. [29] and Karra et al. [30] explore how decreasing birth rates affect economic growth. Although these models are transparent in their calculations, they can be challenging to use for non-experts and they require large amounts of data [26].
2.6.2 DemDiv model
The DemDiv model is the most widely and popular used approach for making projections or macro-demographics simulations. It is easy to use and based on widely available data for most countries. It consists of projecting the economic consequences for a country based on population projections and the assumed links between demographic and economic variables. The first draws from the projection work of the United Nations. The latter comes from scientific research on these links [31]. The DemDiv model comprises a demographic and economic sub-model [31, 32].
2.6.3 National Transfer Accounts
Another approach for estimating the size of the dividend, the National Transfer Account approach, was developed by Mason and Lee [33]. This method leverages detailed data on earnings, consumption, savings, and economic transfers to build a detailed country profile of the age-specific pattern of economic behavior [34, 35]. With these profiles (and the assumption that these behaviors hold relatively stable), one can gauge how aggregate national outcomes would change as the country’s age structure evolves. The wealth and detail on age-specific economic behavior make it possible to examine multiple questions about population-economic relations, including the size of dividends [27, 28].
The NTA approach usefully eschews the narrow assumptions of a universal definition of age structure. Unfortunately, it is highly data-intensive [26]. Not surprisingly, NTA data is not universally available. For instance, files are only available for 21 of sub-Saharan Africa’s 46 countries and cover a short historical period. As such, they cannot support detailed cross-country comparisons, even if one ignores the high variability in data quality across countries.
2.6.4 Regression & demographic decomposition
Dividends are also studied with regression and decomposition-based modeling. This method uses historical time series data to establish statistical relationships between key demographic and economic variables. Researchers have widely employed the regression approach to construct detailed explanations of relationships among key variables [36, 37, 38, 39]. The decomposition approach is particularly valuable for assessing the contributions of different key components to economic growth. For instance, using data from 105 countries spanning the 1980–2005 period, Crespo Cuaresma et al. [40], show that changes in educational attainment levels, rather than age structure alone, primarily contributed to the demographic dividend effects.
We use data from the World Development database on population size, TFR, labor force participation rate, age structure, and gross national income (GNI) from 1970 to 2020 [5]. For comparative purposes, we use the Atlas purchasing power parity (PPP) values of the GNI to address changing exchange rates.3 The data is available for 121 countries, with 44 in Asia, 52 in Latin America, and 25 in Africa over the five-decade period (605 data points in total).
3.2 Methods
We use a decomposition approach to show how the change in the country’s GNI trends reflects changes in productivity, employment, and age dependency. This accounting uses a mathematical transformation that expresses GNI per capita as a product of four conceptually meaningful factors, as follows:
GNIpercapita=(Productivity)∗(Employment)∗(Labor Force Participation)∗AgeStructureE1
The is obtained by successively expressing the GNI per capita as:
GNIP=GNIA∗AP=GNIL∗LA∗AP=GNIE∗EL∗LA∗APE2
Where GNI is the Gross National Income; E is the population employed out of the total labor force (L); A is the working-age population, and P is the total population.
where barred values represent averages, and Δ marks a change between two time periods. For instance, when studying change in x between 1980 and 1990,
x¯=x1980)+x1990)/2andΔx=x1990−x198.E4
Using the expression above, any historical change in GNI per capita (y = GNI/P) can be traced to changes in these four components, including the mechanical influence of age structure (s = A/P) and the other components represent changes in theoretically important growth factors, including productivity (p = GNI/E), rate of employment(q = E/L), and labor force participation (r = L/A). Importantly, demographic dividend theory expects national changes in age structure to affect these drivers through savings and investment in economic development. A decomposition analysis thus helps identify and compare which of these components made the largest contribution to economic growth.
We use the decomposition methods above to estimate the size of each country’s dividends. We then use these results in an Ordinary Least Squares (OLS) regression model to better understand the contextual factors shaping the magnitude of dividends across place and time.
We used the decomposition method described above to compute, for each decade from 1970 to 2020, how much a country’s change in GNI per capita (y = GNI/P) was driven by changes in productivity (p), the employment rate (q), labor force participation (r) and age structure (s).
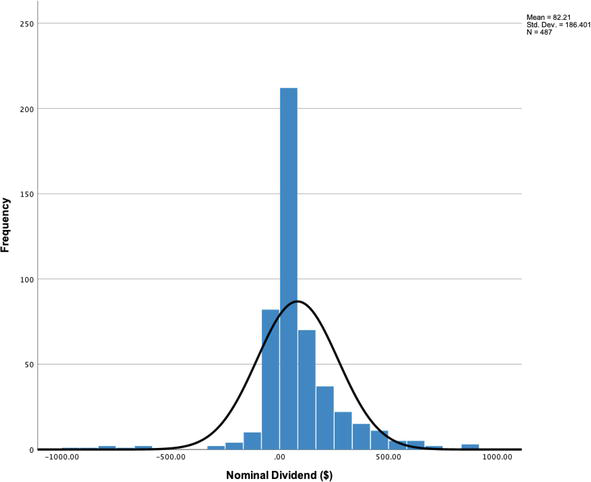
Figure 2 displays the results from the decomposition analysis, focusing on the role of age structure changes in the economic gains registered over each country period. The mean gain accrued by changes in age structure, which we refer to as the “nominal dividend,” was $82, with a slightly lower median of $37. Given that the median gain in GNI over each decade period was $396, it appears that, on the whole, the influence of age structure was small but still important. Not surprisingly, the influence of age structure varied significantly over time and across regions, as described in Table 1.
Figure 2.
Size of dividends across the Global South, 1970–2020.
1970–1980
1980–1990
1990–2000
Nominal change in GNI/Capita $
% change in GNI/Capita
% dividend
Nominal dividend
Nominal change in GNI/Capita $
% change in GNI/Capita
% dividend
Nominal dividend
Nominal change in GNI/Capita $
% change in GNI/Capita
% dividend
Nominal dividend
Asia
Mean
$2216
380%
4.0%
$51
$983
45%
9.4%
$143
$1121
134%
11%
$143
Median
$538
243%
2.4%
$20
$112
35%
5.0%
$62
$423
43%
8%
$37
N
17
17
17
22
22
22
36
36
35
36
Latin America
Mean
$1396
206%
3.9%
$93
$276
7%
3.7%
$108
$2125
89%
2%
$139
Median
$1424
207%
5.8%
$81
$32
2%
−2.2%
$69
$1348
81%
7%
$81
N
22
22
22
24
19
24
24
24
24
24
Africa
Mean
$424
212%
0.4%
-$29
$133
5%
−6.3%
$18
$79
2%
2%
$42
Median
$271
215%
−1.8%
-$6
$12
2%
−0.5%
$1
-$42
−15%
−1%
$17
N
34
34
34
34
42
42
39
42
45
45
42
44
2000–2010
2010–2020
Nominal Change in GNI/Capita $
% Change in GNI/Capita
% Dividend
Nominal Dividend
Nominal Change in GNI/Capita $
% Change in GNI/Capita
% Dividend
Nominal Dividend
Asia
Mean
$2626
193%
7%
$180
$857
32%
−1%
$41
Median
$2605
143%
8%
$113
$756
22%
−5%
$58
N
43
43
42
34
44
44
41
39
Latin America
Mean
$3274
111%
12%
$252
$1113
24%
4%
$70
Median
$2644
99%
7%
$212
$599
23%
3%
$159
N
25
25
25
25
24
24
21
23
AFRICA
Mean
$1504
176%
5%
$79
-$189
15%
2%
$34
Median
$629
119%
3%
$18
$94
8%
5%
$30
N
50
50
50
49
50
50
45
52
% Dividend = Percentage of Age Structure’s Contribution to Dividend.
Nominal Dividend= Nominal dollars gained from change in age structure.
Table 1.
Regional growth and economic dividends, 1970–2020.
4.2 Historical variation
Table 1 summarizes the historical evolution in the magnitude of dividends in the 1970–1980, 1980–1990, 1990–2000, 2000–2010, and 2010–2020 decades.
4.2.1 1970–1980
Between 1970 and 1980, Latin America, Asia, and Africa experienced rapid economic growth, with median growth rates exceeding 200% in all regions. A significant driver of this growth was the surge in commodity prices and export revenues, driven by strong demand and high prices for oil, minerals, agricultural products, and manufactured goods in the global market. These increased export earnings enabled these regions to finance development plans, invest in infrastructure, and expand their industrial sectors [41].
The Median GNI gains ranged from $271 in Africa to $538 in Asia, reaching $1424 in Latin America (Table 1). The role of age structure and the demographic dividend in driving these changes varied across regions. Age structure contributed 2% in Asia, 6% in Latin America and the Caribbean, but had a negative contribution of −2% in sub-Saharan Africa. The poor performance of sub-Saharan Africa can be attributed to its high and rising age dependency (Figure 1), in contrast to the other developing regions.
Sub-Saharan Africa’s poor performance can be partially understood within the context of the population policies pursued by African states during the post-colonial era, which aimed to encourage population growth due to cultural and social factors favoring larger families [42]. At the time, Africa was considered underpopulated, and the prevailing doctrine promoted population growth, sustaining high fertility rates. This perspective hindered the endorsement of population programs emerging from the initial International Conference on Population and Development in Bucharest in 1974.
In conclusion, from 1970 to 1980, Africa witnessed substantial variations in GNI per capita growth across regions. Sub-Saharan Africa’s underperformance can be partially attributed to its population policies and the subsequent high and growing age dependency. These findings underscore the complex interplay between demographic factors and economic development, emphasizing the importance of considering regional context in understanding these dynamics.
4.2.2 1980–1990
During this decade, there was a notable slowdown in economic growth, a phenomenon extensively addressed in the literature. East and South Asia experienced a modest 35% increase, while sub-Saharan Africa and Latin America saw growth rates of just 2%. Several factors contributed to this deceleration. First, the debt crisis in many developing countries hindered their ability to invest in productive sectors, leading to austerity measures and structural adjustment programs imposed by international financial institutions. This resulted in reduced government spending, increased unemployment, and slowed economic activity [43]. Second, declining commodity prices, a significant source of export earnings, had a detrimental impact on these region’s economies [44, 45]. Third, political instability, conflicts, and civil wars in various countries disrupted economic activities and discouraged investment. Furthermore, limited technological advancements and access to capital and markets broke economic growth. Collectively, these interconnected factors created an unfavorable environment for sustained economic progress, resulting in diminished growth rates across Asia, Africa, and Latin America during the 1980–1990 period.
However, the impact of significant demographic changes during this period is also evident. The demographic dividend contributed positively to economic growth, primarily in Asia, with a mean and median percent dividend of 9.4% and 5%, respectively. This is largely attributed to the rapidly improving dependency ratios resulting from the population policies aimed at reducing fertility rates across the region. Interventions included contraception access, incentives and disincentives for family size, raising the legal age of marriage, and enhancing female education and empowerment. The impact of these policies varied across countries and regions, depending on factors such as the initial fertility level, policy implementation, and cultural and religious context. For example, China’s “One-Child Policy” in 1979 strictly limited family size through a combination of incentives and penalties [46]. India’s National Family Welfare Program in the 1960s emphasized voluntary family planning and reproductive health services, including campaigns promoting contraception and the establishment of family planning clinics [47]. Similarly, Thailand’s “Contraceptive Revolution” in the 1970s featured a comprehensive family planning program, with free or subsidized contraceptives, education, and expanded access to reproductive health services [48].
In Latin America, demographic dividend contributions were smaller, with a mean positive dividend of 3.7% but a negative median value of −2.2%. This reflects varying fertility trends across the region, with some countries lagging in fertility declines while others were taking action based on the 1974 World Population Plan of Action. The 1984 ICPD in Mexico increased Latin American and Caribbean countries’ awareness of fertility’s economic impact. Governments in the region began pursuing family planning programs, population education, and women’s rights promotion [6, 9, 49, 50].
In sub-Saharan Africa, high dependency ratios (Figure 1) led to a mean and median dividend of −6.3% and −0.5%, respectively. During the 1980s, the region experienced persistently high fertility rates alongside limited investments in contraception stemming from cultural norms and the absence of robust population policies. African cultural and social structures favored large families during this time, influencing the desire for high fertility rates. Moreover, inadequate infrastructure and limited availability of contraceptives posed challenges to accessing family planning methods [42]. Insufficient investments in reproductive health and family planning programs further hindered progress in reducing fertility rates.
4.2.3 1990–2000
In the 1990s, Asia and Latin America experienced rapid growth, with median gains in GNI per capita of 43% and 81%, respectively. In contrast, Africa faced a significant economic downturn, with a mean decline in GNI per capita of 15%. This decline stemmed from multiple factors. Political instability, including civil wars, ethnic conflicts, and military coups, disrupted economies, destroyed infrastructures, and deterred investment [51, 52]. Some countries struggled due to poor economic policies, such as excessive state control of key sectors, overvalued currencies, heavy reliance on single commodities for exports, and neglect of agriculture [53]. The high debt burden carried by many African nations redirected national budgets toward debt servicing rather than investment or social spending [54].
Additionally, some countries implemented Structural Adjustment Programs, which, though aimed at reducing fiscal imbalances, often led to short-term economic hardship and hindered long-term growth due to social spending cuts [55]. The lack of economic diversification was another challenge, with many African economies heavily reliant on commodities, exposing them to volatile international market prices [56]. Lastly, the HIV/AIDS pandemic in this period had severe social and economic impacts on many African countries, including reduced life expectancy, productivity, and overall economic growth [57].
Favorable demographic conditions yielded significant demographic dividends across Asia and Latin America, with median dividends of 8% and 7%, respectively, in this decade. The 1990s witnessed substantial declines in fertility rates in many countries in these regions. Brazil stands out in Latin America, with its fertility rate plummeting from 6.3 children per woman in the 1960s to an average of 2.3 by the late ‘90s. This transformation resulted from robust government-sponsored family planning initiatives and increased women’s education levels [58].
In Asia, Iran experienced a similarly dramatic shift in fertility trends. The fertility rate dropped from an average of 7 children per woman in 1980 to below the replacement level—about 2.0—by the late 90s. This rapid demographic transition was driven by a nationwide family planning program and improved access to education and employment for women [59].
While Africa faced challenging economic conditions during this period, its demographic outlook was less grim. The median dividend was −2%, meaning that GNI losses would have been 2% greater without improvements in age structure. Many Sub-Saharan African countries began experiencing notable fertility declines in the 1990s. Ghana, for instance, saw its fertility rates drop from around 6.4 children per woman in 1988 to 4.2 by 2000, driven by efforts to expand access to family planning services, increase women’s education, and gradual urbanization [60]. Rwanda witnessed one of the most rapid fertility declines in the region, with fertility rates declining from approximately 8.2 children per woman in the early 1980s to 4.6 in 2000, thanks to a robust national family planning program and strides in women’s education [61].
Yet the demographic picture throughout the region remained varied during this period. During the 1990s, the patterns of fertility transitions across African nations varied significantly, with some countries even observing fertility stalls and reversals, such as in the case of Niger and Mali, where TFR remained about 6 [62]. More dramatically, fertility reversals were observed in some countries, where fertility rates began rising again after an initial decrease, largely due to persisting cultural norms favoring larger families, inadequate access to family planning services, and obstacles in women’s education and economic opportunities [63].
4.2.4 2000–2010
The 2000s saw continued growth within Asia and Latin America (with median gains in GNI of 143% and 99%, respectively). However, what stood out during this decade was Africa’s remarkable economic emergence, with a staggering median GNI per capita increase of 119%. This growth was propelled by a surge in commodity prices driven by global demand, particularly from rapidly developing countries like China, which significantly boosted Africa’s export revenue [64]. Economic reforms at the national level, including trade liberalization and market deregulation, further accelerated growth by creating a more favorable environment for business and investment [56]. Additionally, the expansion of telecommunications and the booming mobile phone market played a transformative role in driving economic development across the continent [65].
Moreover, Table 1 underscores the significance of demographic dividends during this period across regions, with mean dividends ranging from 8% in Asia to 7% in Latin America to 3% in Africa. The period was marked by significant global progress in promoting family planning [42], which appeared to contribute to the improvements in age structure observed, especially throughout sub-Saharan Africa. Kenya, for instance, experienced a significant decline in TFR, dropping from 4.9 children per woman in 2000 to 3.9 by 2010, largely due to concerted efforts to expand access to family planning services and education for women [66]. Similarly, in Ethiopia, a robust nationwide family planning program and increased focus on female education resulted in a TFR decrease from 5.9 in 2000 to 4.8 children per woman by 2010 [67]. These instances underscore the impact of dedicated national initiatives and policy changes on fertility transitions.
4.2.5 2010–2020
From 2010 to 2020, economic growth slowed compared to the 2000s, and regions showed similar patterns, with mean GNI gains of 32% in Asia, 24% in Latin America, and 15% in Africa. As the median gains are lower, the growth was concentrated in a few leading countries. Given its significant role as a trading partner and the global demand for commodities, China’s economic deceleration had widespread implications [68]. Reduced commodity prices, resulting from the worldwide slowdown, affected resource-rich countries across these regions heavily reliant on commodity exports [69]. Furthermore, political instability, corruption, and governance issues affected economic performance, notably in Latin America and Africa [70]. Conflict and political turmoil stifled economic growth and led to contractions in some countries [69]. Lastly, sluggish productivity growth and weak investment contributed to a slowdown in Asia, particularly in countries that had previously experienced rapid growth, such as India and Indonesia [71].
The role of dividends during this period is especially interesting. Africa had slightly lower median dividends (2%), primarily due to stalls in their fertility decline. For instance, Kenya’s TFR remained around 3.9 children per woman from 2010 to 2014, attributed to reduced contraceptive use and changes in marriage patterns [61]. Nigeria also experienced a similar pattern, with the TFR stagnating at about 5.5 children per woman over the same period due to persistent cultural norms favoring large families, and barriers to family planning services [72]. Dividends were smaller in Latin America, where fertility declined from 2.2 to 1.9, and have now turned negative in Asia, where TFR fell from 2.8 to 2.2 in South Asia and 1.9 to 1.5 in East Asia and the Pacific. These smaller and negative dividends stem from the challenges now emerging in many countries of this region.
4.3 Drivers of dividends
While the analysis above suggests the role of dividends in shaping economic growth, we also wanted to consider factors that explain variation in the size of national dividends. For this, we conducted a regression (shown in Table 2) examining how the size of dividends had varied over time, across regions, and through the stages of the demographic and economic transition.
Model 1: region
Model 2: region, demographic transition
Model 3: region, demographic transition, economic condition
Model 4: region, demographic transition, economic condition, historical period
Association between contextual factors and size of demographic dividends 1970–2020.
p < 0.1.
p < 0.05.
p < 0.01.
First, we ask the frequently posed question, “Is Africa Different”? Scholars of Africa’s fertility transition have found it to have a tendency to begin later and from a lower threshold of development. Cross-national analyses on the correlates of fertility declines confirm a net “Africa effect” even after adjustment for other development variables such as GDP per capita, education, life expectancy, and urbanization [73]. In terms of dividends, past studies found no reason to preclude a dividend in Africa, and others found early signs or even larger dividends than initially expected. The current thinking is to view African dividends as neither precluded nor inevitable but, as elsewhere, contingent on policy [4, 14, 22, 38, 74, 75].
Model 1, in Table 1, presents our findings on regional differences in dividends. Here, we do find evidence of an “Africa” effect. The binary relationship between regions and dividends suggests that countries in Asia and Latin America reap greater benefits compared to those in Africa. Latin America receives the largest sum, which implies that it benefits $101.6 more on average from demographic dividends than African countries.
Model 2 controls for TFR values to account for the stages of demographic transition. In this model, the coefficients for both Asia and Latin America reduced to 53.9 yet remained statistically significant. As we introduced indicators for Gross National Income (GNI) and period effect in Models 3 and 4, the magnitude and significance level of the coefficient for Asia stayed constant. This signifies that Asia, on average, gains over $50 more from demographic dividends compared to Africa. Conversely, the coefficient’s magnitude and significance level declined for Latin America. Our final model shows no statistically significant difference between Latin America and Africa.
In our analysis, we subdivided the TFR level into four categories that represent the four stages of the demographic transition: pre-transition (TFR above 6), early-transition (TFR between 6 and 4), mid-transition (TFR between 4 and 2), and post-transition (TFR below 2). The coefficients of TFR indicate a curvilinear relationship between demographic dividends and TFR. That is to say, the benefits of demographic dividends increase as countries begin to witness a decline in TFR, peak when countries reach the mid-transition stage, and decrease to a negative value for post-transition countries whose TFR falls below the replacement level. This pattern remains consistent in our subsequent models when controlling economic conditions and period effects. However, the variations in magnitude and significance level suggest that the boundary between the mid-transition and post-transition stages, or the replacement level, is a more precise cutoff.
In the final model, compared to the pre-transition group, the post-transition group incurs an average loss of $132.6, significant at the 0.01 level. The mid-transition group, on the other hand, gains an average of $51.6, significant at the 0.1 level, and the early-transition group shows no significant difference compared to the pre-transition group. These findings add insights to demographic transition theory and provide quantitative cutoffs that facilitate a more comprehensive understanding of the different stages of demographic transition.
Lastly, the regression reveals a statistically significant result for economic conditions, suggesting that countries with more robust economic conditions can profit more from demographic dividends. When the period effect is controlled, only the decades 2000–2010 and 2010–2020 show a statistically significant difference compared to the decade from 1970 to 1980. The findings suggest that countries benefited by an average of $60.2 from the dividends during the decade from 2000 to 2010 and lost an average of $86.4 from the dividends during the decade from 2010 to 2020. This suggests that factors beyond regional differences, TFR transition, and economic conditions can also impact the effect of demographic dividends.
The past half-century of demographic transitions throughout Africa, Asia, and Latin America have raised important questions about how these changes would shape the economic trajectories between and within regions of the Global South. A quarter-century ago, Bloom et al. [4] argued that the key demographic factor determining this transition would not be population size or fertility rates alone. Instead, they proposed a “new” argument focusing on the role of age structure. With another quarter century of robust data and a novel decomposition method, we confirm the net effects of age structure over and beyond fertility decline.
Using decomposition methods to examine World Bank data from the past half century, we find that a decline in age dependency can significantly boost economic growth, providing new empirical evidence for demographic dividend theory. Yet, this boost is complex and contextually variable. We find a clear pattern or dividend formation that unfolds across the fertility transition. Compared to the pre-transition countries (TFR above 6), mid-transition countries (TFR between 2 and 4) gain the most from their age structure. The post-transition countries (TFR below two or replacement level), on the other hand, suffer a substantive loss from their age structure, indicating the emerging problem of population aging.
We also confirmed that the demographic dividends are experienced unevenly across different geographic regions. At the bivariate level, Africa seems to harness statistically smaller dividends than Latin America and Asia. However, controlling for economic conditions, historical periods, and stages in the demographic transition, Africa is not truly different from Latin America. Asia, on the other hand, remains the leading example of a region where countries have capitalized on their dividends. These findings could indicate an increased inequality within the Global South countries, with sub-Saharan countries left behind. Nevertheless, given that many African countries are still at the earlier stages of the transition, this gives hope that by identifying effective policies, these countries will be able to better leverage their “windows of opportunity” and expand their economies.
References
1.Malthus T. An essay on the principle of population. J. Johnson, in St. Paul’s Church-Yard. 1798
2.UNDESA. World Population Prospects. United Nations Department of Economic and Social Affairs, Population Division, Custom Data Acquired Via Website. 2022. Available from: https://population.un.org/wpp/DataQuery/
3.African Union. 28th AU Summit. African Union. 2017. Available from: https://au.int/en/summit/28
4.Bloom D, Canning D, Sevilla J. The Demographic Dividend: A New Perspective on the Economic Consequences of Population Change. Santa Monica, CA: Rand Corporation; 2003. Available from: https://books.google.com/books?hl=en&lr=&id=36rNSRG4r7YC&oi=fnd&pg=PR3&dq=demographic+dividend&ots=6Ljka8N3fY&sig=M_dV2ZFcGAK-kit2ZJiidnnK8X0
5.World Development Indicators. World Development Indicators | DataBank. World Bank: World Development Indicators Databank. 2023. Available from: https://databank.worldbank.org/source/world-development-indicators [Accessed May 19, 2023]
6.de Cosio MEZ. Changements de fécondité au Mexique et politiques de population. Paris, France: L’Harmattan; 1994
7.Prebisch R. The Latin American periphery in the global system of capitalism. Revista CEPAL, Naciones Unidas Comisión Económica para América Latina y el Caribe (CEPAL), April. 1981
8.CEPAL, E. C. for L. A. and the. Estudio Económico de América Latina y el Caribe 1991 = Economic Survey of Latin America and the Caribbean 1991. Economic Commission for Latin America and the Caribbean. 1992. Available from: https://www.cepal.org/en/publications/1030-estudio-economico-america-latina-caribe-1991-economic-survey-latin-america-and
9.de Cosio MEZ. Démographie, pauvreté et inégalités. 2011; 83
10.Guengant J-P. Africa’s population: History, current status, and projections. In: Africa’s Population: In Search of a Demographic Dividend. Cham, Switzerland; 2017. DOI: 10.1007/978-3-319-46889-1_2
11.Tenikue M., Konan YS, Nyokon CEM, Degnon Dossou FZ. Le dividende démographique en Afrique Premiers signes et estimation par la méthode de décomposition | Population Environment Research Network (PERN). IUSSP; 2017. Available from: https://www.populationenvironmentresearch.org/node/10557
12.Eloundou-Enyegue P, Giroux S, Tenikue M. African transitions and fertility inequality: A demographic Kuznets hypothesis. Population and Development Review. 2017;43(S1):59-83
13.Eloundou-Enyegue PM, Giroux SC. Fertility transitions and schooling: From micro-to macro-level associations. Demography. 2012;49(4):1407-1432
14.Eloundou-Enyegue PM, Giroux SC. The role of fertility in achieving Africa’s schooling MDGs: Early evidence for sub-Saharan Africa. Journal of Children and Poverty. 2013;19(1):21-44
15.Eloundou-Enyegue P, Tenikue M, Konan YS, Nyokon CEM, Degnon Dossou FZ. The demographic dividend in Africa first signs and estimation by the decomposition method. IUSSP; 2018. Available from: https://www.populationenvironmentresearch.org/node/10557
16.Groth H, May JF. Africa’s Population: In Search of a Demographic Dividend. Cham, Switzerland: Springer; 2017
17.Paris F. Population and sustainable development in sub-Saharan Africa. Population Avenir. 2011;701(1):4-8
18.Eloundou-Enyegue PM, Stokes CS, Cornwell GT. Are there crisis-led fertility declines? Evidence from Central Cameroon. Population Research and Policy Review. 2000;19:47-72
19.Bloom DE, Kuhn M, Prettner K. Africa’s prospects for enjoying a demographic dividend. Journal of Demographic Economics. 2017;83(1):63-76
20.Alary P, Lafaye de Micheaux E. L’économie politique de l’Asie: État des lieux et perspectives de recherche pour l’Asie du Sud-Est. Introduction. Revue de La Régulation. Capitalisme, Institutions, Pouvoirs. 2013:13
21.CEPII. L’économie mondiale 2020. La Découverte: Cairn.info; 2019. Available from: https://www.cairn.info/l-economie-mondiale-2020--9782348045707.htm
22.Gribble JN, Bremner J. Achieving a demographic dividend. Population Bulletin. 2012;67(2):16
23.Canning D, Raja S, Yazbeck AS. Africa’s Demographic Transition: Dividend or Disaster? Washington, DC: World Bank Publications; 2015
24.Lam D. How the world survived the population bomb: Lessons from 50 years of extraordinary demographic history. Demography. 2011;48(4):1231-1262
25.Lutz W, Goldstein JR. Introduction: How to deal with uncertainty in population forecasting? International Statistical Review. 2004;72(1):1-4
26.Beninguisse G, Eloundou-Enyegue PM, Kobiane JF, Yao SK, Tenikue M. 50 questions pour comprendre le Dividende démographique. 2017
27.CREFAT. Compte nationaux de transfert : Comprendre l’economie generationelle. 2016. Available from: www.ntaccounts.org
28.Dramani L. Économie générationnelle et dividende démographique: Éléments de diagnostic au Sénégal – Tome 1. Paris, France: L’Harmattan; 2016
29.Ashraf QH, Weil DN, Wilde J. The effect of fertility reduction on economic growth. Population and Development Review. 2013;39(1):97-130
30.Karra M, Canning D, Wilde J. The effect of fertility decline on economic growth in Africa: A macrosimulation model. Population and Development Review. 2017;43:237-263
31.Moreland S, Madsen EL, Kuang B, Hamilton M, Jurczynska K, Brodish P. Modeling the Demographic Dividend: Technical Guide to the DemDiv Model. 2014. 10.13140/RG.2.1.4162.1607
32.Diallo I, Maiga M, Moreland S. Modélisation du dividende démographique: Le Model Demdiv. CICES. Dakar, Senegal: USAID; 2015
33.Lee R, Mason A. Fertility, human capital, and economic growth over the demographic transition. European Journal of Population= Revue Europeenne de Demographie. 2010;26(2):159
34.Measuring and Analysing the Generational Economy: National Transfer Accounts Manual. 2013. Available from: https://www.un.org/en/development/desa/publications/measuring-and-analysing-the-generational-economy.html
35.Nationen V, editor. Measuring and Analysing the Generational Economy: National Transfer Accounts Manual. New York, NY: United Nations; 2013
36.Bhattacharya G, Haldar SK. Does demographic dividend yield economic dividend? India, a case study. Economics Bulletin. 2015;35(2):1274
37.Bloom D, Canning D, Fink G, Finlay J. Fertility, the demographic dividend, and economic growth. In: Fourth Annual Research Conference on Population, Reproductive Health, and Economic Development, Cape Town. Santa Monica, CA; 2010
38.Drummond MP, Thakoor V, Yu S. Africa Rising: Harnessing the Demographic Dividend. Washington, DC: International Monetary Fund; 2014
39.Misra R. Impact of demographic dividend on economic growth: A study of BRICS and the EU. International Studies. 2015;52(1–4):99-117
40.Crespo Cuaresma J, Lutz W, Sanderson W. Is the demographic dividend an education dividend? Demography. 2014;51(1):299-315
41.UNDESA. UN/DESA Policy Brief #53: Reflection on development policy in the 1970s and 1980s|Department of Economic and Social Affairs (No. 53; World Economic and Social Survey). 2017. Available from: https://www.un.org/development/desa/dpad/publication/policy-brief-53-reflection-on-development-policy-in-the-1970s-and-1980s/
42.Garenne M. Planning familial et fécondité en Afrique: Évolutions de 1950 à 2010. FERDI. 1950. Available from: https://horizon.documentation.ird.fr/exl-doc/pleins_textes/divers17-08/010070544.pdf
43.Sims J, Romero J. Latin American debt crisis of the 1980s. Federal Reserve History. 2013;22
44.Emara N, Simutowe A, Jamison T. Commodity price changes and economic growth in developing countries. Journal of Business and Economics. 2015;6(10):1707–1712. Available from: https://ssrn.com/abstract=3812834
45.Maizels A. The continuing commodity crisis of developing countries. World Development. 1994;22(11):1685-1695
46.Feng W, Gu B, Cai Y. The end of China’s one-child policy. Studies in Family Planning. 2016;47(1):83-86
47.Visaria L, Jejeebhoy S, Merrick T. From family planning to reproductive health: Challenges facing India. International Family Planning Perspectives. 1999;1999:S44-S49
48.Knodel J, Debavalya N, Kamnuansilpa P. Thailand’s continuing reproductive revolution. International Family Planning Perspectives. 1980;1980:84-97
49.CELADE. Indicadores de pueblos indígenas y afrodescendientes, Santiago de Chili; disponible à l’adresse. 2013. Available from: http://celade.cepal.org/redatam/PRYESP/SISPPI/
50.Grinblat JA. L’évolution de la fécondité dans le monde depuis 1965 et ses conséquences. Mondes en développement. 2008;142(2):13-22. DOI: 10.3917/med.142.0013
51.Alesina A, Özler S, Roubini N, Swagel P. Political instability and economic growth. Journal of Economic Growth. 1996;1:189-211
52.Porteous T. L’évolution des conflits en Afrique subsaharienne. Politique Étrangère. 2003;2003:307-320
53.Bates R. Political insecurity and state failure in contemporary Africa. CID Working Paper Series. 2005
54.Easterly WR. The Elusive Quest for Growth: Economists’ Adventures and Misadventures in the Tropics. Cambridge, MA: MIT Press; 2002
55.Mkandawire PT, Soludo CC. Our Continent, our Future: African Perspectives on Structural Adjustment. Dakar, Senegal: IDRC; 1999
56.Collier P, O’Connell S. Opportunities and choices. In: Ndulu B, O’Connell S, Bates R, Collier P, Soludo C, editors. The Political Economy of Economic Growth in Africa 1960–2000. Cambridge, UK: Cambridge University Press; 2008
57.Bell C, Devarajan S, Gersbach H. The long-run economic costs of AIDS: A model with an application to South Africa. The World Bank Economic Review. 2006;20(1):55-89
58.Berquó ES, Cavenaghi SM. Notas sobre os diferenciais educacionais e econômicos da fecundidade no Brasil. In: Revista Brasileira de Estudos de População. Vol. 31. Rio de Janeiro, Brazil: SciELO Brasil; 2014. pp. 471-482
59.Abbasi-Shavazi MJ, McDonald P, Hosseini-Chavoshi M. The Fertility Transition in Iran. Vol. 75. Dordrect, Netherlands: Springer; 2009
60.Caldwell JC, Caldwell P. Africa: The new family planning frontier. Studies in Family Planning. 2002;33(1):76-86
61.Westoff CF, Cross AR. The stall in the fertility transition in Kenya (DHS Analytical Studies No. 9). Article DHS Analytical Studies No. 9. 2006. Available from: https://dhsprogram.com/publications/publication-as9-analytical-studies.cfm
62.Bongaarts J. The causes of stalling fertility transitions. Studies in Family Planning. 2006;37(1):1-16
63.Garenne ML. Testing for fertility stalls in demographic and health surveys. Population Health Metrics. 2011;9(1):1-8
64.Broadman HG. Africa’s Silk Road: China and India’s New Economic Frontier. Washington, DC: World Bank Publications; 2006
65.Aker JC, Mbiti IM. Mobile phones and economic development in Africa. Journal of Economic Perspectives. 2010;24(3):207-232
66.Kenya National Bureau of Statistics, National AIDS Control Council, National AIDS/STD Control Programme, Ministry of Public Health and Sanitation, Kenya Medical Research Institute, National Coordinating Agency for Population and Development, et al. Kenya Demographic and Health Survey 2008–09. 2010. Available from: https://www.dhsprogram.com/publications/publication-fr229-dhs-final-reports.cfm
67.Agency/Ethiopia CS, International ICF. Ethiopia Demographic and Health Survey 2011. 2012. Available from: https://dhsprogram.com/publications/publication-fr255-dhs-final-reports.cfm
68.Roach S. Unbalanced: The Codependency of America and China. Amazon.com: Books. 2023. Available from: https://www.amazon.com/Unbalanced-Codependency-America-Stephen-Roach/dp/0300187173 [Accessed: May 19, 2023]
69.World Bank. World Development Report 2020: Trading for Development in the Age of Global Value Chains. Washington, DC: World Bank; 2020. DOI: 10.1596/978-1-4648-1457-0
70.2020 Corruption Perceptions Index—Explore the results. International Transparency. 2021. Transparency.org. Available from: https://www.transparency.org/en/cpi/2020
71.Bank AD. Asian Development Outlook 2019: Strengthening Disaster Resilience. Metro Manila, Philippines: Asian Development Bank Institute; 2019
72.Demographic N. Health Survey 2013. National Population Commission (NPC)[Nigeria] and ICF International. Abuja, Nigeria, and Rockville, Maryland, USA: NPC and ICF International; 2019
73.Bongaarts J. Africa’s unique fertility transition. Population and Development Review. 2017;43:39-58
74.Eastwood R, Lipton M. Demographic transition in sub-Saharan Africa: How big will the economic dividend be? Population Studies. 2011;65(1):9-35
75.Karra M, Canning D, Wilde J. A Simulation Model of the Effect of Fertility Reduction on Economic Growth in Africa. Department of Global Health and Population. Boston, MA, USA: Harvard School of Public Health; 2015 Available from: http://economics.usf.edu/pdf/karra%20canning%20wilde
Notes
Regions here are defined by the World Bank regional coding. Specific details on the country composition of each region can be found in the WDI Online database (WDI Online 2020).
For example, [23, 24, 25] work use a model integrating a greater diversity of parameters (the effects of FP policies, endogenous savings, child health, the effects of manufacturing and agriculture, wage distortions, and the effects of women’s education on fertility) to try to account for a broad range of policy conditions.
The Atlas method facilitates comparison by converting to US dollars using the exchange rates over 3 years, while the PPP method attempts to estimate equal purchasing power among countries. There is no clear rule as to whether one should use the Atlas method vs. PPP.
Written By
Zhuang Han, Claude Mbarga, Michel Tenikue and Sarah Giroux
Submitted: 20 February 2023Reviewed: 31 March 2023Published: 07 December 2023