Open Access is an initiative that aims to make scientific research freely available to all. To date our community has made over 100 million downloads. It’s based on principles of collaboration, unobstructed discovery, and, most importantly, scientific progression. As PhD students, we found it difficult to access the research we needed, so we decided to create a new Open Access publisher that levels the playing field for scientists across the world. How? By making research easy to access, and puts the academic needs of the researchers before the business interests of publishers.
We are a community of more than 103,000 authors and editors from 3,291 institutions spanning 160 countries, including Nobel Prize winners and some of the world’s most-cited researchers. Publishing on IntechOpen allows authors to earn citations and find new collaborators, meaning more people see your work not only from your own field of study, but from other related fields too.
To purchase hard copies of this book, please contact the representative in India:
CBS Publishers & Distributors Pvt. Ltd.
www.cbspd.com
|
customercare@cbspd.com
Own to its negative effect on the global ecosystem, air pollution has been a growing concern. Developed world had taken it on top priority long before, now they breathe the air of much better quality. Contrarily, air pollution was not on the priority list of developing worlds. Consequently, air pollution in regions such as South Asia is 5–9 times higher than in the developed world and the world’s topmost polluted cities lie in South Asian countries including Pakistan. Now, due to the apparent and widespread, effects and pressure from the local and global community, Pakistan has started taking the air pollution problem more seriously. The governments have taken multiple initiatives concerning monitoring and control of air pollution from industries. However, due to several challenges, the implementation is slow. To increase the pace of air pollution management in the country it is imperative to explore the underlying factors. This chapter synthesizes the available knowledge on the status of air pollution from industrial sources, its control, treatment technologies, and factors slowing the air pollution control and then in the light of this knowledge, provides suggestions to improve the pollution management problem in the country.
Department of Structures and Environmental Engineering, University of Agriculture, Faisalabad, Pakistan
*Address all correspondence to: ammar.aslam@uaf.edu.pk
1. Introduction
Air pollution is attributed to the release of harmful pollutants into the atmosphere which are inimical to human health and other living organisms. According to the World Health Organization (WHO) report published in 2019, every year 7 million deaths occur in the entire world due to air pollution (Figure 1). Air pollution (indoor & outdoor) particulate matter is the main factor causing many diseases like heart problems, stroke, lower respiratory infections, lung cancer, diabetes, and chronic obstructive pulmonary disease (COPD) [1]. The global burden of disease shows that about 4.9 million premature deaths were caused by air pollution in 2017. WHO estimates about 7 million premature deaths in 2016. Stockholm Environment Institute studies the effects of air pollution on human health. In 2010, a global assessment of pre-term birth revealed that 2.7 million pre-term birth occurs due to exposure to PM 2.5 in outdoor environments [2].
Figure 1.
Number of deaths by risk factor (Our World in Data, 2021).
As reported in the World Air Quality Report (WAQ , 2019) Asia is highly polluted with the highest particulate concentrations compared to the rest of the world. Among its four sub-regions i.e., South Asia, Southeast Asia, East Asia and West Asia, South Asia has the highest pollution concentrations with four out of the top five polluted countries in the world and thirty out of forty most polluted cities in the world. In Bangladesh, India, Nepal, and Pakistan the air quality is much worse (44%) than it had twenty years ago, especially in Pakistan where air quality has remained poor since 1990. One of the leading reasons which are causing air pollution in Pakistan is the emission of industries like carbon dioxide, sulfur dioxide, nitrogen dioxide, smoke, etc. Pakistan’s industrial sector is very broad and deals with textile, leather, chemicals, fertilizers, petrochemical, pharmaceutical, paper and board, electric, sugar, food, automobile, cement, and heavy engineering industries. These industries bring about capacious hazardous waste, noxious gaseous pollutants, and other emissions which are poisonous to human health. Under the World Trade Organization administration, there are some strict rules and regulations set by ISO for the safe disposal of hazardous substances, effluents, and waste. Pakistan is included in those Asian countries where industrial pollution is at high and unaccepted levels. About 6.5 million people are hospitalized each year due to diseases caused by industrial pollution.
Air pollution emitted from different sources has different effects. To understand the basic concept of sources first, we need to understand their origin, how much they are affecting people, and which are the most polluted cities. Since most of the air is polluted due to industrial activities, it is vital to understand the concept of air pollution in connection with industries. This chapter intends to comprehend information on air pollution from industrial sources. To achieve this goal, we have outlined this chapter in the following sections. In the first section, we have described the mechanisms of pollutant formation, the second section describes the current situation of air pollution in Pakistan, in the third section we comprehend challenges being faced by the enforcement agencies in ensuring compliance from industries, and in the fourth section, different options to ensure compliance by industries and pollution control are described.
2. Mechanism of pollutant formation in industrial processes
Criteria of air pollutants are those pollutants upon which we set the limit range of exposure which is tolerable. There are a total of six criteria pollutants carbon monoxide, sulfur dioxide, nitrogen dioxide, particulate matter, ozone, and lead [3]. Based on their composition air pollutants are divided into two types, particulate matter, and gaseous pollutants. Particulate matter consists of solid airborne particulates like dust, fly ash, smoke, fog, soot, and fumes. While on the other hand, gaseous pollutants consist of carbon monoxide, sulfur dioxide, and nitrogen dioxide. Pollutants are also classified into primary and secondary based on their formation process. Pollutants that directly exit from combustion processes are known as primary pollutants. Among criteria pollutants, carbon monoxide, sulfur dioxide, nitrogen dioxide, particulate matter, and lead are the primary pollutants. When these primary pollutants encounter each other in the presence of moisture, energy, and volatile organic compounds (VOC) in the atmosphere, they form secondary pollutants such as particulate matter ozone, and other reactive materials. Primary particulate matter is solid while secondary particulate matter is liquid [4]. Since sulfur and nitrogen oxides released from industries are the primary constituents of secondary particulate matter. Almost 30% of sulfur dioxide and 90% of nitrogen oxides in the atmosphere transform into secondary particulate matter. Moreover, the nature, type, and quantity of primary pollutants from industrial sources largely depend on the type and quality of fuel used. Therefore, formation mechanisms are described based on the type of fuels as well.
2.1 Growth of the industrial sector in Pakistan
With a 19% share of the gross domestic product (GDP), the industrial sector is the second largest sector in Pakistan [5]. Throughout recent history, it has been growing owing to local and global factors. According to the Pakistan Bureau of Statistics, there were 4474 large-scale manufacturing industries (LSMI) in 1995. The number grew to 8680 in 2005–2006 and rose exponentially to 42,578 in 2015–2016. Industrial growth in Pakistan is associated with globalization and the growth of personal remittances received [6, 7]. The industrial sector has been one of the major contributors to air pollution in Pakistan. As reported by [8] over the past two decades between 1977 and 1998 the SO2 emissions from the industrial sector had increased by 52 times (Table 1). Their growth will further deteriorate ambient air quality, making it imperative to synthesize the status of industrial emissions in the recent past.
1977–1978
1987–1988
1997–1998
Sector
SO2
NOx
SO2
NOx
SO2
NOx
Industry
19
N/A
423
N/A
982
N/A
Transport
52
N/A
57
N/A
105
N/A
Power
4
3
95
N/A
996
76
Domestic
5
N/A
16
N/A
40
N/A
Agriculture
5
N/A
28
N/A
40
N/A
Commercial
11
N/A
13
N/A
25
N/A
Table 1.
Air pollutants from the industrial sector (modified from [8] (thousand tons)).
The main factors which control pollutants loaded from industries into the atmosphere are the type, quantity, and quality of fuels. Besides emission loads, the nature and type of pollutants also depend on fuel characteristics [9]. Keeping in view their imperativeness to pollutants characteristics this section describes the type and chemical characteristics of fuels which are commonly used in Pakistan. As per the energy outlook of Pakistan report coal, diesel, firewood, furnace oil, compressed natural gas (CNG), liquid petroleum gas (LPG), and petrol (gasoline) are the major fuels being used in the industrial sector [10]. Among these fuels coal and firewood are solid, diesel, furnace oil, LPG, and petrol are liquid, while CNG is a gaseous fuel. The industrial use of fossil fuels (coal, diesel, firewood, furnace oil, CNG, LPG, and petrol) has been increasing in Pakistan. As reported by [11], the total industrial use of fossil fuels in 1990 was 5.71 million tons of oil equivalent (Mtoe), and it rose to 18.07 Mtoe in 2019.
It is the quality of fuel that determines how much of the fuel will transform into pollutants. The quality of solid fuels is characterized based on their chemical properties such as the percentage of moisture contents, volatile matter, fixed carbon and ash contents, and concentration of hydrogen, carbon, nitrogen, oxygen, and sulfur contents [12]. In the case of liquid and gaseous fuels, their quality is determined based on flash point (Table 2), density, ignition point, kinematic viscosity, heating value, and ignition temperature [13]. The chemical properties of solid fuels are determined by using proximate and ultimate analysis. While of liquid and gaseous fuels, they are determined by using analytical techniques [14].
Type
Fuel
Flash point (°C)
Density (kg/m3)
Kinematic viscosity (m2/s)
Heating value (MJ/kg)
Ignition temperature (°C)
HHV
LHV
Liquid/gaseous fuels
Gasoline
−42
750
0.5 × 10⁻⁶
45.7
42.9
246–280
Diesel
50
830
3.0 × 10⁻⁶
47
43
210
CNG
−187
0.72
7.8 × 10⁻⁶
55
50
537
LNG
−188
430
1.6 × 10⁻⁶
50
45
537
Table 2.
Qualitative characteristics of major industrial fuels [9].
2.3 Mechanism of formation
This section describes the mechanisms of pollutant formation from commonly used fuels in industries in Pakistan.
2.3.1 Oxides of sulfur
Oxides of sulfur are formed when sulfur-containing fossil fuels are burned. During the formation of coal and oil, a small part of sulfur fused into fossil fuel. Sulfur is discharged into the atmosphere as sulfur oxide when fuel is burned. In the case of coal, sulfur is present in inorganic compounds like pyritic sulfur and sulfates. In coal, about 0.2–5% sulfur is present in dry form. Sulfur is emitted when high temperatures occur which is basically during the gasification process [15]. In the case of oil, sulfur dioxide converts into sulfur trioxide during combustion. This process is carried out by vanadium oxides and iron which play the role of catalysts [16].
2.3.2 Oxides of nitrogen
Oxides of nitrogen released from industries are a blend of nitrogen oxide and nitrogen dioxide. Most oxides of nitrogen are formed by human activities like fossil fuel burning, the formation of nitrogen acid and nitrogenous fertilizers, and some other industrial processes. There are two types in the case of fuel combustion, one is thermal NOx which is released when oxygen and nitrogen are burned at high temperatures. Second, is fuel NOx, formed by decomposed and oxidized compounds of nitrogenous compounds in fuel like pyridine (C5H5N) and carbazole (C12H9N) at high (1204°C) temperatures [17].
In fuel type NOx, about 0.3–2% nitrogen is present by weight. These fuel compounds which have nitrogen emit in the form of gas when the particles of fuel are burned in the devolatilization process. Which results in the formation of HCN, NH3, and N [18]. In coal type NOx, coal consists of organic nitrogen compounds which discharge into the atmosphere as volatile gases. These compounds react with the oxygen present in the air in the boiler combustion zone [19].
2.3.3 Oil combustion
Major boiler constellations for fuel oil combustors are water tubes, fire tubes, cast iron, and tubeless designs. Boilers are based on the orientation of heat transfer surfaces, burner shape, and size. In fire tube boilers, hot combustion gases pass through the tubes while water heated revolves outside the tube. High-pressure steam in the fire tube unit is carried by the very strong boiler wall. Fire tube boilers are small, and they are used where boiler load is relatively constant. In the case of a cast iron boiler, combustion gases level up through a vertical heat exchanger and discharge through an exhaust duct. Such types of boilers are used in commercial or residential areas (internal layout of fire tube boiler) [20].
In the diesel combustion process, hydrogen and carbon make the lineage of diesel fuel work like fossil fuel. When the combustion process is complete it will make carbon dioxide and water in the combustion chamber. During the combustion process, a lot of dangerous products are released [21]. Pollutants that are emitted from diesel fuel are mostly CO, HC, NOx, and PM. NOx contributes (50%) more to polluting the air than other pollutants. After NOx, PM plays a vast role in polluting the air [21].
2.3.4 Carbon monoxide
Carbon monoxide is formed when organic materials like firewood, coal, and gasoline are partially burned. Due to an insufficient amount of O2, oxidation rate from CO to CO2 is very slow. In the case of industries, the formation of CO is completely different, which is called steam reformation. Methane gas is mixed with steam gas in the presence of a catalyst at a high temperature which results from hydrogen gas and carbon monoxide [22].
2.3.5 Particulates matters
These are small solid particles present (PM 2.5 and PM 10) in the atmosphere. These particles originated from fire ash, dust particles, industrial plants, and asbestos (20). In industries, these particles are formed through the combustion process or the complex reactions of oxidation in gases like sulfur dioxide and nitrogen dioxide [23]. Particulate matter released from diesel is known as diesel particulate matter (DPM). It is made of elemental carbon, PAHs, and nitro PAHs [24]. Particulate matter released from firewood burning is microparticles that form when organic matter and wood burn [25]. Asbestos particulate matter is different from others because its length is greater than its width. The mechanism which is the main source causing the particulate disposition is impaction, diffusion, and sedimentation [26].
2.3.6 Coal combustion
Coal is an inorganic fuel. When coal is heated the organic matter of coal is pyrolyzed which develops as volatile. The remaining solid is a mixture of carbon and mineral matter, which is known as char. The combustion of coal is primarily the combustion of carbon as well as volatile matter. Combustion of coal has three basic steps. (1) Discharge of volatile matter in response to heating of coal,
(2) volatile matter, which is released burn, and (3) burning of the remaining char. The flaming process of volatile matter and coal combustion takes place at the same time (Partitioning of coal combustion mechanism) [27].
2.3.7 Ozone
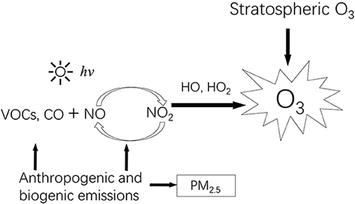
When NOx and volatile organic compounds discharge into the atmosphere they react with each other in the presence of sunlight which causes the formation of ozone (Figure 2). Triplet oxygen is formed when dioxygen and singlet oxygen react with each other in the existence of a third body molecule that can absorb the heat discharge during the reaction. Ozone lies in both the troposphere and stratosphere [28].
Figure 2.
Formation of ground-level ozone [28].
Ozone is not formed directly but it is a series of complex chemical reactions. Ozone formation from coal is taken by different reactions between reactive organic compounds and nitrogen oxides. A high concentration of ozone is released during a photochemical reaction [29]. Ozone is released during the burning of oil by a reaction between volatile organic compounds and nitrogen oxide. VOCs such as paints, industrial solvents, and cleaners [30].
2.3.8 Lead
Lead (Pb) is known as heavy metal which is found in both natural and manufactured items. The emission of lead into the air is in the form of suspended particles. Exposure of humans to lead is through breathing or the lead present in the air comes in contact with soil or dust [31].
Tetraethyl lead is a lubricant oil that acts as an anti-knocking agent for petrol and gas. It is formed when ethyl chloride reacts with a powdered alloy of sodium and lead [32]. Lead is formed in coal by monosulfides (known as galena), silicates, and pyrite. Its concentration depends on the type of coal like low-rank coal or high-rank coal [33].
2.4 Factors affecting the rate of pollutants generation
Besides the combustion process and fuel type, some other factors moisture content, fuel variety, temperature, and ash contents also affect the rate of pollutants generation in coal fuel (Table 3). The effect of moisture content on the pollutant (SOx, NOx, PM, Ozone, Pb, and CO) generation is defined as the increase in the devolatilization rate, and the moisture rate increases [34]. Four coal varieties (anthracite, bituminous, lignite, and sub-bituminous) are commonly being used as industrial fuels. Anthracite does not produce any pollutants during combustion while bituminous, lignite, and sub-bituminous produce pollutants [35]. In the case of temperature, the generation of pollutants increases with the increase in temperature [36]. Likewise, with the increase in the ash content, the concentration of pollutants increases [37].
Sr
Factors
Change in magnitude or type of fuel
Effect on rate of pollutant generation
1
Moisture content
Increase
Increase
2
Temperature
Increase
Increase
3
Ash content fuel
Increase
Increase
4
Type of coal
Bituminous, lignite, and subbituminous
emit pollutants except anthracite coal
5
Type of fuel
Diesel, LNG, and crude oil
emit pollutants except LPG
Table 3.
Effect of different factors on the rate of pollutant generation in coal and fuel oil combustion.
In oil combustion, an increase in moisture content causes the combustion rate to decrease which means pollutant emission will also decrease [38]. There are different types of fuel like diesel, LPG, LNG, and crude oil. All of them emit air pollutants that have hazardous effects on the environment except LPG. Diesel fuel increases the production of SOx in the environment while crude oil and gases contribute ozone, and VOCs in the environment [39, 40, 41]. Temperature increases, increase the amount of pollutants, especially nitrogen oxide [42]. Ash content contributes more pollutants into the environment like particulate matter, sulfur, etc. [43].
In this section, we discussed the results of air quality monitoring performed in different cities of Pakistan, their health impacts on people, and some regulatory framework policies implemented in Pakistan for air pollution.
3.1 Air pollution from industries
The rate of urbanization increases with the increase in population which contributes to an increase in the number of transport and industrial sector.
3.1.1 Punjab, Pakistan
In 2015, air quality monitoring was performed in two cities of Punjab Faisalabad and Gujranwala as both are industrial cities to check the pollution load index, pollution index, geo-accumulation index, and integrated pollution index. Results indicate that Faisalabad has more pollution index (of 91.43%) while Gujranwala has less pollution index (of 85.29%) [44].
In 2017 Lahore, Punjab Pakistan research work was conducted to check out monthly and diurnal patterns of air pollutants. As Lahore lies in the semi-arid region it means low rainfall and cold dry winter. The air quality index is high during the winter season (November to February) which represents low temperature and humidity. On the other hand, the air quality index is low during the summer season (June to August) due to high temperatures and high wind speed [45].
Oxidative potential, chemical characteristics, and sources of PM 2.5 were measured in Lahore and Peshawar, Pakistan in February 2019. The level of exposure is estimated to be high in both cities. Major sources which deteriorate the quality of air or contribute the PM 2.5 in the atmosphere are carbonaceous species. Peshawar is under a high range of DTT (carbonaceous species) while Lahore has less. Road dust and traffic pollution play a huge part in the expansion of oxidative potentials [46].
In Faisalabad, Pakistan spatial and temporal changes were observed in aerosol particulate matter at nine different sampling sites from June 2012 to April 2013. Results indicate that the concentration of these PM is 20 times higher than the standard limits set by WHO. Fine particles are in high concentration during winter, coarse particles represent high concentration during summer time [47].
In Lahore, Pakistan air quality monitoring is performed in 15 households in different seasons with the help of DusTrak aerosol quality monitor. Monitoring is performed for seventy-two hours in the kitchen and living rooms. PM concentration is observed to be high during winter and autumn seasons while low during monsoon and summer seasons [48].
3.1.2 Islamabad, Pakistan
In 2017 air quality monitoring was performed in Islamabad and Rawalpindi, Pakistan. The combined population of both cities is about 15 million. The main objective of this monitoring is to identify the concentration of SOx, NOx, Ozone, PM 2.5 and PM 10, and carbon dioxide. Results indicate that all pollutants are present within permissible limits except PM 10 and carbon dioxide. PM 10 and carbon dioxide caught high concentrations at Saddar, Rawalpindi, and Blue Area, Islamabad [49].
3.1.3 Sindh, Pakistan
Air quality monitoring was performed (post-monsoon and pre-monsoon) in different sites in Karachi, Sindh Pakistan from 2017 to 2019. Monitoring areas are Landhi Industrial Area, Korangi Industrial Area, and North Karachi Industrial Area. Most criteria pollutants are focused on checking their concentration in these polluted areas. Results show that the concentration of pollutants is less observed in post-monsoon while these pollutants have high concentration during pre-monsoon season. Korangi and Landhi have more exposure to these pollutants (especially PM 10 and PM 2.5) than other areas [50].
3.1.4 Peshawar, Pakistan
In Peshawar, KPK Pakistan density of particulate matter has exceeded the WHO average PM limits. In November 2016 monitoring results show that the average mass concentration of PM 2.5 and PM 10 is 252.6 and 771.8 micrometers. The concentration level is 10 to 16 times more than the recommended WHO limits [51].
In Peshawar, Pakistan particle size distribution and mass concentration measure by aerosol spectrometer GRIMM (Durag Group, Hamburg, Germany) spectrometer data. The positive matrix factorization model helps to mark the suitable sources (Industrial, brick kiln, and vehicular emissions) which contribute to the PM in Peshawar. Data was collected for 20 days both morning and evening in April 2011. Results show that the volume size distribution of aerosol is high during the morning and afternoon. Especially during the rush hours [52].
3.1.5 Baluchistan, Pakistan
Air quality in Quetta, Baluchistan Pakistan is more harmful than in other provinces in Pakistan. PM, Sox, NOx, and carbon dioxide these parameters’ concentrations are more than the actual normal limit. Lead petroleum fuel usage is higher because of smuggled petrol from Iran and Iraq. Studies reveal that the presence of lead in the blood level of people of Quetta is 28.3 μg/dL while in Tokyo it was 6 μg/dL. About 25 brick kilns are available around Quetta city as well as some small industries. The range of SPM of ambient air quality is 170 μg/m3 (at station Qta-2) to 500 μg/m3 (at Qta-1) with an average concentration of 370.52 μg/m3. This concentration surpassed the permissible limit of 200 μg/m3 provided by (NAQS) [53].
Air monitoring is performed in the Quetta Valley to analyze the concentration of lead in the ambient air. Calculate the ratio of vehicular emission emits from the exhaust pipe of vehicles and results indicate that it is four times higher than WHO limits. The concentration of lead peaks during springtime while low during summertime [52].
According to the Global Alliance on Health and Pollution, around 128,000 people die each year in Pakistan from pollution caused by air. Around 80% contribution of power, industry, and transportation causes the photochemical haze in Punjab [54].
4. Challenges faced by Pakistan in air pollution management
In this section, we will discuss the challenges Pakistan is facing in dealing with the air pollution problems. These problems are the main reason behind the deterioration of the air quality in the whole country.
4.1 Unawareness
The crucial reason behind the environmental issues and major threats related to health caused by air pollution is simply the lack of awareness among the people of developing countries like Pakistan. Indoor air pollution is a major threat to women and children especially in kitchens with the use of biomass fuel stoves. This causes acute respiratory infections in children (less than 5 years of age). Another issue is the availability of accurate information, there is a lack of awareness of the current information about the air quality of Pakistan [55]. Indoor air pollution in industries poses serious problems to the workers. Like in the textile industry during the processing, there is the emission of acid and oil mists, dust, odors, and solvent vapors. In the paper and pulp industry emission of chlorine from the bleaching unit is the most common indoor air pollution [56].
Information related to atmospheric pollution is known in cities of Pakistan but people who live in small towns are unaware of the air pollution. A study was conducted to check public awareness and WTP (willingness to pay) about the removal of atmospheric pollution in small towns of Pakistan by conducting interviews. Analysis of data is performed by the interval regression model. Results indicate that the main sources of information are the newspaper, TV, and radio. About 46% state that the severity of pollution is at an intermediate level. Other 48% believe that sources of this air pollution are vehicular emissions and industrial emissions. In the case of eco-friendly measures, about 37.7% gave concerns about using public transport and 27.7% gave an idea about using equipment on solar. People of towns want the government to perform preventive measures and stop atmospheric pollution [57].
4.2 Weak policies and regulations of government
Policies related to health, monitoring, and industrial rules are not strict in developing countries, especially in South Asia. In Pakistan, rules and regulations on air quality standards are not properly implemented. Pak-NEQs are introduced but still no feedback on such standards because of govt weak policies and unsatisfactory legislation.
4.3 Usage of unfavorable fuel
Poor quality fuel makes the quality of the air worse. Due to energy crisis problems in Pakistan usage of fuel has increased in the energy sector which pollutes the air. Pakistan introduces some high-quality fuels like (EURO 5) for vehicles but these are available in some parts of the country. Due to the economic condition of the country, govt. is focusing on using Thar coal instead of importing oil. This will make the condition worse and there will be high emissions of SOx and NOx [55].
4.4 Agricultural practices
Agricultural practices are the primary source of air pollution in Pakistan. The burning of crops or agricultural residue is the main contributor of carbon dioxide in the atmosphere. Emission of nitrous oxide from synthetic fertilizer. Crop residue, agriculture machinery, and cereal production are the intense causes of air pollution in Pakistan [58]. Stubble burning also causes smog in cities like Lahore and Karachi. According to FAO in 2018, about 20% of air pollution contributes to crop burning in Pakistan [59].
4.5 Deforestation
Deforestation causes environmental problems like air pollution, climate change, and soil erosion. It means the cutting, and burning of the trees for cooking or medical purposes [60]. Policy management in the case of forestry is not so good in Pakistan. Deforestation is at a high level in northern areas of Pakistan due to poor provincial governance and illegal usage [61]. Some brick kilns use wood as fuel which has a significant effect in causing deforestation and air pollution [62].
In this section, we will discuss the current modern technologies which are being used to treat air pollution. We will discuss each technology for all criteria pollutants (particulate matter, ozone, SOx, NOx, lead, and carbon monoxide).
5.1 Particulate matter (cyclone separator)
There are many technologies to remove particulate matter but the simple one which is used by most the industries is cyclone separator. Cyclone separators are also known as dry scrubbers. It works on the principle of inertia (centrifugal force makes the particles suspend and isolate them in the gaseous phase while the large particles move inside the cyclone due to inertia). Cyclone separators are used to remove the large particulate matter. Its efficiency depends on the density and size of the particles. Cyclones are cheap, their physical appearance is cone-shaped with no moving parts, and can endure high temperatures and pressure [63].
5.1.1 Mechanism
As discussed above there are many cyclones available but the best one for use is the reverse-flow cyclone. It reflects the thoughts on a new cyclone design which has a cone under a cylindrical body with a tangential inlet. The performance of the separation process depends on the length and the structure of the double vortex. In this design, vortex length and separation performance increase by decreasing friction losses in cyclones. This type of cyclone has inner and outer cylinders without any vortex limiter and conical parts. Through the outermost cylinder, the flow spirals down toward the inner cylinder without hitting wall friction before reversing course through the limiter plate in the path of the exit pipe. The vortex length is unable to be adjusted by moving the vortex limiter up or down. By way of example, the vortex limiter can be lowered downward to expand the vortex length and attain maximum efficiency if the rate of flow or inlet velocity increases. The centrifugal force allows the particles to travel toward the outer cylinder wall, which is where they become separated from the vortical flow and aggregate at the outer cylinder bottom. This is the initial process of segregation that takes place in the outer cylinder. The positive aspects of the new design include low cost of upkeep and ease of fabrication (Cyclone design) [64].
5.2 SOx (flue gas desulfurization)
There are three methods available to reduce sulfur dioxide emissions. (1) Remove the sulfur from the fuel before combustion. (2) Remove the sulfur dioxide during combustion. (3) Eliminate the sulfur from the flue gas after combustion. Fuel desulfurization and the selection of low sulfur are discussed in pre-combustion controls. In furnace injection, sorbents are utilized in combustion control, which is for conventional coal-fired plants. The flue gas desulfurization process is posting combustion control.
Flue gas desulfurization has been operated through wet scrubbers, spray dry scrubbers, sorbent injection, and regenerable processes. The mechanism of limestone scrubbing is based on the wet scrubbers.
5.2.1 Limestone scrubbing
Wet scrubbers are used mostly to treat sulfur dioxide emissions. To react to the SO2 in the flue gas, a slurry mixture with calcium sodium-based sorbents is put into a vessel which is particularly built. The removal efficiency of the wet scrubber is about 99%. The main reason behind this process is to make gypsum, a high-quality product which can be used as a raw material in many industries.
All the chemical reactions take place in a single integrated absorber to reduce the cost and energy usage. The integrated single-tower system occupies less space and can be fitted easily in already existing plants. Rubber, nickel alloy, or stainless-steel interiors are typically required for the absorber structure to avoid corrosion and abrasion. Scrubbers for fiberglass are also in use.
The main process of the preparation includes the formation of raw materials, pollutant absorption, maintaining the scrubber suspension pH, oxidation of sulfite to sulfate, separation of gypsum, and the last step is the treatment of wastewater. Limestone is utilized to make the absorber suspension. To produce a homogenous suspension, this is mixed with demineralized or municipal water in the absorber feed tank. The suspension is injected into the absorber with pH of 7 and 20% (by mass content) CaCo3 concentration. Air pumped from the absorber’s bottom enables the generated sulfite to oxidize to sulfate, causing forced oxidation. Upon being reheated above 72 degrees centigrade, the clean exhaust gases escape out into the station flue system. As the solubility of SO2 declines at low pH values, the absorption rate is highly reliant on pH. To sustain the pH value between 5 and 6.5, fresh feed sorbent solution is introduced to the suspension to cancel out the effect. This retains the quality of the gypsum manufactured and ensures suitable chemical absorption. The bottom of the absorber provides the gypsum suspension, which has 7–18% (by mass) solid matter concentration. Most of the water content drains off the gypsum suspension when it is introduced into the gypsum separator. Gypsum is collected as fine crystals after the water is removed by using a centrifuge (flow diagram of limestone scrubbing method) [65].
5.3 NOx (selective catalytic reduction)
Selective catalytic reduction is such a technology that is applied especially on stationery combinations units where the discharge level of NOx is high. SCR system might theoretically develop with a high NOx removal efficiency of 100%. In the SCR system, reagents which might be used for the reduction of NOx are ammonia and or urea. Before using urea as a reagent, transform it into ammonia.
5.3.1 Mechanism
The catalytic reactor ammonia injection grid and ammonia storage and delivery system are the main parts of selective catalytic reduction. Post-combustion flue gas is introduced with a nitrogen-based reducing agent, which can be ammonia or ammonia produced from urea. Within a specific temperature range, in the presence of oxygen and the catalyst, the reagent effectively reacts with the flue gas NOx, decomposing it into molecular nitrogen and water vapors. SCR operation takes place across a wider and lower temperature range. On the other hand, a significant increase in capital and operational expenditures coincides with the drop in reaction in response temperature and a rise in efficiency. The significant amount of catalyst required to perform a reduction reaction is the primary cause of the increases in capital costs. Ammonia reagent and maintenance catalyst expenses make up more than half of SCR’s operating cost. Whereas the catalyst replacement cost was traditionally high, the reagent cost has risen to be the most significant element of running cost for most of the SCR. By an injection grid installed in the ductwork, the reagent is introduced into the flue gas downstream of the combustion unit and economizer. For ease of injection, the reagent is usually dissolved with steam or compressed air. After the reagent and the flue gas combine, they both approach a reactor chamber that contains the catalyst. The NOx in the flue gas chemically reduces nitrogen and water when the heated flue gas and reagent permeate through the catalyst and encounter active catalyst sites. The reaction is driven by heat from the flue gas. In the meantime, the SCR reactor discharges nitrogen as well as any other components of exhaust gas (SCR flow process diagram) [66].
5.4 Ozone (thermal catalytic method)
Ozone is known as a pale blue pollutant whose concentration increases as the altitude increases. There are some methods used to remove the ozone like adsorption with activated method, thermal decomposition, and thermal catalytic removal of ozone. It is one of the best catalytic techniques. Use of different nanosized catalyst metals like platinum, gold, and palladium are used as active catalyst components. The catalyst is usually placed on the metallic and ceramic honeycomb support. Ozone should be shifted to the catalyst surface which meets the catalyst and decomposes as the catalyst reaction is a surface reaction. Ozone must diffuse first via the outer surface, then move through the porous network and engage with the catalyst to stop the conversion.
5.4.1 Mechanism
One through experimental design (used in bleeding air purification of aircraft cabin) is used to remove the ozone. High pressure zero is produced by a zero-air generator driven by an air compressor. For regulating the mass flow rate of the zero gas (ThermoEnvironmental Inc. Model 146C) is used in conjunction with the zero-air generator. To add the ozone into the experimental setup, an ozone generator with three UV lamps and a primary wavelength of 254 nm is used. UV lamps are used to control the amount of ozone that enters the system. A specific concentration of ozone reached the reactor, which was set up in the middle of the electric resistance furnace after the flow rate and the ozone concentration remained steady for more than an hour. This transpired when the ball valve in route two opened and the valve in route one closed. To fulfill the temperature requirement of the bleed air, regulate the furnace temperature by using the temperature controller within the range of 25–500°C. A Utube manometer is used to measure the reactors’ pressure drop. A thermostatic water bath is employed to the lower airstream temperature before it reaches the ozone analyzer, as the ozone analyzer air suction temperature is low. To regulate the ozone analyzer measurement, a declaration section is outfitted with equipment to lower air velocity. The reaction temperature is measured by a thermocouple that was inserted into the reactor. Single activated carbon or activated carbon loaded with palladium catalyst is rolled up and filled inside. The airflow is passed through a 3 mm opening in the middle of the rolling-up ACFs. Later, frosted glass was attached to the quartz reactor on both ends to result in a powerful sealing effect.
5.4.2 Preparation of Pd/ACFs
After being submerged in the palladium solution, the treated ACFs are run through an ultrasonic cleaner for 10 minutes. Afterwards, the palladium solution underwent 6 hours of vacuum pump suction separating to eliminate the particles of the chloride which are left behind. Eventually, the catalyst Pd/ACFs are formed by submitting (Pd/AFCs) to a twelve-hour blast oven with an electric thermostat set at 100°C (experimental setup of ozone converter) [67].
5.5 Carbon monoxide (biofiltration)
The old treatment technologies for carbon monoxide are UV and photocatalytic techniques, and selective catalytic oxidation with noble metals like Au, Ru, and Rh. The main disadvantage of such technologies include it cost a lot of money. One technique is biofiltration, which is passing a stream of contaminated air through a bed filled with solid media before it is evacuated or humidified. Biofilter contains microorganisms (methanotrophs, ammonia oxidizers, oligotrophic bacteria, fungi, and algae) which break down the pollutants.
5.5.1 Mechanism
Nutrient solution (gram per liter) which is used during the study is magnesium sulfate heptahydrate (0.12), monopotassium phosphate (0.25), ammonium sulfate (1.18), sodium chloride (1.00), and ammonium chloride (0.96). Vitamins and trace mineral filter sterilized solution were added to the culture media after it had been autoclaved for 20 minutes at 120°C.
It is a glass cylindrical packed bed reactor with dimensions of 500 mm in height and 80 mm in diameter. The column that had been packed with lava rock or a mixture of lava rock or peat had an active height of 300 and 450 mm, respectively. The total reactive bed volume is either 1 or 1.5 L. Teflon has been utilized for all tubing, fitting, and connectors. The biofilters were supplied with the appropriate amount of humidified air and CO through its top. A pressurized cylinder delivered the pure CO that was placed inside the Tedlar bag. A small reglo peristaltic pump with a tube connecting the bag and silicon tubing was used to control the pump’s rotation speed to keep the CO input concentration within the range of 24–8830 mg per meter cube. An empty bed residence time (EBRT) of 85 seconds is given by the gas flow rate of 42 L/h. The range of residence time for the gas flow rate is 0.5–12 minutes.
5.5.2 Biofilter inoculum
First, 250 ml of aerobic activated sludge from a facility that produced synthetic resin wastewater treatment plant is added to the reactor as an inoculant. Following that, a pure culture of the CO degrader is also injected into it. Before use, a flask of activated sludge with a CO-degrading consortium was subjected to CO-polluted air. The fresh nutrient medium was added with leachate from the previous experimental bioreactor, and pure CO gas was pumped into the bottle as needed. The flask was utilized to inoculate the bioreactor after being incubated at 30°C and 120 rpm of shaking.
Gas chromatography is used for assessing the carbon monoxide gas phase contents in the biofilters. Samples were collected in the filter bed at various heights, and their pH was periodically measured. Regular measurements are made for the leachate’s pH. A compatible process is followed to prepare the samples of colonized packing material exposed to CO for electron microscopy investigations (biofilter treating carbon monoxide) [68].
5.6 Lead (technology under development)
In the case of lead, there is no such technology which can purify the air from the lead. Overcome the concentration of lead-based air pollution by following some strategies like making lead-free materials and lead-based paint abatement.
According to world data, lead will be completely banned in 2021 (Figure 3) and there will be no use of lead-based gasoline in the whole world [69]. Regular gasoline has not included lead since February 1975. In 1986, all gasoline used in on-road automobiles was lead-free [70].
Figure 3.
Global phase-out of leaded petrol (Our World in Data, 2021).
References
1.Ritchie H, Roser M. Air Pollution. Our World Data. 2017. Available from: https://ourworldindata.org/air-pollution
2.Kuylenstierna J, Malley C, Büker P, Marmon T. Air pollution and its impact on health. An Important Driver for Achieving the 1.5°C Goal of the Intergovernmental Panel on Climate Change. Stockholm: SEI Policy Brief; 2020
3.Criteria Air Pollutants. California Air Resources Board. 2023. Available from: https://ww2.arb.ca.gov/our-work/programs/criteria-air-pollutants/about
4.Bhargava A. Air pollution - sources and classification. Open Access Journal of Biogeneric Science and Research. [Internet]. 10 Jun 2020;1(4):11-14. Available from: https://biogenericpublishers.com/jbgsr. ms.ID.00022.text/ [Cited 2023 Aug 9]
5.World Bank. World Bank Open Data. World Bank Open Data. 2023. Available from: https://data.worldbank.org
6.Bhatti MA, Fazal S. Impact of Globalization on Industrial sector growth In Pakistan. Pakistan Journal of Economic Studies. 2020;3(1):24-45
7.Ajmair M. Determinants of industrial sector growth in Pakistan. Journal of Poverty. 2017;34:15-23
8.Khwaja MA, Khan SR. Air pollution. Key Environmental Issues in Pakistan. Sustainable Development Policy Institute, JSTOR; 2005
9.Yaqoob H, Teoh YH, Goraya TS, Sher F, Jamil MA, Rashid T, et al. Energy evaluation and environmental impact assessment of transportation fuels in Pakistan. Case Studies in Chemical and Environmental Engineering. 2021;1(3):100081
10.CMI_2015-16_report.pdf [Internet]. 2023. Available from: https://www.pbs.gov.pk/sites/default/files//industry_mining_and_energy/publications/cmi_2015-16/CMI_2015-16_report.pdf
11.Xiuhui J, Raza MY. Delving into Pakistan’s industrial economy and carbon mitigation: An effort toward sustainable development goals. Energy Strategy Reviews. 2022;1(41):100839
12.USGS. Analysis of Pakistan Coals. 1973. (Open-File Report)
13.North Carolina Department of Insurance. Module 2, Chemical and Physical Characteristics of Ethanol and Hydrocarbon Fuels
14.Hsu C. Diesel Fuel Analysis. In: Meyers RA, editor. Encyclopedia of Analytical Chemistry. Chichester: John Wiley & Sons Ltd; 2000. pp. 6613-6622
15.netl.doe.gov. 2023. 8.8. Sulfur Oxides (SOx) Emissions From Coal. Available from: https://www.netl.doe.gov/research/coal/energy-systems/gasification/gasifipedia/sox-emissions
16.What happens when fuel oils containing sulphur are burnt in a diesel engine without an exhaust gas cleaning system? EGCSA.com; 2023. Available from: https://www.egcsa.com/technical-reference/what-happens-when-fuel-oils-containing-sulphur-are-burnt-in-a-diesel-engine-without-an-exhaust-gas-cleaning-system/
17.Babcock & Wilcox. Nitrogen Oxides (NOx) Primer. 2023. Available from: https://www.babcock.com/home/about/resources/learning-center/nitrogen-oxides-nox-primer
18.ANSYS FLUENT 12.0 Theory Guide - 13.1.5 Fuel NOx Formation. (2023). Available from: https://www.afs.enea.it/project/neptunius/docs/fluent/html/th/node214.htm
19.NOx Formation. 2023. Available from: http://www.coaltech.com.au/NOxFormation.html
20.Yi Qian, n.d. Air Pollution Caused by Industries. Point Sources of Pollution: Local Effects And It’s Control Vol. I.
21.Reşitoğlu İA, Altinişik K, Keskin A. The pollutant emissions from diesel-engine vehicles and exhaust aftertreatment systems. Clean Technologies and Environmental Policy. 2015;17(1):15-27
22.How is carbon monoxide formed? 2023. Available from: https://byjus.com/question-answer/how-is-carbon-monoxide-formed/
23.Global Energy Monitor. 2021 Particulates and coal. Available from: https://www.gem.wiki/Particulates_and_coal
25.US EPA O. Smoke from Residential Wood Burning. 2014. Available from: https://www.epa.gov/indoor-air-quality-iaq/smoke-residential-wood-burning
26.Effects I of M (US) C on ASH. Exposure and Disposition. In: Asbestos: Selected Cancers. National Academies Press (US); 2006. Available from: https://www.ncbi.nlm.nih.gov/books/NBK20329/
27.Shen X. Coal Combustion and Combustion Products. OIL SHALE;
28.Zhang J (Jim), Wei Y, Fang Z. Ozone Pollution: A Major Health Hazard Worldwide. Frontiers in Immunology [Internet]. 2019;10:1-10. Available from: https://www.frontiersin. org/articles/10.3389/fimmu.2019.02518 [Cited 2023 Jul 24]
29.Avino P, Manigrasso M, Avino P, Manigrasso M. Ozone formation in relation with combustion processes in highly populated urban areas. AIMS Environmental Science. 2015;2(3):764-781
30.US EPA R 1. The Ozone Problem | Ground-level Ozone | New England | US EPA. 2023. Available from: https://www3.epa.gov/region1/airquality/oz_prob.html
31.Texas Commission on Environmental Quality. Air Pollution from Lead. 2023. Available from: https://www.tceq.texas.gov/airquality/sip/criteria-pollutants/sip-lead
32.Tetraethyl lead (TEL). Definition, History, Uses, & Poisoning. Britannica; 2023. Available from: https://www.britannica.com/science/tetraethyl-lead
33.Bartoňová L, Raclavská H, Čech B, Kucbel M. Behavior of Pb during coal combustion: An overview. Sustainability. 2019;11(21):6061
34.Li L, Bai X, Qu C, Zhou K, Sun Y. Effects of moisture on the ignition and combustion characteristics of lignite particles: Modeling and experimental study. ACS Omega. 2022;7(39):34912-34920
35.Leisure Line Stove Company. Anthracite Coal | Anthracite Coal Stove | Best Warmth. 2023. Available from: https://leisurelinestove.com/anthracite-coal/
36.Combustion Temperature—An Overview | ScienceDirect Topics. 2023. Available from: https://www.sciencedirect.com/topics/earth-and-planetary-sciences/combustion-temperature
37.Ash Content and Its Relevance with the Coal Grade and Environment in Bangladesh. 2023. Available from: https://www.ijser.org/paper/Ash-Content-and-Its-Relevance-with-the-Coal-Grade-and-Environment-in-Bangladesh.html
38.Zhao N, Li B, Ahmad R, Ding F, Zhou Y, Li G, et al. Dynamic relationships between real-time fuel moisture content and combustion-emission-performance characteristics of wood pellets in a top-lit updraft cookstove. Case Studies in Thermal Engineering. 2021;1(28):101484
39.Liquefied petroleum gas. In: Wikipedia. 2023. Available from: https://en.wikipedia.org/w/index.php?title=Liquefied_petroleum_gas&oldid=1167053430
40.US EPA O. About Diesel Fuels. 2015. Available from: https://www.epa.gov/diesel-fuel-standards/about-diesel-fuels
41.US EPA O. Basic Information about Oil and Natural Gas Air Pollution Standards. 2016. Available from: https://www.epa.gov/controlling-air-pollution-oil-and-natural-gas-industry/basic-information-about-oil-and-natural-gas
42.Grange SK, Farren NJ, Vaughan AR, Rose RA, Carslaw DC. Strong temperature dependence for light-duty diesel vehicle NOx emissions. Environmental Science & Technology. 2019;53(11):6587-6596
43.R S, Tm I, X R, M AES. Effect of ash content on the combustion process of simulated MSW in the fixed bed. Waste Management. 2016;48. Available from: https://pubmed.ncbi.nlm.nih.gov/26476592/
44.Faiz Y, Waheed S, Siddique N. Air quality assessment of faisalabad and Gujranwala Cities of Pakistan: Application of pollution indices. Nuclear Islamabad. 2015;52(2):55-62
45.Haider R, Yasar A, Tabinda A. Urban emission patterns at a semi-arid site in Lahore, Pakistan. Polish Journal of Environmental Studies. 2017;31(26):59-68
46.Ahmad M, Yu Q , Chen J, Cheng S, Qin W, Zhang Y. Chemical characteristics, oxidative potential, and sources of PM2.5 in wintertime in Lahore and Peshawar, Pakistan. Journal of Environmental Sciences. 2021;102:148-158
47.Javed W, Wexler AS, Murtaza G, Ahmad HR, Basra SMA. Spatial, temporal and size distribution of particulate matter and its chemical constituents in Faisalabad, Pakistan. Atmosfera. 2015;28(2):99-116
48.Sidra S, Ali Z, Ahmad Nasir Z, Colbeck I. Seasonal variation of fine particulate matter in residential micro–environments of Lahore, Pakistan. Atmospheric Pollution Research. 2015;6(5):797-804
49.Shahid I, Chishtie F, Shahid MZ, Shafique S, Lodhi A. State of air quality in twin cities of Pakistan; Islamabad and Rawalpindi. Atmosfera. 2019;1:32
50.Idress M, Nergis Y, Butt JA, Sharif M. Ambient air quality assessment in Karachi, Sindh Pakistan. International Journal of Economic and Environmental Geology. 2021;12(3):60-64
51.Zeb B, Alam K, Sorooshian A, Blaschke T, Ahmad I, Shahid I. On the morphology and composition of particulate matter in an urban environment. Aerosol and Air Quality Research. 2018;18(6):1431-1447
52.Alam K, Rahman N, Khan HU, Haq BS, Rahman S. Particulate matter and its source apportionment in Peshawar, Northern Pakistan. Aerosol and Air Quality Research. 2015;15(2):634-647
53.Ilyas SZ, Khattak AI, Nasir SM, Qurashi T, Durrani R. Air pollution assessment in urban areas and its impact on human health in the city of Quetta, Pakistan. Clean Technologies and Environmental Policy. 2010;12(3):291-299
54.Khan WA, Shah S, Shah S, Khan A. In Pakistan, the Transport and Urban Air Pollution Impacts on Human Health and Practical Steps to Avoid Them: A Review. 2022
55.Anjum MS, Ali SM, Imad-ud-din M, Subhani MA, Anwar MN, Nizami AS, et al. An emerged challenge of air pollution and ever-increasing particulate matter in Pakistan; A critical review. Journal of Hazardous Materials. 2021;15(402):123943
56.UNEP - UN Environment Programme. 2017 The Environment and Climate Change Outlook of Pakistan. Available from: http://www.unep.org/resources/report/environment-and-climate-change-outlook-pakistan
57.Li F, Ahmad R, Abbas M, Irfan M. Public awareness and willingness to pay for eliminating atmosphere pollution in Pakistan: A case study. Environment, Development and Sustainability. 2023;24:1-28
58.Ullah A, Khan D, Khan I, Zheng S. Does agricultural ecosystem cause environmental pollution in Pakistan? Promise and menace. Environmental Science and Pollution Research International. 2018;25(14):13938-13955
59.International Growth Centre. Stubble burning in Pakistan: Why it continues and how can it be curtailed? 2022. Available from: https://www.theigc.org/blogs/climate-priorities-developing-countries/stubble-burning-pakistan-why-it-continues-and-how-can
60.The Nation. 2022 Deforestation in Pakistan. Available from: https://www.nation.com.pk/24-Nov-2022/deforestation-in-pakistan
61.Tariq M, Aziz R. An Overview of Deforestation Causes and Its Environmental Hazards in Khyber Pukhtunkhwa. Journal of Natural Sciences Research. 2015;5(1):52-57
62.Tahir SNA, Rafique M, Alaamer AS. Biomass fuel burning and its implications: Deforestation and greenhouse gases emissions in Pakistan. Environmental Pollution. 2010;158(7):2490-2495
63.Asif M, Haq RAU, Gulfreen E, Arshad S, Tasleem MW, Rajpoot SR, et al. Particulate matter emission sources and their control technologies. Pollution Research. 2022;30:696-706
64.Karagoz I, Avci A, Surmen A, Sendogan O. Design and performance evaluation of a new cyclone separator. Journal of Aerosol Science. 2013;59:57-64
65.Poullikkas A. Review of design, operating, and financial considerations in flue gas desulfurization systems. Energy Technology and Policy. 2015;2(1):92-103
66.US EPA O. Chapter 2 - Selective Catalytic Reduction. 2017. Available from: https://www.epa.gov/economic-and-cost-analysis-air-pollution-regulations/chapter-2-selective-catalytic-reduction
67.Wu F, Wang M, Lu Y, Zhang X, Yang C. Catalytic removal of ozone and design of an ozone converter for the bleeding air purification of aircraft cabin. Building and Environment. 2017;115:25-33
68.Jin Y, Guo L, Veiga MC, Kennes C. Optimization of the treatment of carbon monoxide-polluted air in biofilters. Chemosphere. 2009;74(2):332-337
69.Our World in Data. How the World Eliminated Lead from Gasoline. 2023. Available from: https://ourworldindata.org/leaded-gasoline-phase-out
70.Hofverberg E. The History of the Elimination of Leaded Gasoline | The Library of Congress: In Custodia Legis. 2022. Available from: //blogs.loc.gov/law/2022/04/the-history-of-the-elimination-of-leaded-gasoline
Written By
Abdullah Nasir, Rana Ammar Aslam, Farhan Ali and Abdul Nasir
Submitted: 14 September 2023Reviewed: 21 November 2023Published: 15 January 2024
 Open access peer-reviewed chapter