Open Access is an initiative that aims to make scientific research freely available to all. To date our community has made over 100 million downloads. It’s based on principles of collaboration, unobstructed discovery, and, most importantly, scientific progression. As PhD students, we found it difficult to access the research we needed, so we decided to create a new Open Access publisher that levels the playing field for scientists across the world. How? By making research easy to access, and puts the academic needs of the researchers before the business interests of publishers.
We are a community of more than 103,000 authors and editors from 3,291 institutions spanning 160 countries, including Nobel Prize winners and some of the world’s most-cited researchers. Publishing on IntechOpen allows authors to earn citations and find new collaborators, meaning more people see your work not only from your own field of study, but from other related fields too.
Parameter Affinity Estimation of Rhizobacterial Cocktail Formulations for Hydrocarbon Degradation Using Locally Available Substrates in Crude Oil-Impacted Soil
Written By
Joseph E. Agbaji, Enobong Effiong and Godwin C. Iheanacho
Submitted: 31 August 2023Reviewed: 14 November 2023Published: 11 March 2024
To purchase hard copies of this book, please contact the representative in India:
CBS Publishers & Distributors Pvt. Ltd.
www.cbspd.com
|
customercare@cbspd.com
This chapter focuses on the estimation of parameter affinity in rhizobacterial cocktail formulations for bio-recovery of crude oil-impacted soil. The topic relied on a study investigating the utilization of locally available substrates in ecologically disturbed ecosystems, with a focus on the rhizosphere of weeds growing on aged crude oil-impacted soil in the Niger Delta region. The identified rhizobacterial isolates: Achromobacter agilis, Pseudomonas fluorescens, Bacillus thuringiensis, and Staphylococcus lentus, are renowned for significant biodegradative potentials. The researchers assessed the impact of different parameters on growth dynamics of these isolates. By utilizing agro-residues like corn chaff as carbon source, corn steep liquor for nitrogen, and poultry droppings for phosphorus, as sources of limiting nutrients, the researchers varied factors like nutrient availability, pH levels, and temperature to estimate the affinity of these parameters for growth formulations and bioremediation capabilities by fitting the substrate utilization data into a Growth Kinetics Models. Data obtained revealed the isolates’ affinity for different substrates and provide valuable insights for optimizing the composition and performance of rhizobacterial cocktails for efficient hydrocarbon degradation in crude oil-impacted soil. Additionally, they underscored the potential of locally available substrates and microbial flora as effective tools for bio-recovery of crude oil-impacted soil.
Institute of Natural Resources and Environment Sustainable Development, University of Port Harcourt, Nigeria
Enobong Effiong
Department of Microbiology, Hezekiah University, Umudi-Nkwerre, Imo State, Nigeria
Godwin C. Iheanacho
Department of Microbiology, University of Agriculture and Environmental Sciences, Umuagwo, Imo State, Nigeria
*Address all correspondence to: joseph.agbaji@gmail.com
1. Introduction
1.1 Rhizobacteria
Rhizobacteria comprise a diverse group of bacteria that confer numerous beneficial effects on plant health and growth. The rhizosphere, the region of the soil closely influenced by plant roots, creates a nutrient-rich environment or ecosystem that fosters a diverse array of bacteria and fungi, many of which exhibit potential benefits for plants.
In some peer-reviewed literature, these bacteria have been referred to as Plant Growth Promoting Rhizobacteria (PGPR) due to their proven capacity to mitigate the proliferation of pathogenic microorganisms detrimental to plant health [1, 2].
Primarily characterized as Gram-negative, rod-shaped bacteria, rhizobacteria often possess a single or no flagellum. They can exhibit aerobic chemoheterotrophic behavior, utilizing both organic and inorganic resources. A subset of these bacteria is capable of nitrogen fixation, either in a symbiotic or free-living capacity, thus contributing to plant nitrogen nutrition. Notable microbial species within this context include Trichoderma and Pseudomonas sp., recognized for their multifaceted roles encompassing antagonism, competition, and antibiosis [3]. Other significant taxa encompass Alcaligenes, Azospirillum, Arthrobacter, Acinetobacter, Azoarcus, Bradyrhizobium, Bacillus, Burkholderia, Enterobacter, Erwinia, Flavobacterium, Pantoea, Paenibacillus, Rhizobium Azorhizobium, Bradyrhizobium, All-orhizobium, Sinorhizobium, Methylobacterium, Frankia, and Mesorhizobium.
The functional range of some of these rhizobacterial strains encompasses abiotic stress tolerance, enzymatic production, synthesis of organic compounds, nutrient solubilization to facilitate plant uptake, modulation of plant growth regulators, and the synthesis of Siderophores [4, 5, 6]. Moreover, during the process of nodulation in plants, select bacterial strains actively contribute to nitrogen fixation [4]. According to Becker et al. [7], these bacterial communities constitute a pivotal niche within the phytomicrobiome of most plants, forming an intricately interwoven and structured microcosm inhabited by terrestrial organisms adeptly adapted to their environment. However, the thriving of these microorganisms in their respective niches is influenced by a range of factors, including the availability of essential nutrients required for metabolic activities in proximity to plant roots. In return, plants influence the rhizobacterial community through the exudation of chemical compounds, a process that can exert both antagonistic and stimulatory effects [7, 8, 9].
Furthermore, Kumar et al. [10] suggest that the realm of rhizobacteria encompasses a spectrum of microorganisms, encompassing not only saprophytes, but also endophytes, epiphytes, pathogens, and numerous beneficial microbes. A subset of these microorganisms, referred to as intracellular Plant Growth Promoters or rhizomicrobiota, engages in direct interactions with plants by existing as endophytes. Concurrently, a substantial portion of these microbes flourish outside plant tissues, collectively referred to as exophytes. This group populates the exterior of plant roots, constituting a diverse community across the rhizoplane, rhizosphere, and phyllosphere [11].
Bioremediation represents an advanced form of biodegradation and biomineralization, wherein living organisms, encompassing plants and animals, alongside their derivatives, are harnessed to diminish or transform harmful substances into less hazardous and more valuable forms [12, 13]. Predominantly, microbes and their metabolic products have been harnessed for the mitigation of deleterious pollutants in the environment [14]. This technology is recognized for its cost-effectiveness, eco-friendliness, technological viability, and scalability. These attributes have been pivotal in driving the attention and engagement of environmental enthusiasts worldwide.
Whilst bioremediation techniques have often been lauded for their cost-efficiency [15], it is noteworthy that certain costs may be incurred due to factors such as mechanical and chemical treatments, containment, procurement of exogenous strains, nutrients, and suitable substrates, as well as the application of surfactants. Contemporary strategies like landfilling and land farming have influenced the scalability of the process, particularly in cases involving the physical management of pollution [16]. Nevertheless, when juxtaposed against conventional methodologies, these approaches tend to be more economical [17, 18]. The categories of these technologies exhibit minimal intrusion or disruption of the environmental framework and can be classified as Ex-situ and In-situ, predicated on the treatment location and technological prerequisites. The former may necessitate pollutant excavation to an alternative site for potential treatment, whereas the In-situ approach is characterized by non-invasive interventions. Notably, the treatment of most organic pollutants occurs on-site, rendering it less obtrusive and more manageable—referred to as In-Situ treatment technology (On-site). In instances involving groundwater treatment, a technical methodology such as pump-and-treat is employed (Off-site Treatment Technology).
Interactions between pollutants and the speciation of concern can disrupt the physicochemical attributes of environmental matrices, potentially leading to nutrient leaching [19, 20, 21]. The integration of indigenous organisms, with minimal human intervention [13]—often termed nature-assisted treatment—has spurred innovations in Remediation by Natural Attenuation (RENA). The degradation efficiency and kinetics of hydrocarbons tend to follow a sequence: n-alkanes → branched alkanes → low molecular weight aromatics → cycloalkanes → polycyclic aromatics [22]. Whilst various microbes partially oxidize aliphatic hydrocarbons, complete metabolism is facilitated by Flavobacterium and select members of the Gammaproteobacteria. Cyclic hydrocarbons, including benzene, might exhibit steric hindrances that influence their responsiveness to bioremediation technologies.
The concept of the rhizobacterial cocktail involves the formulation of exogenous microbial consortia tailored to fulfil nutrient and microbial requisites within diverse biotechnological contexts. Developing a rhizobacterial cocktail necessitates rigorous screening, strain selection, optimization of nutritional provisions, and the incorporation of delivery technologies [12]. In a related study, Shinwari et al. [23] engineered a system employing a consortium of rhizobacterial cultures to remediate metal-impacted soil. These formulations can be administered via batch or feed-batch strategies, effectively catering to specific environmental objectives, such as bioremediation or the degradation of intricate compounds. Bioaugmentation and biostimulation constitute pivotal strategies underpinning cocktail development.
The intensification of industrialization, population growth, and routine human activities has led to an increased demand for secure and cheaper energy source like petroleum hydrocarbon or crude oil, a high carbon polluting source to several media [24, 25]. Pollution, in its essence, represents the inadvertent introduction of harmful and unwanted toxic substances into the environment. Any substance capable of inducing detrimental effects on living organisms is appropriately classified as a pollutant.
Pollutants are categorized into organic or inorganic classes based on their underlying chemical composition [26]. Inorganic pollutants, comprising heavy metals and radioactive isotopes, are non-biodegradable, whilst organic pollutants are biodegradable. A pollutant can trigger a range of adverse effects, encompassing teratogenic, carcinogenic, mutagenic, and other severe deleterious outcomes. Notably, the residues of certain concerning pollutants exhibit recalcitrance or persistence within the environment, subsequently impeding the recovery of polluted matrices [27]. The persistence of pollutants in the environment is intrinsically linked to their xenobiotic nature, allowing them to endure over time.
Crude oil stands as a pivotal economic driver for numerous nations. Incidents of oil leaks and spills are frequently attributed to various activities including drilling, transportation, distribution, and storage [17]. Instances such as oil well blowouts, tanker accidents, and pipeline vandalism contribute to the release of over 0.5% of produced oil back into ecosystems as pollutants [28]. Notably, the Niger Delta region of Nigeria has emerged as a significant hub for soil and water pollution, arising from both exploration and exploitation activities [29]. This extensive pollution has led to the substantial depletion of the region’s natural diversity.
Scientific evidence attests that certain organisms, particularly higher plants, synthesize hydrocarbons in various forms, such as waxes, exudates, oils, and organic materials. Whilst these compounds contribute to the overall hydrocarbon content of the soil, they have minimal impact on the biogenic levels of soil hydrocarbon content [30, 31]. Numerous reports have documented the detrimental effects of various spills on the biodiversity of affected ecosystems [32]. These spill-related incidents are largely attributed to anthropogenic factors, often stemming from the failure of transport infrastructure, such as pipelines or acts of deliberate sabotage.
The pollution of arable land exerts negative repercussions on crop yield, fertility, and productivity [33, 34, 35]. Uquetan et al. [36] have identified the influence of crude oil and hydrocarbons on crop productivity and yield. They emphasize that hydrocarbons within crude oil-contaminated soil disrupt the soil’s physical, chemical [37], and microbiological [13, 38, 39, 40] properties. These disruptions significantly contribute to diminished crop productivity, particularly impacting the functional roles of soil organisms. Chukwu and Udoh report that concentrations of crude oil exceeding 3% w/w in any medium can result in the loss of metabolic capabilities in animals and plants. Enzyme activity inhibition can consequently hinder the growth of vital cash crops, such as maize, cassava, and vegetables. The study conducted by Udoh and Chukwu [37] highlights the significant influence of hydrocarbons on soil physicochemical attributes. Consequently, the decline of soil’s rich biodiversity, as measured over time, is elucidated in their study, which compares results from investigations in 2020 and 2008 to evaluate the potential utility of soil pre-exposed to pollution. The study reveals that the impact of soil pollution diminishes with time, concurrent with a reduction in the intensity of impact.
4. Isolate selection: rhizobacterial flora in crude oil-impacted soil
Strain selection serves as a critical process aimed at harnessing specific microbes with superior potential for generating desired products at enhanced yields compared to their counterparts. Distinct reference benchmarks and methodologies are deployed to differentiate these strains from the myriad of other microorganisms coexisting within their habitat. Often, these strains occupy analogous niches within their microenvironment [41]. This procedure has emerged as a pivotal strategy in the field of bioaugmentation.
The isolation and selection of strains from the rhizosphere region of plants necessitate that bacteria originate from the root vicinity, thus precluding the inadvertent isolation of non-target organisms. This process mandates the utilization of batch enrichment procedures. The utilization of plants possessing robust phytoremediation attributes offers a valuable avenue for isolating bacterial strains that exhibit a heightened potential for hydrocarbon degradation or an adeptness to survive on exudates and waxes. Contemporary techniques include the use of enzyme assays or nucleic acid presence to discern the composition of rhizobacterial flora. Microbial strains may actively (assimilatory) or passively (dissimilatory) partake in the processes of degradation or fermentation.
Agro-waste, also referred to as agro-residues, refers to the byproducts stemming from agricultural processes, which may lack inherent value or utility in the final product. Agricultural waste, synonymous with “agro-waste” or agro-residues, encompasses spent materials originating from the processing of food, food products, animals, and animal products. Primarily comprised of plant materials, these byproducts result from their transformation into more valuable derivatives. The concept of recycling and repurposing these bioresources has not been fully embraced, signaling that the challenges arising from inadequate waste management in developing countries are far from resolved [42].
Manures, plant chaff, stalks, and leaves stand as archetypal instances of agro-waste, often discarded or rarely repurposed. Many of these agro-residues encompass relatively insoluble biopolymers like cellulose and lignin, alongside soluble components including biomolecules and their constituent units [43]. Mismanagement of agro-waste poses risks of environmental degradation, health issues, and diminished esthetic value [44]. Within the agro-industry, substantial quantities of waste and residues are generated, presenting significant waste management challenges for these facilities. Strategies such as burning, burying, dumping, and landfilling are commonly employed for handling these agro-residues [45].
Characterized by their composition, agro-waste harbors appreciable nutritional and anti-nutritional elements that remain untapped [46]. Numerous food industries produce substantial volumes of agro-waste, with noteworthy examples including pomegranate peels, lemon peels, green walnut husks, and palm kernel shells. A wide array of organic waste holds potential for bioenergy production and serves as a medium amendment for cultivating valuable resources. The ascendancy of agro-waste as feedstocks and substrates for microbial product synthesis underscores their capacity to provide essential nutrients [40, 47]. Biotechnological applications leverage agro-waste for nutrient supply in biostimulation processes, as immobilization matrices for starter cultures or inocula, and as supplements for lipid biosynthesis [48]. Notable materials, including banana peels, yam peels, potato peels, cassava peels, rice husks, sugarcane bagasse, and oil palm residues, serve as sources of carbon whilst concurrently acting as conditioners and absorbents (Table 1) [56, 57].
Carbon stands as one of the most abundant elements in nature, existing in both organic and inorganic forms. Plant-derived carbon sources are readily accessible, particularly from carbohydrate-rich food products. Cereal-derived waste emerges as a practical and cost-effective reservoir of carbohydrates, thus serving as an essential carbon source. Cereal varieties such as wheat, rice, maize, oat, millet, barley, rye, and sorghum boast lignocellulosic biomass, presenting a cost-efficient carbon pool for diverse industrial applications, including microbial metabolism stimulation and fermentation processes [58]. Notably, wheat bran, derived from wheat processing, embodies the fibrous outer pericarp layer of wheat grains left after milling. This material is rich in complex polysaccharides, such as cellulose, hemicellulose, and pentosan, thus serving as valuable carbon proxies [59]. Rice bran’s proximate composition showcases its carbohydrate content (34–62%) and crude fiber (7–11%) [58, 60]. Additionally, sugarcane bagasse constitutes a carbon reservoir with cellulose (45%), hemicellulose (32%), and lignin (17%) [61].
6.2 Nitrogen
Bacteria contribute to the fixation of nitrogen, which plants absorb in the form of nitrates for synthesizing proteins and other essential macromolecules. Fixed nitrate and ammonia play pivotal roles in animal nutrition, particularly in algae and higher plant metabolism. Urea emerges as a highly accessible nitrogen source, reacting with water to produce ammonia, thus rendering the enclosed nitrogen available to plants. Nitrate originating from urea serves as a bioavailable and readily utilizable nitrogen source in various bioprocesses. Notably, run-off from animal farms remains a sought-after reservoir of nitrates and phosphates due to the prevalence of sewage, atmospheric deposition, urban run-off, and industrial wastewater in these effluents [62]. Improper management of nitrate and phosphate-rich sources can result in surface water eutrophication [63].
6.3 Phosphate
Phosphate, a fundamental component of fertilizers, is ubiquitously present in rocks and can be found in soil pre-exposed to leaching or pollution from industrial activities. This nutrient plays a pivotal role in the growth of plants and animals, influencing cell division and metabolism, and constitutes a key component of nucleic acids. Seepage from phosphate-rich effluents has been implicated in causing algal blooms [64, 65, 66], and on soil, it can lead to serious health hazards. Valuable sources of phosphate within agro-waste include wheat bran, bone char, and cow dung ash. Both industrial and domestic effluents have been recognized as phosphate sources, with potential implications for water pollution [67]. As highlighted by Fuentes et al. [68], elevated phosphate levels in water can precipitate toxin proliferation, leading to adverse health effects, such as kidney damage and osteoporosis. Additionally, algal biomass, particularly digestate, has been identified as another phosphate-rich feedstock (Tables 2 and 3).
7. Theoretical model for determining kinetic parameters of bacterial growth in batch culture
In laboratory setting, the growth kinetics parameters of rhizobacteria [7] were determined through the assessment of total viable counts and incubation durations using first-order kinetics. Batch culture, conducted within a closed system containing a limited initial substrate, facilitated the exploration of microbial growth behavior [19]. The study employed an inocula of rhizobacteria, which was introduced into a Bushnell Haas medium (Mineral Salt Medium), supplemented with 1.0 ml crude oil as the sole carbon source to align with the kinetics. The inoculated rhizobacteria were monitored across growth phases, with cell biomass and growth indices displaying exponential increments at a constant maximum rate during the log phase [7]. The specific growth rate was determined by the linear gradient of a sigmoidal growth-versus-time plot [69, 70].
Mathematically, the first-order rate equation is given by:
r=dNdt=μNE1
where, N = Microbial biomass (CFU/ml), t = the time/duration (hours), and μ = specific growth rate of (hours−1).
Integration of Eq. (1), within the limit; at t = 0, N = N0 and at t = t, N = N:
ln(N/N0)=μtE2
To deduce the specific growth rate (μ) of rhizobacterial isolates for each batch culture, an amendment of 1.0% w/w crude oil was made to simulate the pollutant. The graph of ln(N/N0) against time t was plotted, and the slope determined the specific growth rate at the initial crude oil concentration. The generation time (tg), representing the time for cell number to double, was calculated from Eq. (2) as:
When N = 2 N0; t – t0 equal tg. Substituting for N and t, Eq. (2) becomes
tg=ln2/μ=0.693/μE3
7.1 Effects of substrate utilization on kinetic parameters of bacterial growth model
The study explored the impact of varying concentrations of corn chaff substrate (0.0 to 25.0 gL−1), corn steep liquor (0 to 50% v/v), and poultry droppings (0.0 to 2.5 gL−1) on kinetic parameters. These agro-waste concentrations were employed as substrates for cultivating Achromobacter agilis, Pseudomonas fluorescens, Bacillus thuringiensis, and Staphylococcus lentus, with their specific growth rates calculated. The intrinsic physiological properties of microorganisms depend on the substrate and growth temperature [71]. This study highlighted the use of agro-waste for rhizobacterial cultivation, demonstrating their high affinity and growth rate using agro-substrates. Carbon substrate (corn chaff), nitrogen substrate (corn steep liquor), and phosphorus substrate (poultry droppings) served as limiting nutrients, incorporated in the mineral salt medium.
A decline in growth rate and cessation due to substrate depletion were characterized using the Monod equation, introduced by Jacques Monod in 1942. This model relates specific growth rate (μ) to residual growth-limiting substrate (S) concentration, represented as:
μ=μmsks+sE4
Here, μ and μm denote specific growth rate and maximum specific growth rate, respectively, whilst S signifies substrate concentration, and Ks represents substrate saturation or utilization constant.
This study was designed to identify agro-waste utilization by rhizobacterial cultivation and estimation of the maximum specific growth rate (μm), and KS, the half-saturation or utilization constant, which is defined as the substrate concentration at which growth occurs at one-half the value of μm and is a demonstration of high growth affinity of the organism for agro-substrates.
Both μm and KS reflect the organism’s intrinsic properties, substrate, and growth temperature.
This equation corresponds to the Lineweaver-Burk plot. For each agro-waste substrate utilizer, a plot of the inverse of the specific growth rate (1/μ) against the inverse of the initial substrate concentration (1/S) was constructed. The resulting slope and intercept were used to estimate maximum specific growth rates and substrate saturation constants. The study’s findings encompassed various growth phases, with observed dynamics contributing to a comprehensive understanding of bacterial growth behavior.
8. A case study of the iterations of agro-waste on rhizobacterial growth rate
8.1 Kinetic of bacterial growth rate analysis
The hydrocarbon degradative potential of the bacterial isolates was assessed using both viable plate count and optical density (OD) methods, as illustrated in Figure 1. The bacterial strains employed in this investigation encompass Achromobacter agilis, Pseudomonas fluorescens, Bacillus thuringiensis, and Staphylococcus lentus.
A graphical representation of the growth dynamics is presented in Figure 1, depicting the cell count or biomass concentration of the aforementioned bacterial isolates measured in colony-forming units (cfu/ml) and optical density (OD) across time in hours. The semi-logarithmic plot provides insights into the different growth phases—lag, log, stationary, and death. The lag phase, although not overt, can be attributed to the bacteria’s physiological adaptation from prior subcultures and the presence of a substantial initial inoculum size [71]. Notably, the lag time for bacterial growth ranges from zero to a few hours of incubation time. Furthermore, the stationary phase, aligning with the asymptote where bacterial biomass reaches its maximum, occurs around day five to six. This observation is of significance in light of the achieved half-life of 6 days after a 56-day treatment of hydrocarbon-polluted soil using a bioremediation cocktail formulated from these isolates.
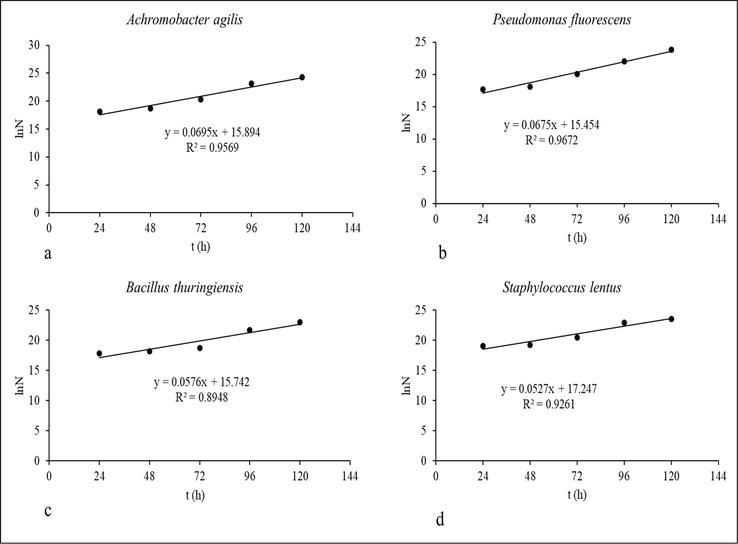
8.1.1 The experimental growth rate model
The exponential growth phase’s experimental growth rate of biomass within the batch system was characterized by Eq. 2: ln(N/N0) = μt = > lnN = lnN0 + μt, where the linear equation’s slope equates to the specific growth rate. Applying this equation to the colony-forming unit data from Figure 1 yields the linear plot displayed in Figure 2. In this context, the specific growth rate (μ) of each isolate is identical to the slope of its corresponding growth model’s linear equation.
Figure 2.
Exponential growth logarithm vs. time (source: Author study-Agbaji [19]).
8.1.2 Calculation of generation time and kinetic parameters
Utilizing Eq. 3, with the specific growth rate, the generation time was computed. The results of these computations, along with the lag time (λ) and asymptote (A) derived from the semi-logarithmic plot in Figure 1, were summarized in Table 4. The summary highlights the specific growth rates of bacterial isolates in Bonny light crude oil, following the order: Achromobacter agilis > Pseudomonas fluorescens > Bacillus thuringiensis > Staphylococcus lentus. This sequence also correlates with the isolates’ generation times. Notably, Pseudomonas fluorescens exhibits the shortest lag time, followed by Achromobacter agilis, Bacillus thuringiensis, and Staphylococcus lentus. Concerning the asymptote, representing the stationary phase characterized by maximum bacterial biomass, Achromobacter agilis displays the highest biomass, succeeded by Pseudomonas fluorescens, Staphylococcus lentus, and Bacillus thuringiensis.
μ
tg
λ
Asymptote
R2
h−1
h
h
Cfu/ml
Value
Achromobacter agilis
0.070
9.973
13.8
3.42E+10
0.957
Pseudomonas fluorescens
0.068
10.269
12.6
2.15E+10
0.967
Bacillus thuringiensis
0.058
12.034
15.4
1.41E+10
0.895
Staphylococcus lentus
0.053
13.153
17.5
1.67E+10
0.926
Table 4.
Summary of estimated kinetic parameters of batch bacterial growth model.
μ = specific growth rate; tg = generation time; λ = lag time of growth, and R2 = goodness of best fit.
A graphical representation of the natural logarithm versus time for the exponential growth of the bacterial isolates is shown in Figure 2. The slope of each line within the graph corresponds to the specific growth rate (μ).
8.2 Growth responses of rhizobacterial species using agro-waste substrate
The preceding Section 8.1 presents the laboratory experimental results that underpin the parameter estimation process. These experiments were conducted using high-grade laboratory nutrients as sources, laying the foundation for the subsequent selection of rhizobacterial species with significant growth potential. However, in the context of this study chapter, these laboratory-grade limiting nutrients were replaced with nutrients sourced from agro-waste materials. This innovative approach allows the study to estimate the parameter affinity of the selected rhizobacteria for these agro-waste substrates, thereby bridging the gap between controlled laboratory conditions and real-world application scenarios.
8.2.1 Growth responses of rhizobacterial species using corn chaff as the sole carbon source
The influence of initial corn chaff concentrations, ranging from 0.0 to 2.5 g dL−1 as delineated in Table 5, was investigated to ascertain its impact on the growth indices of rhizobacterial strains. Specifically, this analysis encompassed Achromobacter agilis, Pseudomonas fluorescens, Bacillus thuringiensis, and Staphylococcus lentus. The variation in initial corn chaff concentrations served as a basis for evaluating the specific growth rate of these rhizobacteria. The resultant specific growth rate data obtained from the bacterial isolates cultivated on corn chaff substrate are tabulated in Table 5 and subsequently depicted in the Monod model plot presented in Figure 3.
Carbon substrate (Corn Chaff)
Achromobacter agilis
Pseudomonas fluorescens
Bacillus thuringiensis
Staphylococcus lentus
(Scc) Conc.
μ
μ
μ
μ
g dL−1
h−1
h−1
h−1
h−1
0.0
0.0000
0.0000
0.0000
0.0000
0.5
0.0539
0.0644
0.0494
0.0679
1.0
0.0619
0.0694
0.055
0.0712
1.5
0.0629
0.0718
0.0586
0.0742
2.0
0.0643
0.0773
0.0598
0.0759
2.5
0.0559
0.0592
0.0588
0.0626
Table 5.
Varied carbon substrate concentrations (corn chaff) and corresponding specific growth rate (μ) values for Rhizobacterial isolates, applied in the formulation of bioremediation cocktail.
Scc = corn chaff substrate; h = hour; g = gram; dL = deciLitre.
Impact of carbon substrate (corn chaff) on growth patterns of Rhizobacterial isolates (source: Author study- Agbaji [19]).
Figure 3 illustrates the intricate interplay between the carbon substrate, represented by corn chaff, and the growth behavior exhibited by the individual rhizobacterial isolates—namely, (a) Achromobacter agilis, (b) Pseudomonas fluorescens, (c) Bacillus thuringiensis, and (d) Staphylococcus lentus. This graphical representation is a visualization of the Monod model plot.
8.2.2 Growth responses of rhizobacterial species using corn steep liquor as the sole nitrogen source
In this phase of investigation, the focus shifted to evaluating the impact of initial corn steep liquor concentrations, spanning from 0 to 50 ml dL−1 as delineated in Table 6, on the growth indices of specific rhizobacterial strains. The rhizobacterial isolates subjected to analysis encompassed Achromobacter agilis, Pseudomonas fluorescens, Bacillus thuringiensis, and Staphylococcus lentus. This experimental approach aimed to scrutinize the relationship between initial corn steep liquor concentrations and the specific growth rate exhibited by the aforementioned bacterial isolates. The resulting specific growth rate data, obtained from the bacterial isolates’ utilization of corn steep liquor as a nitrogen substrate, are methodically presented in Table 6. This dataset served as the foundation for the ensuing construction of the Monod model plot illustrated in Figure 4.
Nitrogen substrate (Corn Steep Liquor)
Achromobacter agilis
Pseudomonas fluorescens
Bacillus thuringiensis
Staphylococcus lentus
(Scsl) Conc.
μ
μ
μ
μ
ml dL−1
h−1
h−1
h−1
h−1
0
0.0000
0.0000
0.0000
0.0000
10
0.0818
0.0648
0.0505
0.0477
20
0.0890
0.0840
0.0720
0.0636
30
0.0668
0.0707
0.0681
0.0524
40
0.0638
0.0613
0.0668
0.0496
50
0.0418
0.0581
0.0658
0.0460
Table 6.
Varied nitrogen substrate concentrations (corn steep liquor) and corresponding specific growth rate (μ) values for Rhizobacterial isolates, applied in the formulation of bioremediation cocktail.
Scsl = corn steep liquor; substrate; h = hour; ml = milliliter; dL = deciLitre.
Impact of nitrogen substrate (corn steep liquor) on growth patterns of Rhizobacterial isolates (source: Author study-Agbaji [19]).
Figure 4 visually portrays the intricate interplay between the nitrogen substrate, represented by corn steep liquor, and the ensuing growth patterns exhibited by individual rhizobacterial isolates—specifically, (a) Achromobacter agilis, (b) Pseudomonas fluorescens, (c) Bacillus thuringiensis, and (d) Staphylococcus lentus. This visual representation is a realization of the Monod model plot, elucidating the dynamic relationship between initial corn steep liquor concentrations and the growth behavior of these isolates.
8.2.3 Growth responses of rhizobacterial species using poultry droppings as the exclusive phosphorus source
In the context of this segment, the investigation turned its focus towards comprehending the impact of varying initial concentrations of poultry droppings, ranging from 0.0 to 0.25 g dL−1 as illustrated in Table 7, on the growth indices of specific rhizobacterial strains. The selected bacterial isolates subjected to analysis were Achromobacter agilis, Pseudomonas fluorescens, Bacillus thuringiensis, and Staphylococcus lentus. The primary objective was to scrutinize the relationship between the initial concentration of poultry droppings and the specific growth rate exhibited by these diverse bacterial isolates. The resultant specific growth rate data arising from the utilization of poultry droppings as a phosphorus substrate by the bacterial isolates were methodically documented in Table 7. These data points were subsequently plotted against the respective initial concentrations of poultry droppings, culminating in the construction of the Monod model plot portrayed in Figure 5. The graphical representation provided by Figure 5 depicts a characteristic trend, wherein the specific growth rate exhibited an upward trajectory concomitant with the escalation of the initial concentration of poultry droppings.
Phosphorus substrate (Poultry droppings)
Achromobacter agilis
Pseudomonas fluorescens
Bacillus thuringiensis
Staphylococcus lentus
(Spd) Conc.
μ
μ
μ
μ
g dL−1
h−1
h−1
h−1
h−1
0.00
0.0000
0.0000
0.0000
0.0000
0.05
0.0497
0.0591
0.0580
0.0472
0.10
0.0630
0.0626
0.0628
0.0580
0.15
0.0727
0.0636
0.0647
0.0636
0.20
0.0755
0.0680
0.0666
0.0641
0.25
0.0783
0.0688
0.0672
0.0654
Table 7.
Varied phosphorus substrate concentrations (poultry droppings) and corresponding specific growth rate (μ) values for Rhizobacterial isolates, employed in the formulation of bioremediation cocktail.
Spd = poultry droppings substrate; h = hour; g = gram; dL = deciLitre.
Figure 5.
Influence of phosphorus substrate (poultry droppings) on growth patterns of Rhizobacterial isolates (source: Author study-Agbaji [19]).
Figure 5 visually conveys the intricate interplay between the phosphorus substrate, represented by poultry droppings, and the ensuing growth patterns manifested by individual rhizobacterial isolates—namely, (a) Achromobacter agilis, (b) Pseudomonas fluorescens, (c) Bacillus thuringiensis, and (d) Staphylococcus lentus. This graphical representation serves as a tangible embodiment of the Monod model plot, elucidating the dynamic relationship between initial poultry droppings concentrations and the growth behavior of these isolates. Notably, the graphical trend showcases a discernible elevation in specific growth rate in tandem with the increasing initial concentration of poultry droppings.
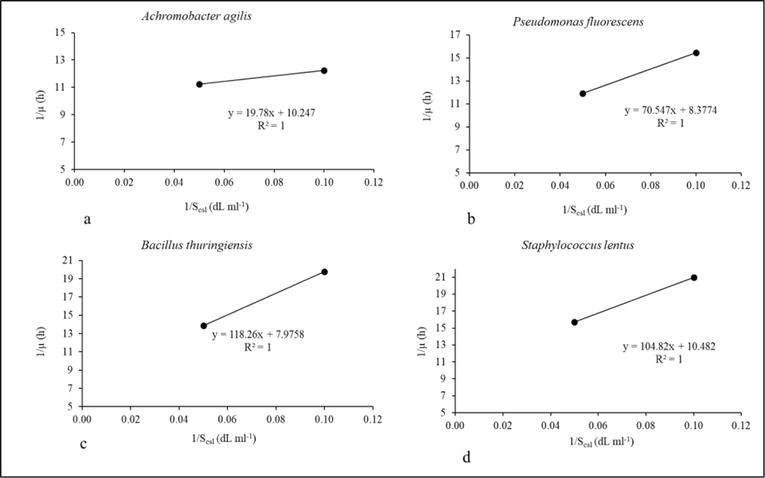
8.3 Estimation of kinetic parameters using the Monod model
The pursuit of estimating the fundamental kinetic parameters, namely the maximum specific growth rate (μm) and the substrate utilization constant (KS), as defined in Eq. 4, necessitated the conversion of the datasets from Tables 5–7 into a corresponding set of values tabulated in Tables 8–10. Subsequently, these derived values were employed to generate graphical representations conforming to the Lineweaver-Burk equation (Eq. 5), offering valuable insights into the parameter affinities. The implications of this process are encapsulated within the Lineweaver-Burk plots presented in Figures 6–8. These plots predominantly capture data points representative of the exponential growth phase, aligning with the observations gleaned from the Monod model plots illustrated in Figures 3–5, exclusively for each distinct agro-waste substrate (Table 11).
Carbon (Corn chaff)
Achromobacter agilis
Pseudomonas fluorescens
Bacillus thuringiensis
Staphylococcus lentus
1/Scc
1/μ
1/μ
1/μ
1/μ
dL g−1
h
h
h
h
0.00
0.000
0.000
0.000
0.000
2.00
18.553
15.528
20.243
14.728
1.00
16.155
14.409
18.182
14.045
0.67
15.898
13.928
17.065
13.477
0.50
15.552
12.937
16.722
13.175
0.40
17.889
16.892
17.007
15.974
Table 8.
Inverted values of the range of initial carbon (corn chaff) substrate concentration and their specific growth rates (μ) values from the results of Table 5.
Inverted values of the range of initial nitrogen (corn steep liquor) substrate concentration and their specific growth rates (μ) values from the results of Table 6.
Scsl = corn steep liquor substrate; h = hour; ml = milliliter; dL = deciLitre.
Inverted values of the range of initial phosphorus (poultry droppings) substrate concentration and their specific growth rates (μ) values from the results of Table 7.
The Lineweaver-Burk plot for the estimation of μm and KS from the intercept and slope of the linear equation (corn chaff) (source: Author study-Agbaji [19]).
Figure 7.
The Lineweaver-Burk plot for the estimation of μm and KS from the intercept and slope of the linear equation (corn steep liquor) (source: Author study-Agbaji [19]).
Figure 8.
The Lineweaver-Burk plot for the estimation of μm and KS from the intercept and slope of the linear equation (poultry droppings). (source: Author study-Agbaji [19]).
Carbon substrate
μm
KS
R2 Value
Corn Chaff
h−1
g dL−1
Achromobacter agilis
0.069
0.139
0.978
Pseudomonas fluorescens
0.079
0.120
0.893
Bacillus thuringiensis
0.063
0.140
0.975
Staphylococcus lentus
0.078
0.077
0.943
Table 11.
Parameter affinity estimates; maximum specific growth rate (μm) and substrate utilization constant (KS) for bacterial utilization of corn chaff as a carbon nutrient source.
8.3.1 Interpretation of parameter affinity from the Monod and Lineweaver-Burk plots
The analysis of the estimated kinetic parameters, derived from both the Monod and Lineweaver-Burk plots, provides significant insights into the substrate affinities and growth characteristics of the bacterial isolates under various agro-waste substrates. The affinities of the bacterial isolates for different substrates are detailed below:
For Corn Chaff as the Carbon Source (Table 11): The calculated KS values in Table 11 illustrate that the bacterial isolates exhibit a pronounced affinity for corn chaff as a carbon substrate. The order of affinity is found to be Staphylococcus lentus > Pseudomonas fluorescens > Achromobacter agilis > Bacillus thuringiensis. Remarkably, Pseudomonas fluorescens exhibits the highest maximum specific growth rate, followed by Staphylococcus lentus, Achromobacter agilis, and then Bacillus thuringiensis.
For Corn Steep Liquor as the Nitrogen Source (Table 12): In contrast, Table 12 demonstrates considerably higher KS values, indicative of diminished affinity for corn steep liquor as a nitrogen substrate. Bacillus thuringiensis displays the highest maximum specific growth rate amongst the bacterial isolates, followed by Pseudomonas fluorescens, Achromobacter agilis, and Staphylococcus lentus in sequence. The kinetic values underscore the variations in these indices as predictive factors for modeling the bioremediation potential of the bacterial isolates in hydrocarbon-polluted soil.
Nitrogen substrate
μm
KS
R2 Value
Corn steep liquor
h−1
ml dL−1
Achromobacter agilis
0.098
1.930
1.0
Pseudomonas fluorescens
0.119
8.421
1.0
Bacillus thuringiensis
0.125
14.827
1.0
Staphylococcus lentus
0.095
10.000
1.0
Table 12.
Estimated maximum specific growth rate (μm) and substrate utilization constant (KS) for bacterial utilization of corn steep liquor as nitrogen nutrient source.
For Poultry Droppings as the Phosphorus Source (Table 13): The analysis of Table 13 unveils low KS values, signifying a robust affinity for poultry droppings as a phosphorus substrate. The hierarchy of affinity is Pseudomonas fluorescens > Bacillus thuringiensis > Staphylococcus lentus > Achromobacter agilis. Achromobacter agilis, however, demonstrates a comparatively higher growth rate in comparison to the other three isolates.
Phosphorus substrate
μm
KS
R2 Value
Poultry droppings
h−1
g dL−1
Achromobacter agilis
0.092
0.043
0.995
Pseudomonas fluorescens
0.070
0.010
0.859
Bacillus thuringiensis
0.070
0.010
0.990
Staphylococcus lentus
0.074
0.028
0.991
Table 13.
Estimated maximum specific growth rate (μm) and substrate utilization constant (KS) for bacterial utilization of poultry droppings as phosphorus nutrient source.
Observations from the Monod and Lineweaver-Burk plots: The Monod model, depicted in Figure 3, indicates that Achromobacter agilis, Pseudomonas fluorescens, Bacillus thuringiensis, and Staphylococcus lentus all exhibit a strong affinity for corn chaff as a carbon substrate. Notably, within the concentration range beyond 0.5 to 2.0 g dL−1, the substrate concentration surpasses requirements, leading to maximal growth at the specific growth rate (μm) and representing the exponential growth phase of bacterial dynamics.
Similarly, Figure 4 illustrates that the bacterial isolates manifest limited affinity for corn steep liquor as a nitrogen source. Specifically, concentrations above 10 ml dL−1 for Achromobacter agilis and 20 ml dL−1 for Pseudomonas fluorescens, Bacillus thuringiensis, and Staphylococcus lentus indicate excessive substrate levels, inducing growth at the maximum specific growth rate (μm), characteristic of the exponential growth phase.
Finally, Figure 5 highlights the propensity of Achromobacter agilis, Pseudomonas fluorescens, Bacillus thuringiensis, and Staphylococcus lentus to prefer poultry droppings as a phosphorus substrate. Within the range of 0.05 to 0.25 g dL−1, the substrate concentration sufficiently meets the demands for maximum growth rate (μm), representing the exponential growth phase. Conversely, concentrations below 0.05 g dL−1 are limiting and inadequate to sustain growth at the maximal specific growth rate (μm).
In the face of persistent global environmental pollution, stemming from improper waste disposal and inadvertent pollutant release, innovative solutions are essential. The culmination of the research in this book chapter has illuminated the potential of bioremediation cocktails, comprising rhizobacterial flora sourced from impacted areas and readily available agro-waste materials, as a practical and cost-effective strategy for addressing contamination challenges. By amalgamating insights from various facets of study, we can draw comprehensive conclusions that underscore the significance and versatility of this approach.
The study investigation delved into the critical process of isolating and selecting strains of rhizobacteria from crude oil-impacted soil. This stringent procedure involved careful consideration of factors, such as niche specificity, growth kinetics, and hydrocarbon-degrading potential. Through meticulous strain selection, the study demonstrated the pivotal role of rhizobacteria in bioaugmentation, presenting a promising avenue for eco-recovery efforts.
The utilization of agro-waste as substrates for bioremediation has emerged as a practical means to address waste management challenges whilst simultaneously fostering microbial growth. This novel approach capitalizes on the abundant organic matter present in materials like corn chaff, poultry droppings, and corn steep liquor. The study investigations have unveiled the intricate interplay between agro-waste composition, microbial growth kinetics, and pollutant degradation potential. The identification of optimal concentrations for corn chaff, corn steep liquor, and poultry droppings further refines our understanding of the potential of these substrates as drivers of efficient bioremediation.
Central to the study research is the determination of kinetic parameters for bacterial growth in batch culture. Through rigorous experimentation and data analysis, the study quantified growth rates, lag times, and maximum biomass levels for Achromobacter agilis, Pseudomonas fluorescens, Bacillus thuringiensis, and Staphylococcus lentus. This comprehensive assessment allowed practitioners to infer the intricate relationships between these parameters, providing crucial insights into the growth dynamics of these bacterial species.
Furthermore, the application of Monod and Lineweaver-Burk models facilitated the estimation of affinity parameters, shedding light on the bacterial isolates’ preferences for specific substrates. This mechanistic understanding of substrate affinity and utilization provides valuable guidance for the formulation of effective bioremediation cocktails. The pivotal role of these models in predicting bacterial behavior underscores their applicability in designing tailored strategies for pollutant cleanup.
Following the consolidation of the study findings, it becomes evident that the synthesis of rhizobacterial-based bioremediation cocktails with locally sourced agro-waste holds significant promise for diverse applications. Beyond pollution mitigation, this approach has implications for ecosystem restoration, waste management, and sustainable environmental stewardship. The synergistic amalgamation of cutting-edge research and practical application paves the way for scalable, impactful, and eco-friendly solutions that contribute to a healthier, more resilient planet. In the ever-evolving landscape of environmental conservation, bioremediation cocktails and agro-waste utilization stand as beacons of innovation and hope.
References
1.Jeyanthi V, Kanimozhi S. Plant growth promoting rhizobacteria (PGPR)-prospective and mechanisms: A review. Journal of Pure and Applied Microbiology. 2018;12(2):733-749
2.Lynch JM. Beneficial microbes in the rhizosphere - with special reference to wheat. Plant and Soil. 2005;194(1-2):1-3
3.Prathap M, Ranjitha HB. Potential role of plant growth-promoting rhizobacteria in plant defense against soil-borne pathogens. Plant Science Today. 2015;2(4):180-185
4.Kumar V, Saharan BS, Sharma D, Choudhary M. Role of plant growth-promoting rhizobacteria in the remediation of metal-contaminated soils. In: Bioremediation of Industrial Waste for Environmental Safety. Singapore: Springer; 2020. pp. 87-100
5.Garcia JL, Patel BKC, Ollivier B. Taxonomic, phylogenetic, and ecological diversity of methanogenic archaea. Anaerobe. 2015;34:1-3
6.Chaudhary P, Sharma R, Singh S, Nain L. Bioremediation of PAH by Streptomyces sp. Bulletin of Environmental Contamination and Toxicology. 2011;86(3):268-271
7.Backer R, Rokem JS, Ilangumaran G, Lamont J, Praslickova D, Ricci E, et al. Plant growth-promoting rhizobacteria: Context, mechanisms of action, and roadmap to commercialization of biostimulants for sustainable agriculture. Frontiers in Plant Science. 2018;9:1473
8.Zhang R, Vivanco JM, Shen Q. The unseen rhizosphere root–soil–microbe interactions for crop production. Current Opinion in Microbiology. 2017;37:8-14
9.Smith DL, Gravel V, Yergeau E. Signaling in the phytomicrobiome. Frontiers in Plant Science. 2017;8:611
10.Kumar A, Verma JP, Singh M. Plant growth promoting rhizobacteria (PGPR): A sustainable approach towards improving soil and plant health. In: Microbial Interventions in Agriculture and Environment. Singapore: Springer; 2021. pp. 45-65
11.Oleńska E, Małek W, Wójcik M, Swiecicka I, Thijs S, Vangronsveld J. Beneficial features of plant growth-promoting rhizobacteria for improving plant growth and health in challenging conditions: A methodical review. Science of the Total Environment. 2020;743:140682
12.Agbaji JE, Nwaichi EO, Abu GO. Optimization of bioremediation cocktail for application in the eco-recovery of crude oil polluted soil. AAS Open Research. 2020;3(7):1-25
13.Abu GO. Process and phenomenal microbiology: How microbes were created to create jobs for mankind. University of Port Harcourt. 2017;141(1):5-123
14.Udume OA, Abu GO, Stanley HO, Vincent-Akpu IF, Momoh Y, Eze MO. Biostimulation of petroleum-contaminated soil using organic and inorganic amendments. Plants. 2023;12(3):431
15.Nwankwegu AS, Orji MU, Onwosi CO. Studies on organic and in-organic biostimulants in bioremediation of diesel-contaminated arable soil. Chemosphere. 2016;162:148-156
16.Ojewumi ME, Emetere ME, Babatunde DE, Okeniyi JO. In situ bioremediation of crude petroleum oil polluted soil using mathematical experimentation. International Journal of Chemical Engineering. 2017;2017:5184760
17.Ali H, Khan E, Ilahi I. Environmental chemistry and ecotoxicology of hazardous heavy metals: Environmental persistence, toxicity, and bioaccumulation. Journal of Chemistry. 2019;2019:2-14. DOI: 10.1155/2019/6730305
18.Ron EZ, Rosenberg E. Enhanced bioremediation of oil spills in the sea. Current Opinion in Biotechnology. 2014;27:191-194
19.Agbaji JE, Nwaichi EO, Abu GO. Optimized production of bioremediation agent for application in the eco-recovery of oil spill site. In: Paper Presented at the SPE Nigeria Annual International Conference and Exhibition, Virtual. OnePetro.org; Aug 2020. doi: 10.2118/203654-MS
20.Gaskin SE, Bentham RH. Rhizoremediation of hydrocarbon-contaminated soil using Australian native grasses. Science of the Total Environment. 2010;408(17):3683-3688
21.Nwilo CP, Badejo TO. Impacts and Management of oil Spill Pollution along the Nigerian Coastal Areas. Lagos, Nigeria: Department of Survey & Geoinformatics, University of Lagos; 2005. pp. 567-570. DOI: 10.7901/2169-3358-2005-1-567
22.Stepanova AY, Gladkov EA, Osipova ES, Gladkova OV, Tereshonok DV. Bioremediation of soil from petroleum contamination. PRO. 2022;10(6):1224
23.Shinwari KI, Jan M, Shah G, Khattak SR, Urehman S, Daud MK, et al. Seed priming with salicylic acid induces tolerance against chromium (VI) toxicity in rice (Oryza sativa L.). Pakistan Journal of Botany. 2015;47(SI):161-170
24.Popoola LT, Yusuff AS, Adeyi AA, Omotara OO. Bioaugmentation and biostimulation of crude oil contaminated soil: Process parameters influence. South African Journal of Chemical Engineering. 2022;39(1):12-18
25.Saadoun I. Isolation and characterization of bacteria from crude petroleum oil contaminated soil and their potential to degrade diesel. Journal of Basic Microbiology. 2002;42:420-428
26.Alori ET, Gabasawa AI, Elenwo CE, Agbeyegbe OO. Bioremediation techniques as affected by limiting factors in soil environment. Frontiers in Soil Science. 2022;2:937186
27.Bhandari S, Poudel DK, Marahatha R, Dawadi S, Khadayat K, Phuyal S, et al. Microbial enzymes used in bioremediation. Journal of Chemistry. 2021;2021:1-17
28.Saravana KP, Amruta SR. Analysis of biodegradation pathway of crude oil by Pseudomonas sp. isolated from marine water sample. Archives of Applied Science Research. 2013;5(4):165-171
29.Mnif S, Chebbi A, Mhiri N, Sayadi S, Chamkha M. Biodegradation of phenanthrene by a bacteria consortium enriched from Sercina oilfield. Process Safety and Environmental Protection. 2017;107:44-53
30.Biache C, Mansuy-Huault L, Faure P. Impact of oxidation and biodegradation on the most commonly used polycyclic aromatic hydrocarbon (PAH) diagnostic ratios: Implications for the source identifications. Journal of Hazardous Materials. 2014;267:31-39
31.Gennadiev AN, Pikovskii YI, Zhidkin AP, Kovach RG, Koshovskii TS, Smirnova MA, et al. Factors and features of the hydrocarbon status of soils. Eurasian Soil Science. 2015;48:1193-1206
32.Atashgahi S, Sánchez-Andrea I, Heipieper HJ, van der Meer JR, Stams AJ, Smidt H. Prospects for harnessing biocide resistance for bioremediation and detoxification. Science. 2018;360(6390):743-746
33.Agarry SE, Ogunleye OO. Box-Behnken design application to study enhanced bioremediation of soil artificially contaminated with spent engine oil using biostimulation strategy. International Journal of Energy and Environmental Engineering. 2012;3:1-14
34.Tang J, Lu X, Sun Q , Zhu W. Aging effect of petroleum hydrocarbons in soil under different attenuation conditions. Agriculture, Ecosystems & Environment. 2012;149:109-117
35.Ng EL, Lwanga EH, Eldridge SM, Johnston P, Hu HW, Geissen V, et al. An overview of microplastic and nanoplastic pollution in agroecosystems. Science of the Total Environment. 2018;627:1377-1388
36.Uquetan UI, Osang JE, Egor AO, Essoka PA, Alozie SI, Bawan AM. A case study of the effects of oil pollution on soil properties and growth of tree crops in Cross River State, Nigeria. International Research Journal of Pure and Applied Physics. 2017;5(2):19-28
37.Udoh BT, Chukwu ED. Post-impact assessment of oil pollution on some soil characteristics in Ikot Abasi, Niger Delta region, Nigeria. Journal of Biology, Agriculture and Healthcare. 2014;4(24):111-119
38.Obieze CC, Chikere CB, Adeleke R, Selvarajan R, Ntushelo K, Akaranta O. Field-scale biostimulation shifts microbial community composition and improves soil pollution recovery at an artisanal crude oil refining site. International Journal of Environmental Studies. 2022;26:1-20
39.Chikere CB, Tekere M, Adeleke R. Microbial communities in field-scale oil-polluted soil remediation using 16S rRNA amplicon sequencing. International Journal of Environmental Studies. 2021;78(3):410-426
40.Effiong E, Agwa O, Abu GO. Niche-proxies of hydrocarbon-impacted rhizosphere soil of weeds of Bodo in Gokana, Rivers state, Nigeria. Archives of Current Research International. 2020;19(4):1-14
41.Singer AC, van der Gast CJ, Thompson IP. Perspectives and vision for strain selection in bioaugmentation. Trends in Biotechnology. 2005;23(2):74-77
42.Devianti D, Yusmanizar Y, Syakur S, Munawar A, Yunus Y. Organic fertilizer from agricultural waste: Determination of phosphorus content using near infrared reflectance. IOP Conference Series: Earth and Environmental Science. 2021;644:012002. DOI: 10.1088/1755-1315/644/1/012002
43.Chakraborty D, Chatterjee S, Althuri A, Mohan SV. Sustainable enzymatic treatment of organic waste in a framework of circular economy. Bioresource Technology. 2022;370:128487
44.Iheukwumere CL. The use of agro-wastes as recovery tool of soil contaminated with spent engine oil: Using Okra (Abelmoschus Esculentus) growth indices as indicator [thesis]. 2018
45.Sadh PK, Duhan S, Duhan JS. Agro-industrial wastes and their utilization using solid-state fermentation: A review. Bioresources and Bioprocessing. 2018;5(1):1-15
46.Graminha EBN, Gonçalves AZL, Pirota RDPB, Balsalobre MAA, Da Silva R, Gomes E. Enzyme production by solid-state fermentation: Application to animal nutrition. Animal Feed Science and Technology. 2008;144(1-2):1-22
47.Iheanacho GC, Ibiene AA, Okerentugba PO. Treatment of Port Harcourt refinery effluent by a bacterial consortium immobilized on agro-based bio carriers. Asian Journal of Biotechnology and Bioresource Technology. 2019;5(4):1-10
48.Effiong E, Agwa OK, Abu GO. Algal-biomass production from Chlorella sp. using hot and cold water infusions of poultry droppings. Asian Journal of Biotechnology and Bioresource Technology. 2019;4(4):1-9
49.Kalsi A, Celin SM, Bhanot P, Sahai S, Sharma JG. A novel eggshell-based bio formulation for remediation of RDX (hexahydro-1, 3, 5-trinitro-1, 3, 5-triazine) contaminated soil. Journal of Hazardous Materials. 2021;401:123346
50.Dabrowska M, Debiec-Andrzejewska K, Andrunik M, Bajda T, Drewniak L. The biotransformation of arsenic by spent mushroom compost–an effective bioremediation agent. Ecotoxicology and Environmental Safety. 2021;213:112054
51.Dike CC, Shahsavari E, Surapaneni A, Shah K, Ball AS. Can biochar be an effective and reliable biostimulating agent for the remediation of hydrocarbon-contaminated soils? Environment International. 2021;154:106553. ISSN 0160-4120. DOI: 10.1016/j.envint.2021.106553
52.Sadañoski MA, Benítez SF, Fonseca MI, Velázquez JE, Zapata PD, Levin LN, et al. Mycoremediation of high concentrations of polychlorinated biphenyls with pleurotus sajor-caju LBM 105 as an effective and cheap treatment. Journal of Environmental Chemical Engineering. 2019;7(6):103453
53.Omotosho J, Momoh OLY, Ikebude CF. Application of bone char in bioremediation of crude oil polluted soil: Optimization and kinetic analysis. Journal of Research Information in Civil Engineering. 2018;15(4):2361-2374
54.Akpe AR, Ekundayo AO, Aigere SP, Okwu GI. Bacterial degradation of petroleum hydrocarbons in crude oil-polluted soil amended with cassava peels. American Journal of Research Communication. 2015;3(7):99-118
55.Nwogu TP, Azubuike CC, Ogugbue CJ. Enhanced bioremediation of soil artificially contaminated with petroleum hydrocarbons after amendment with Capra aegagrus hircus (goat) manure. Biotechnology Research International. 2015;2015:657349
56.Hamoudi-Belarbi L, Hamoudi S, Belkacemi K, Nouri LH, Bendifallah L, Khodja M. Bioremediation of polluted soil sites with crude oil hydrocarbons using carrot peels waste. Multidisciplinary Digital Publishing Institute Journal of Environment. 2018;5(124):1-11
57.Aghalibe CU, Igwe JC, Obike AI. Studies on the removal of petroleum hydrocarbon (PHCs) from a crude oil impacted soil amended with cow dung, poultry manure and NPK fertilizer. Chemistry Research Journal. 2017;2(4):22-30
58.Naik B, Kumar V, Rizwanuddin S, Chauhan M, Gupta AK, Rustagi S, et al. Agro-industrial waste: A cost-effective and eco-friendly substrate to produce amylase. Food Production, Processing and Nutrition. 2023;5(1):30
59.Curti E, Carini E, Bonacini G, Tribuzio G, Vittadini E. Effect of the addition of bran fractions on bread properties. Journal of Cereal Science. 2013;57(3):325-332
60.Alauddina M, Islama J, Shirakawaa H, Kosekib T, Ardiansyahc KM, Komaia M. Rice bran as a functional food: An overview of the conversion of rice bran into a superfood/functional food. Superfood and Functional Food. An Overview of Their Processing and Utilization. 2017;14(1):291-305. DOI: 10.5772/66298
61.Karp SG, Woiciechowski AL, Soccol VT, Soccol CR. Pretreatment strategies for delignification of sugarcane bagasse: A review. Brazilian Archives of Biology and Technology. 2013;56:679-689
62.Gizaw A, Zewge F, Kumar A, Mekonnen A, Tesfaye M. A comprehensive review on nitrate and phosphate removal and recovery from aqueous solutions by adsorption. AQUA—Water Infrastructure, Ecosystems and Society. 2021;70(7):921-947
63.Berkessa YW, Mereta ST, Feyisa FF. Simultaneous removal of nitrate and phosphate from wastewater using solid waste from factory. Applied Water Science. 2019;9:1-10
64.Mor S, Chhoden K, Ravindra K. Application of agro-waste rice husk ash for the removal of phosphate from the wastewater. Journal of Cleaner Production. 2016;129:673-680
65.Husain K, Ansari RA, Ferder L. Pharmacological agents in the prophylaxis/treatment of organophosphorous pesticide intoxication. Indian Journal of Experimental Biology. 2010;48(7):642-650
66.Peltzer PM, Lajmanovich RC, Sánchez-Hernandez JC, Cabagna MC, Attademo AM, Bassó A. Effects of agricultural pond eutrophication on survival and health status of Scinax nasicus tadpoles. Ecotoxicology and Environmental Safety. 2008;70(1):185-197
67.Williams KF, Agwa OK. Optimization of chlorella-biomass production using domestic and restaurant waste water as a potential feedstock. Microbiology Research Journal International. 2021;31(12):14-22
68.Fuentes B, Bolan N, Naidu R, Mora MDLL. Phosphorus in organic waste-soil systems. Journal of Soil Science and Plant Nutrition. 2006;6(2):64-83
69.Kova K, Egli T. Growth kinetics of suspended microbial cells: From single- substrate-controlled growth to mixed-substrate kinetics. Microbiology and Molecular Biology Reviews. 1998;62(3):646-666
70.Talaiekhozani A, Jafarzadeh N, Fulazzaky MA, Talaie MR, Beheshti M. Kinetics of substrate utilization and bacterial growth of crude oil degraded by pseudomonas. Journal of Environmental Health Science and Engineering. 2015;13(64):1-8
71.Maier RM, Pepper IL, Gerba CP. Environmental Microbiology. San Diego: Academic Press; 2009. p. 397
Written By
Joseph E. Agbaji, Enobong Effiong and Godwin C. Iheanacho
Submitted: 31 August 2023Reviewed: 14 November 2023Published: 11 March 2024
 Open access peer-reviewed chapter