Open Access is an initiative that aims to make scientific research freely available to all. To date our community has made over 100 million downloads. It’s based on principles of collaboration, unobstructed discovery, and, most importantly, scientific progression. As PhD students, we found it difficult to access the research we needed, so we decided to create a new Open Access publisher that levels the playing field for scientists across the world. How? By making research easy to access, and puts the academic needs of the researchers before the business interests of publishers.
We are a community of more than 103,000 authors and editors from 3,291 institutions spanning 160 countries, including Nobel Prize winners and some of the world’s most-cited researchers. Publishing on IntechOpen allows authors to earn citations and find new collaborators, meaning more people see your work not only from your own field of study, but from other related fields too.
To purchase hard copies of this book, please contact the representative in India:
CBS Publishers & Distributors Pvt. Ltd.
www.cbspd.com
|
customercare@cbspd.com
The global COVID-19 pandemic, affecting over 8 million people across 100 nations, presents a severe risk to human life and property. India, with its vast population of 1.34 billion, is among the hardest-hit countries. This study employs machine learning techniques for visualizing and predicting the spatiotemporal progression of COVID-19. Utilizing Python libraries such as “Numpy,” “Pandas,” “Scikit,” and “Matplotlib,” we analyze and visualize COVID-19 data sourced from the Indian Ministry of Health Web Service and API. Our visualizations depict demographic trends, incident growth, geospatial state-based patterns, and distribution. The analysis reveals that age groups under 30 and over 59 exhibit resilience to the virus, offering hope for population growth. Examining active cases, recoveries, and deaths, India has outpaced countries like Germany, the United States, Iran, Italy, Spain, South Korea, Turkey, France, and the United Kingdom since early April 2020. Furthermore, we employ supervised machine learning algorithms, including PROPHET and ARIMA, to predict the virus’s spread. By accounting for seasonality-related factors, we achieve a 95% prediction interval, indicating the potential for accurate spread forecasting. This research contributes valuable insights into COVID-19’s impact in India and offers predictive tools for managing its progression.
Department of Earth Science, College of Science, Sultan Qaboos University, Oman
Imen Hamdi Nasr
Department of Geology and Geophysics, College of Science, University of Science of Bizerte, Tunisia
*Address all correspondence to: rabdalla@squ.edu.om
1. Introduction
The coronavirus (COVID-19) pandemic is the biggest humanitarian crisis to hit the planet since World War II. The pandemic virus has widely spread, and there are more cases being reported every day [1]. The federal government is attempting to stop its spread. Till date it has spread across 215 countries infecting 5,491,194 people and killing 346,331 till May 23, 2020. As of May 23, 2020, there have been 138,536 COVID-19 cases registered in India. Of these, 57,692 patients have recovered and 4024 have died.
On January 30, 2020, the state of Kerala in India reported the country’s first confirmed case of the coronavirus illness [2]. The impacted person had traveled previously from Wuhan, China. More than 2000 coronavirus cases have been confirmed in India as a result of testing thousands of suspected cases. Maharastra, Kerala, Delhi, Karnataka, Andhra Pradesh, Uttar Pradesh, Rajasthan, and Tamil Nadu are the states with the most cases. The first coronavirus-related mortality in India was noted in Karnataka on March 12. By the end of March 2020, 52 deaths had been recorded nationwide.
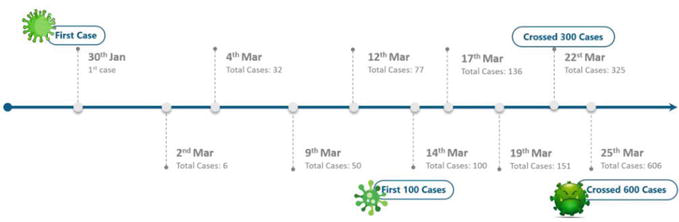
India took swift action by enacting a proactive, statewide shutdown to flatten the curve and give itself time to properly prepare and fund its responses. India has reported 3720 deaths from 32 States and Union Territories as of May 23rd, 2020, and there have been a total of 123,202 confirmed cases of COVID-19 [3]. In order to assess, forecast, and implement safety measures against COVID-19 in India, data scientists throughout the world are employing AI and machine learning. (Reference). India is preparing for the COVID-19 outbreak in accordance with official government directives, but failing to take certain crisis measures or underestimating their significance may have very serious repercussions. India’s surrounding nations have all reported COVID-19 positive cases. Figure 1 depicts the timing of COVID-19’s propagation in India from January 30 to March 25, 2020.
Figure 1.
The early explosion of COVID-19 in India.
The aim of this research is to explore the COVID-19 situation in India and the world in the coming 15 days, through a machine learning model that projects how the virus might spread throughout India. Specifically, this paper will analyze the condition in India from January 30, 2020, to May 24, 2020, and provide a prediction model for the following 15 days. In doing so, the research scraps out COVID data from the Indian Ministry of Health website, through the open API, and provides visualization for the mortality rate per 100 across the affected states. This paper provides visualization for demographics, age groups of affected patients, and a number of tests performed along with state-wise testing insight and visualization of ICMR testing centers in each state. Finally, Auto Regressive Integrated Moving Average “ARIMA” prediction was performed to forecast confirmed cases in India. The final stage was to compare the Indian cases of COVID-19 along with the global spread of the pandemic and provide a geospatial visual model for the hotspots and affected regions of India. The study will also compare the data obtained about the expansion of COVID-19 in India and globally. Numerous researchers, including [4, 5], have looked into the spatial distribution of COVID-19.
The study of giving machines and computers the ability to learn without being explicitly programmed through the exploration of algorithms that can self-teach and make predictions about data falls under the umbrella of machine learning, a subfield of computer science that emerged from the field of artificial intelligence. Instead of executing machine-bound, static, and code-defined instructions, these algorithms work by creating models of inputs to aid in decision-making [6].
Machine learning is defined as a set of methods that can detect hidden patterns in data automatically without explicitly programming them and then use these hidden models to predict future data or assist in making decisions. Machine learning is closely related to the fields of statistics, pattern recognition and data mining, a field of research that enables computers to learn without explicit programming [7, 8].
One method of teaching software to learn and improve automatically through experimentation—even without being expressly coded or changed by its programmers—is through machine learning. Examples of training data, or data used in the creation of mathematical models by algorithms.
Machine learning depends on quickly analyzing a vast amount of data, and then can be linked to the decision-making processes and predict the future, where the computer analyzes a huge amount of human failure in normal ways to analyze and by studying the patterns and trends of data Known as Predictive Analysis, apart from the precise technical aspects of machine learning or learning derived from information systems, the uses and applications of these technologies are enormous and extremely useful in various fields, and contribute significantly to decision-making processes and save effort and time with Mechanism of accuracy [9].
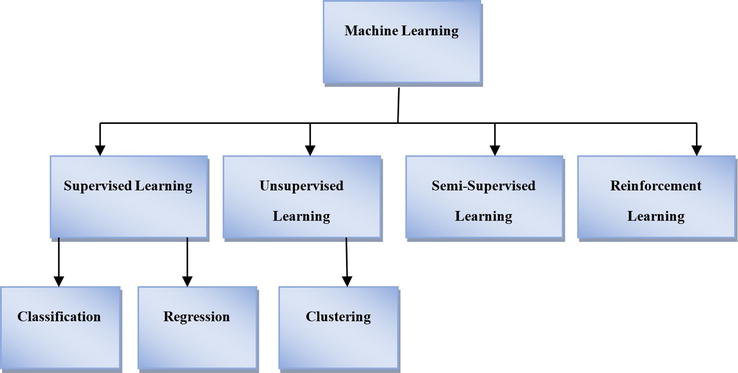
Supervised Learning, Unsupervised Learning, Semi-Supervised Learning, and Reinforcement Learning are the several types of machine learning algorithms (Figure 2).
Figure 2.
Classification of machine learning approaches.
Its applications are used in agriculture, irrigation, and in the fourth generation of industry, communications, roads, mines and health care, and are used in the fields of marketing, insurance, banking and translation [10]. For example, in agriculture, these techniques are used in crop management in so-called precision agriculture. Plants or trees individually, through simple sensors can know the tree is treated and the exact dose required, as well as irrigation in time with the amount of water that fits perfectly, which contributes directly to increasing production and saving a lot of time and Ward even predicts the disease before it occurs, in addition to conducting all tests and examinations without human intervention and take appropriate decisions in a timely manner [11]. Machine learning has been utilized extensively most recently during the COVID-19 spread [12, 13, 14].
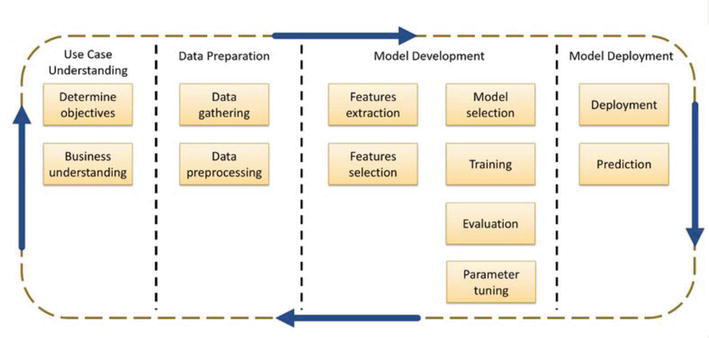
The flow process of the design of machine learning protocol, in general, starts initially with understanding the problem and determining the goal of the design of the model or algorithm. The second stage is to collect and categorize the data if not collected before. Followed by cleaning the data if there are problems. The important stage is the model design, followed by training the model after selecting the appropriate model, and evaluate the results of the model, and finally put the model for use by the user (Figure 3).
Figure 3.
Stages of work in the design of machine learning models.
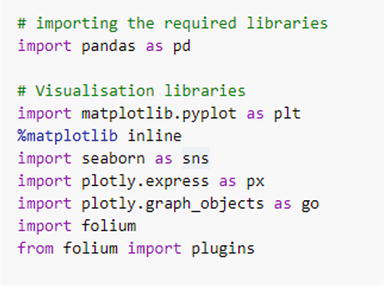
The application of Machine Learning for visualization and prediction is growing. Through Python Programming Language and a number of dedicated libraries, it is possible to achieve advanced visualization including the Python “Pyplot” Toolkit, which is a set of functions that make “matplotlib” function like MATLAB. Matplotlib is a comprehensive library for building static, animated, and interactive visualizations. Each “pyplot” function modifies a figure in some way, such as by creating a figure, a plotting region within the figure, some lines within the plot “Seaborn" is aarea, and labeling the plot. A Python data visualization library called “Seaborn” is based on” “matplotlib.” The Plotly “Express” high-level API for making figures is clear, consistent, and provides a high-level interface for creating visually appealing and educational statistical “Express" is a concise, consistent and high-level API for creating figures. Visuals. The graph objects in “Plotly.graph” objects” are the images produced by the Plotly Python package. Folium library provides mapping functions that is builds on the data wrangling strengths of the Python and allow for mapping capabilities (Figure 4).
Figure 4.
Visualization libraries that are useable in python.
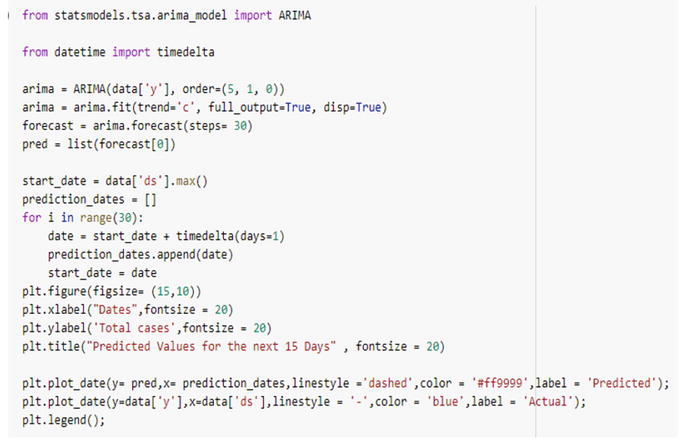
A class of models known as Auto Regressive Integrated Moving Average (ARIMA) deals with time series using the model’s historical values. The ARIMA model is ranked according to the Auto Regression (p), Moving Average MA, and the quantity of differencing necessary to make the time series stationary. In order to estimate future values, it relies on model lags and lagged forecasting mistakes. All-time series that show patterns, are not random, and do not have a lot of noise are suitable for ARIMA ‘models. ‘explains’ a given time series using its own lags and prediction errors, or its own past values, so that the equation can be used to predict future values (Figure 5).
Figure 5.
Code line showing the of implementing ARIMA model.
The Core Data Science team at Facebook has published Prophet as open source software.
Downloadable versions are offered. When forecasting time series data using an additive model, Prophet was utilized to fit non-linear trends including weekly, daily, and yearly seasonality as well as holiday impacts. Strongly seasonal time series and multiple seasons of historical data are ideal for it. Prophet typically manages outliers well and is robust to missing data and changes in the trend. Using Prophet, forecasting confirmed cases of NCOVID-19 for a week in advance with a 95% prediction interval requires building a base model without adjusting any parameters linked to seasonality or adding any new repressors. It offers a precise and quick method for creating trustworthy forecasts for planning and goal-setting. Additionally, it is totally autonomous and highly reliable, giving an accurate forecast on complicated data without any manual work. Prophet can withstand outliers, missing data, and significant time series changes. It offers tunable forecasts for Python and gives customers a lot of options for modifying and adjusting projections.
This section provides an overview of the steps taken in this research. The first part shows the visualization of demographics distribution in India and how the spread of COVID-19 provides some trends and indicators of the impact. The second part shows the preparedness of healthcare facilities and the capacities of urban and ruler centers. The third part provides an insight into the testing distribution and pandemic patterns that were in place during the study period. The fourth part provides an insight on modeling and prediction of geospatial trends as it relates to India. The fifth part is showing global modes of the spread of the COVID-19.
4.1 Visualization of demographics distribution
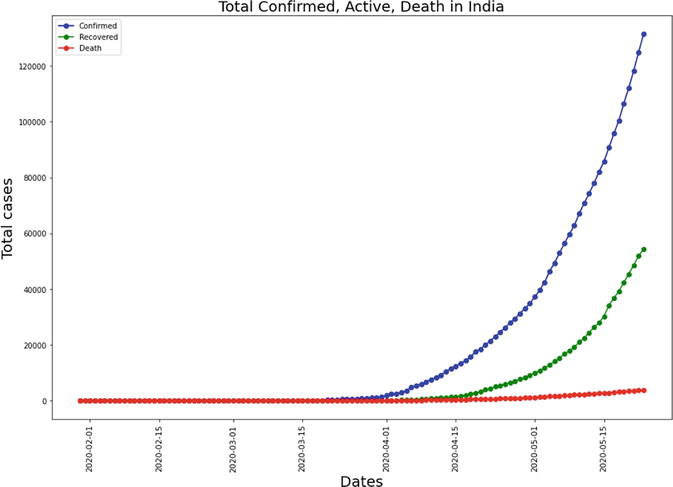
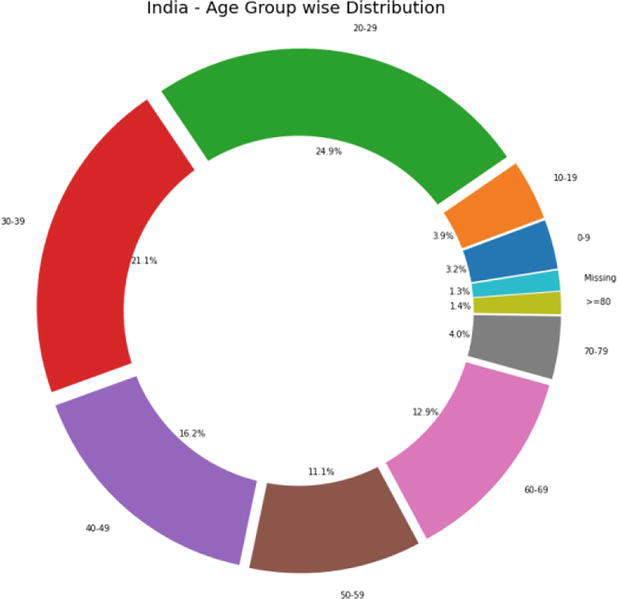
‘Matplotlib’ library was used with Python to visualize the spread of Covid-19 in India. It allowed to visualize the frequency distribution of the numeric array as shown in Table 1 which is used to show the states, the number of deaths, the number of treated patients, and the number of confirmed cases. The data collected allowed researchers to determine that Maharashtra state had the greatest death rate, confirmed cases, and healed patients, however it was ranked the sixth following the states of lower records in Kerala and Rajasthan, which have provided 4 deaths in total in the state of Karla and 160 cases in the state of Rajasthan, bringing this state to the second position of the reported cases. Figure 6 is showing the trend in the confirmed cases, cured cases and deaths as a result of Covid-19 in India. Figure 7 provides further demographic distribution of the cases reported based on the demographics, where is was found that the majority of the reported cases are for the age group between 20 and 29 years old, which represents the highest fraction of the total population, with 24.9% of the total reported sick cases. The second largest group of reported cases is for the age group between 30 and 39 years, with a total of 21% from all reported cases. It was observed that elderly reported cases was in the fifth category for the age group between 60 and 69 with total of 12.9% only surpassing the age group of 50–59 with 11.9% of the total population. The demographics distribution figures confirms that the age group <40 is the most affected which is against the trend which says elderly people are more at risk of being affected. Only 17% of people >60 are affected.
State/Union territory
Confirmed
Cured
Deaths
0. Kerala
795
515
4
1. Rajasthan
6742
3786
160
2. Madhya Pradesh
6371
3267
281
3. Uttar Pradesh
6017
3406
155
4. Goa
55
16
0
5. Ladakh
49
43
0
6. Maharashtra
47,190
13,404
1577
7. Jharkhand
350
141
4
8. West Bengal
3459
1281
269
9. Andaman and Nicobar Islands
33
33
0
10. Assam
329
55
4
11. Manipur
29
4
0
12. Andhra Pradesh
2757
1809
56
13. Puducherry
26
10
0
14. Uttarakhand
244
56
2
15. Bihar
2380
653
11
16. Chandigarh
225
179
3
17. Chhattisgarh
214
64
0
18. Punjab
2045
1870
39
19. Dadar Nagar Haveli
2
0
0
20. Karnataka
1959
608
42
21. Tripura
189
153
0
22. Himachal Pradesh
185
61
3
23. Telangana
1813
1065
49
24. Jammu and Kashmir
1569
774
21
25. Tamil Nadu
15,512
7491
103
26. Meghalaya
14
12
1
27. Gujarat
13,664
6169
829
28. Delhi
12,910
6267
231
29. Odisha
1269
497
7
30. Haryana
1131
750
16
31. Sikkim
1
0
0
32. Mizoram
1
1
0
33. Arunachal Pradesh
1
1
0
Table 1.
Showing the distribution of confrimed and cured cases and deaths in Indian states.
Figure 6.
Visualization of the impact of the COVID - 19 in Indian population as of may 24, 2019.
Figure 7.
Age-based demographic distribution of India’s population.
4.2 Visualization of the healthcare facilities preparedness
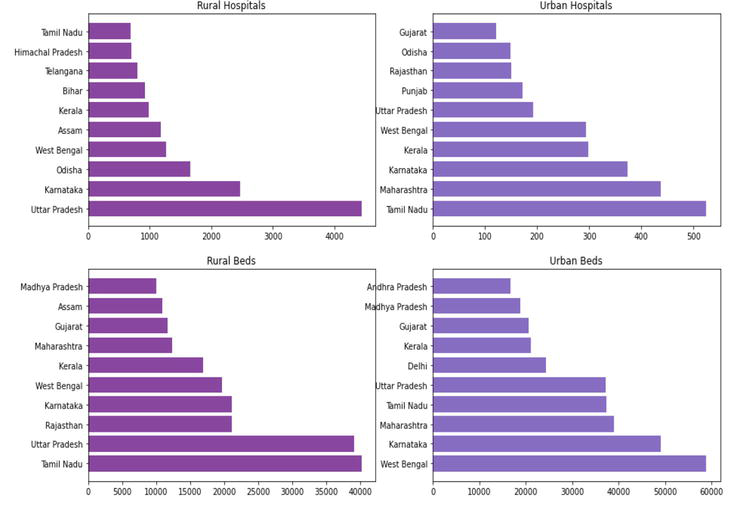
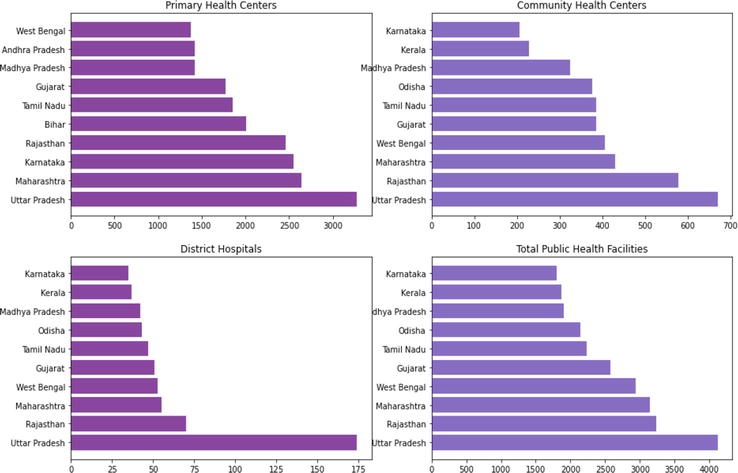
Through the visualization of the rural health care facilities, it was possible to visualize the top ruler hospitals where Tamil Nadu State came with the highest number of urban hospitals beds with beds over 500. In the rural hospitals, the State of Utter Pradesh came first with a number of hospital beds that exceeds 4500 beds. Figure 8 provides details of the top 10 urban and rural healthcare facilities distribution and the number of available hospital beds in each state.
Figure 8.
Capacity of health care facilities and number of beds in urban and ruler India.
A trend was depicted in the distribution of the primary health centers, as the top 10 primary health centers and the top 10 community health centers, as well as the top 10 rural hospitals occur in the Uttar Pradesh State. This may be linked to good infrastructure of this state. Figure 9 provides an overview of the distribution of health care facilities, in India and how the number of hospital beds distribution, as well as the distribution of facilities in the country. This provides direct association to the useability of these facilities and capacities in dealing with the spread of Covid-19.
Figure 9.
Distribution of primary and community Heatlh-care facities in top Indian states.
4.3 Visualization of COVID-19 testing and pandemic patterns
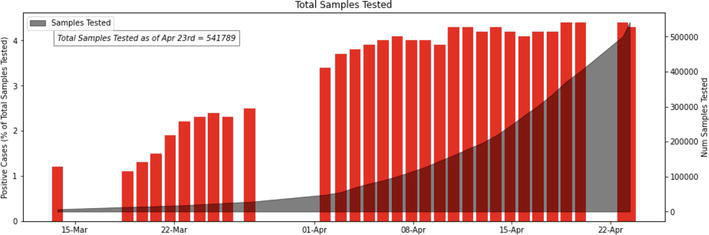
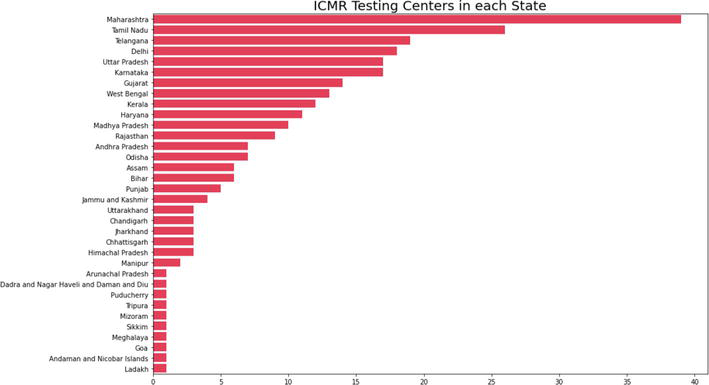
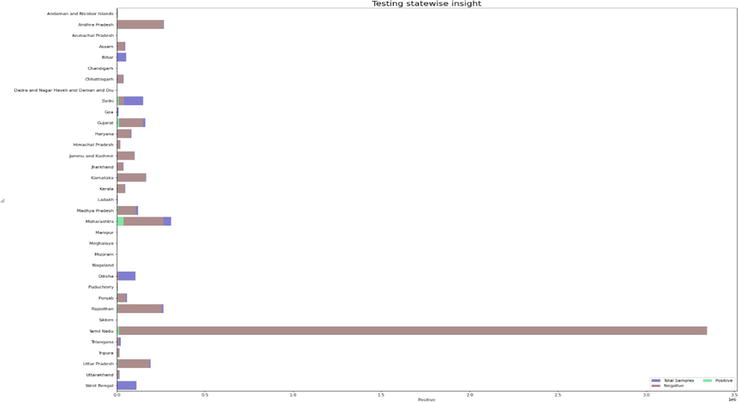
Testing has been performed at a very limited scale in India. It has been performed through the Ministry of Health, and through the Indian Council of Medical Research (ICMR). Maharashtra state was the most tested by the ICMR, while Lakhra was the least tested. Ministry of health testing was performed starting with one hundred thousand tests in mid-March to a half million test in late April as shown in Figure 10. The sampling protocol for ICMR was mainly research oriented to collect samples for research purpose, the total number of samples collected are shown in Figure 11. The distribution of total tested samples, along with negative and positive results is shown in Figure 12.
Figure 10.
CPR sample tests in India between march 10 and April 25.
Figure 11.
Distribution of sampling by the Indian Council of Medical Research in different states.
Figure 12.
Visulization of testing ditribution per stat.E.
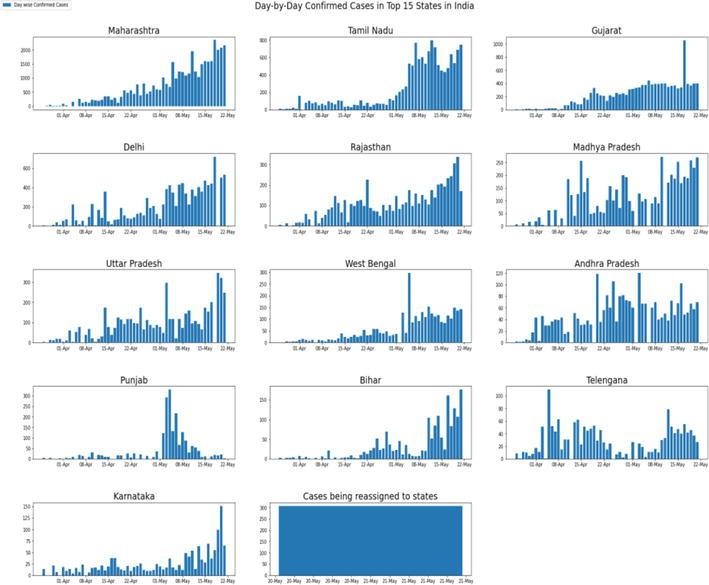
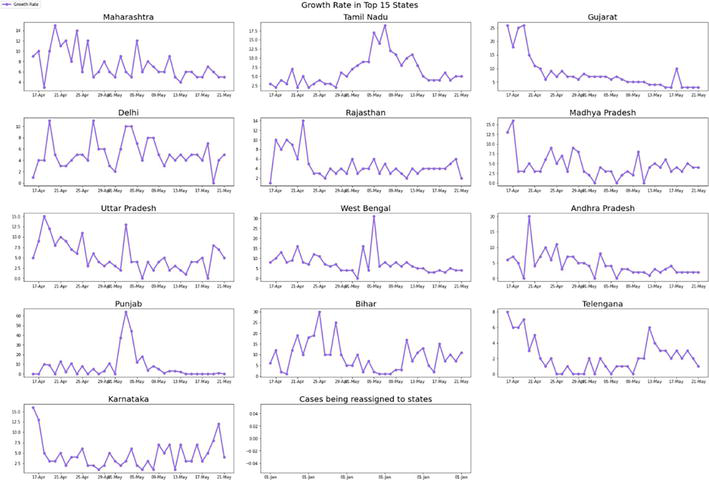
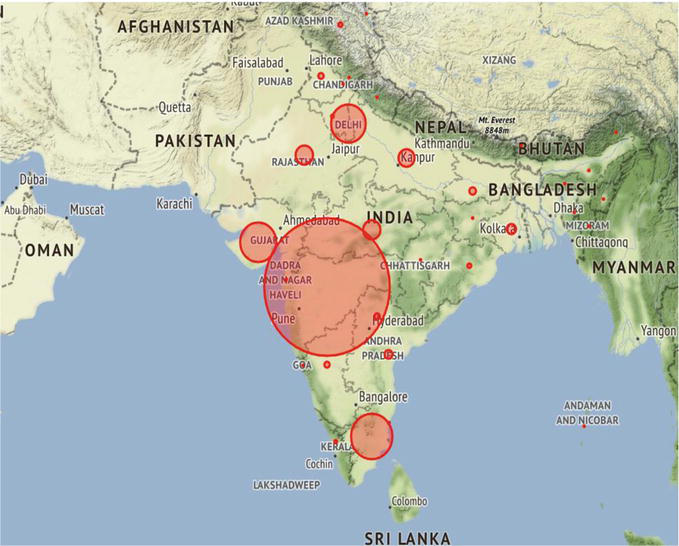
Although being highly populated the relative confirmed cases of India is low compared to other countries. This could be because of two reasons: (1) 67 days lockdown imposed by prime minister Narendra Modi in several stages (Source: Health Ministry) and (2) Low testing rate (Source: news18). Still, the response of the Indian authorities to the pandemic was a matter of appreciation of the WHO and the international community. Figure 13 is showing the track of confirmed cases weekly in the topmost affected states. The overall pattern is showing that there was a noticeable increase in day-by-day reported confirmed cases between March and May. Figure 14 is showing the growth rate pattern in the top most affected Indian states for the same period. Similar to spatial analysis of the study area shown by [15], Figure 15 is showing geospatial visualization of spread hotspots in India.
Figure 13.
Top 15 Indian states with confirmed COVID-19 between April and may 24, 2020.
Figure 14.
Top 15 Indian states with growth rates in confirmed cases between April and may 2020.
Figure 15.
Geospatial visualization of hotspots of the spread in India as of may, 24, 2020.
4.4 PROPHET and ARIMA prediction of the spread in India
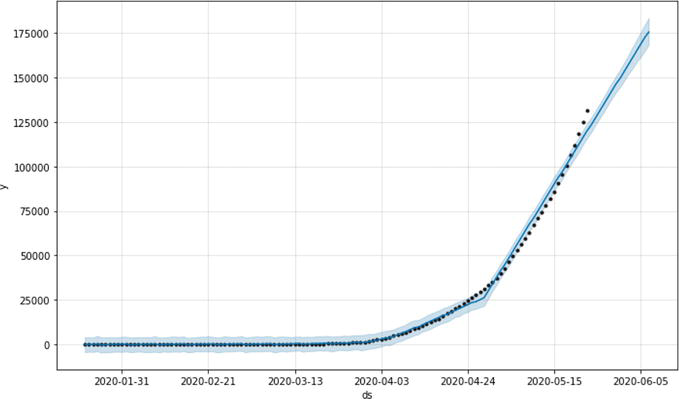
Prophet provides fast, reliable and tunable predictions. By developing a base model without adjusting any seasonality-related parameters or adding any extra regressors, it was possible to predict confirmed cases of COVID-19 2 weeks in advance using Prophet and to estimate the number of deaths each day with a 95% prediction interval. By dialing the Prophet, it was possible to plan the forecast. Passing in your forecast data frame and plotting. Table 2 is showing the produced prediction of total deaths per day based on daily reported figures. Starting from May 24, 2020 to June 7, it was possible to use the previous scenarios to predict. As it is shown in the prediction model, it was found that the death toll was increasing, given the historical number and was expected that it will reach its peak by June 6, 2020, with a total number of 137 deaths. Figure 16 is showing the plotting of the model along with the actual as it was found there was predicted for 1 week, until June 6, 2020.
Deaths
Days
123
2020-05-24
124
2020-05-25
125
2020-05-26
126
2020-05-27
127
2020-05-28
128
2020-05-29
129
2020-05-30
130
2020-05-31
131
2020-06-01
132
2020-06-02
133
2020-06-03
134
2020-06-04
135
2020-06-05
136
2020-06-06
137
2020-06-07
Table 2.
Mplementation of Prophet prediction between may 22 and June 7, 2002.
Figure 16.
15 days PROPHET prediction with 95% interval.
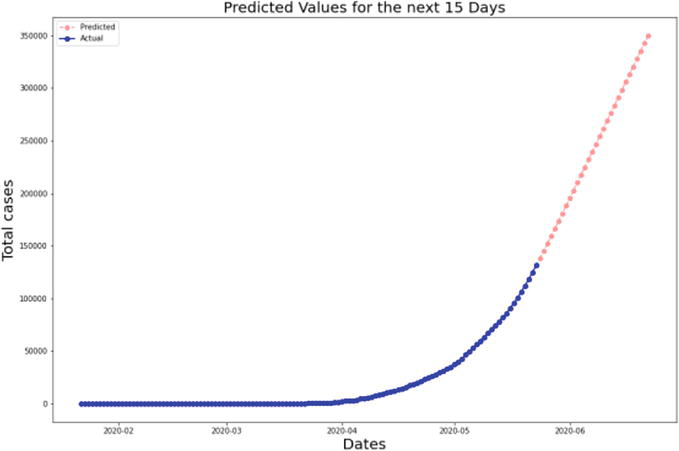
The ARIMA model which stands for Auto-Regressive Integrated Moving Average model was used to predict for 15 days, from the last day of reported confirmed cases. The model explains the given reported death cases based on its previous past values to predict future values [16, 17]. Non-seasonal time series, as the one used in this research exhibits a pattern that is not random. The pattern order of the auto-regression, the order of the moving average and the difference between them, is required to make the time series stationary. According to the results, the global pattern of increasing spread and impact of affected reported confirmed cases, as well as the number of deaths, was on the rise for the period of the study. However, India has a special pattern that the spread majorly in the age group of less than 49 years old. Figure 17 is showing the growth pattern of the confirmed cases as modeled by ARIMA.
Figure 17.
15 days, ARIMA prediction of the total cases starting from may 24, 2020.
4.5 India versus the global impact of COVID-19
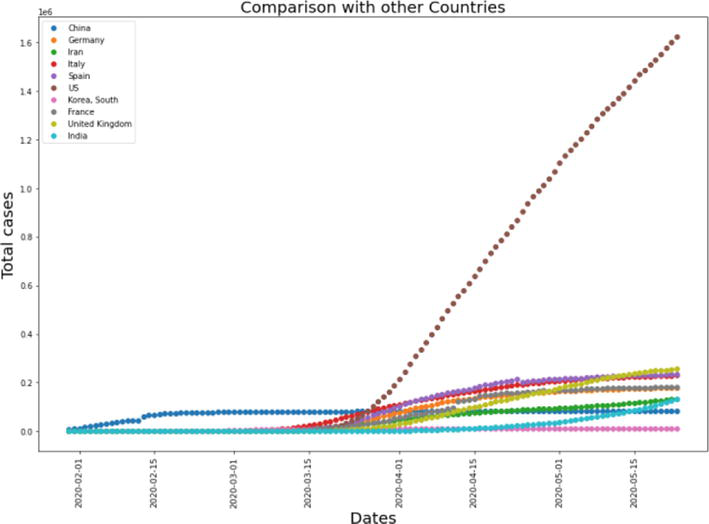
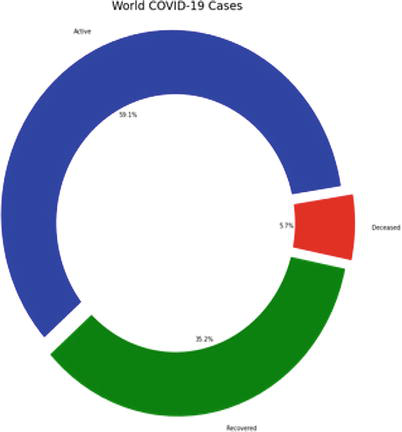
The response of India to COVID-19 was quick and efficient. A proactive nationwide lockdown as place to help with flattening the curve and to enhance the resources and capacities to deal with the response adequately. Comparing to the global impact the growth of reported cases was growing exponentially. Figure 18 is showing the increase in total cases between China, Germany, Iran, Italy, Spain, the United States of America, South Korea, France, the United Kingdom, and India. It is noticeable that the rise of cases in India in millions, between early February and mid-May, 2020. The large population can be a justifying factor. However, the number of tests is reported to be limited, which may have led to an increase in reported cases. Figure 19 provides visualization of the global statistics of the recorded, active, and deceased cases for the end of the study period. It was found that 59.1% of cases were active cases, compared to recovered 35.2% and 5.7% decreased.
Figure 18.
The severity of opread of Indian versus other countries’ reported cases.
Figure 19.
Recovered, active, and decesead population of COVID-19 as of may 24, 2020.
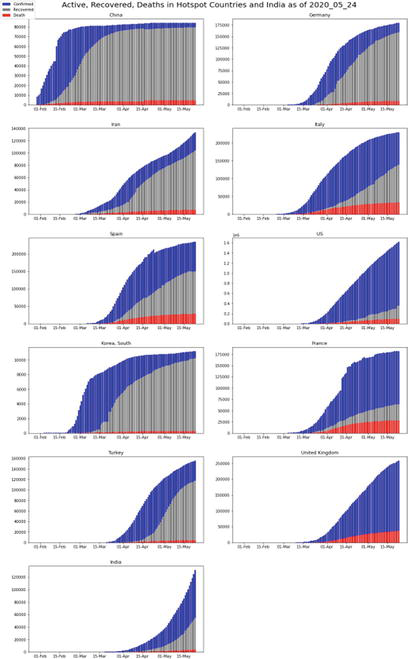
Figure 20 provides a visualization of global hotspots with active, recovered and deceased cases in China, Germany, Iran, Italy, Spain, the United States of America, South Korea, Turkey, France United Kingdom and India, suggesting that the total active cases in India were 120,000 case, by the end of May and the rise have begun from early April. However, for China, the is showing that from Feb till May the total active cases were at 80000 cases. Germany has witnessed 75,000 between April and May, which brings Germany to one of the hottest spots in the spread of COVID-19.
Figure 20.
Comparison between different hotspots of active, recovered, and deaths as of may 24, 2020.
Visualization of complex and big data for delineating spatiotemporal patterns for disaster management and emergency response has been considered widely during the recent spread of COVID-19. Visualizing invisible patterns of data and spatially enabling decision-makers with information contributes to the strength of knowledge that is mostly needed in extreme situations. Sharing data and allowing various contributing domains freely and interoperable access big data of COVID-19 provide added value for medical resources optimization, planning and responding, patterns recognition, and the overall situational awareness that is highly demanded at the planning level, operational level and decision-making levels during pandemic disasters. Visualization of spread in terms of active cases, recovered and deaths showed that India has drastically surpassed Germany, Iran, Italy, Spain, the United States of America, South Korea, Turkey, France, the United Kingdom began starting early April 2020.
This research showed that India as a highly populated country have the capability to leverage technological tools and products in response to extreme situations, through sharing, accessing, collaborating and integrating various decision-making models for rapid and effective response as to how and why scientific visualization and machine learning modeling can be effective in pandemic situations. Prophet Model and ARIMA model were used to predict for 2 weeks using the historical reported data prior to the prediction. The results of this research confirm that Machine Learning visualization and prediction are effective in disaster management situations, dealing with large outbreaks. It showcases the national efforts in specific countries and correlates with the international data. Visualization of COVID-19 spread on different demographic groups showed resilience in the group over 30 years old and over 59 years old, resulting in an increasing and forecasting a more promising growth of population.
1.Mishra K, Rampal J. The COVID-19 pandemic and food insecurity: A viewpoint on India. World Development. 2020;135:1-3. DOI: 10.1016/j.worlddev.2020.105068
2.Andrews MA, Areekal B, Rajesh KR, Krishnan J, Suryakala R, Krishnan B, et al. First confirmed case of COVID-19 infection in India: A case report. The Indian Journal of Medical Research. 2020;151:490-492
3.Narayanan L, Pandit M, Basu S, Karmakar A, Bidhan V, Kumar H, et al. Impact of lockdown due to COVID-19 outbreak: Lifestyle changes and public health concerns in India. Preprints. 2020;1:2020060129. DOI: 10.20944/preprints202006.0129
4.Hongyan Ren L, Zhao AZ, Song L, Liao Y, Weili L, Cui C. Early forecasting of the potential risk zones of COVID-19 in China's megacities. Science of the Total Environment. 2020;729:1-8. DOI: 10.1016/j.scitotenv.2020.138995
5.Pourghasemi HR, Pouyan S, Heidari B, Farajzadeh Z, Shamsi SRF, Babaei S, et al. Spatial modeling, risk mapping, change detection, and outbreak trend analysis of coronavirus (COVID-19) in Iran (days between February 19 and June 14, 2020). International Journal of Infectious Diseases. 2020;98:90-108, ISSN 1201-9712. DOI: 10.1016/j.ijid.2020.06.058
6.Aljaaf A, Hussain A, Fergus P, Przybyla A, Barton GJ. Evaluation of machine learning methods to predict knee loading from the movement of body segments [Internet]. In: Neural Networks (IJCNN). IEEE World Congress on Computational Intelligence, Canada, 24-29 July 2016
7.Brynjolfsson E, Mitchell T. What can machine learning do? Workforce implications. Science. 2017;358(6370):1530-1534
8.Utkin V, Zhuk YA. An one-class classification support vector machine model by interval-valued training data. Knowledge-Based Systems. 2017;120:43-56
9.Khan FN, Zhong K, Al-Arashi WH, Yu C, Lu C, Lau APT. Modulation format identification in coherent receivers using deep machine learning. IEEE Photonics Technology Letters. 2016;28(17):1886-1889
10.Polese M, Jana R, Kounev V, Zhang K, Deb S, Zorzi M. Machine learning at the edge: A data-driven architecture with applications to 5G cellular networks. In: IEEE Transactions on Mobile Computing. 2018. DOI: 10.1109/TMC.2020.2999852
11.Nijeweme-d'Hollosy WO, van Velsen LS, Poel M, Groothuis- Oudshoorn CG, Soer R, Hermens H. Evaluation of three machine learning models for self-referral decision support on low back pain in primary care. International Journal of Medical Informatics. 2018;110:31-41
12.Xie Z, Qin Y, Li Y, Shen W, Zheng Z, Liu S. Spatial and temporal differentiation of COVID-19 epidemic spread in mainland China and its influencing factors. Science of the Total Environment. 2020;744:140929. DOI: 10.1016/j.scitotenv.2020.140929
13.Zhou C, Fenzhen S, Pei T, Zhang A, Yunyan D, Luo B, et al. COVID-19: Challenges to GIS with big data. Geography and Sustainability. 2020;1(1):77-87. DOI: 10.1016/j.geosus.2020.03.005
14.Italian Civil Protection Department, Morettini M, Sbrollini A, Marcantoni I, Burattini L. COVID-19 in Italy: Dataset of the Italian civil protection department. Data in Brief. 2020;30:1-7. DOI: 10.1016/j.dib.2020.105526
15.Franch-Pardo I, Napoletano BM, Rosete-Verges F, Billa L. Spatial analysis and GIS in the study of COVID-19. A review. Science of The Total Environment. 2020;739:1-10. DOI: 10.1016/j.scitotenv.2020.140033
16.Lary DJ, et al. Machine learning applications for earth observation. In: Mathieu PP, Aubrecht C, editors. Earth Observation Open Science and Innovation. ISSI Scientific Report Series. Vol. 15. Cham: Springer; 2018. DOI: 10.1007/978-3-319-65633-5_8
17.Khan FM, Gupta R. ARIMA and NAR based prediction model for time series analysis of COVID-19 cases in India. Journal of Safety Science and Resilience. 2020;1(1):12-18. DOI: 10.1016/j.jnlssr.2020.06.007
Written By
Rifaat Abdalla and Imen Hamdi Nasr
Submitted: 10 April 2023Reviewed: 11 June 2023Published: 13 March 2024
 Open access peer-reviewed chapter