Open Access is an initiative that aims to make scientific research freely available to all. To date our community has made over 100 million downloads. It’s based on principles of collaboration, unobstructed discovery, and, most importantly, scientific progression. As PhD students, we found it difficult to access the research we needed, so we decided to create a new Open Access publisher that levels the playing field for scientists across the world. How? By making research easy to access, and puts the academic needs of the researchers before the business interests of publishers.
We are a community of more than 103,000 authors and editors from 3,291 institutions spanning 160 countries, including Nobel Prize winners and some of the world’s most-cited researchers. Publishing on IntechOpen allows authors to earn citations and find new collaborators, meaning more people see your work not only from your own field of study, but from other related fields too.
To purchase hard copies of this book, please contact the representative in India:
CBS Publishers & Distributors Pvt. Ltd.
www.cbspd.com
|
customercare@cbspd.com
This chapter discusses the role of epidemiology and the importance of spatial analysis in understanding patterns of disease occurrence in human populations. Epidemiologists use inductive and deductive approaches to investigate the relationships between risk factors and health outcomes, using advanced techniques such as factor analysis, multilevel modeling, and causal diagrams. Spatial analysis plays a crucial role in medical geography by identifying a disease’s spatial and temporal distribution. Methods such as point, line, and surface patterns are used to analyze spatial clusters, connections, and trends in disease distribution. These techniques provide valuable information for public health decision-making. The COVID-19 pandemic has highlighted the importance of spatial analysis, using geographic information systems and web-based tools to track the spread of the virus. Advances in geoprocessing techniques, particularly geographic information system (GIS), have transformed medical geography. GIS makes it possible to describe, analyze, and predict spatial patterns by integrating data from different sources and spatial scales. These tools facilitate the creation of spatially explicit variables and allow the exploration of spatial groupings and relationships in the data. Considering the spatial context is essential to understand the determinants of health and the influence of the environment on individual and collective health.
Universidade Federal do Pará, Belém do Pará, Brasil
Mariano Araujo Bernardino da Rocha*
Universidade do Estado do Amapa, Brasil
*Address all correspondence to: mariano.rocha@ueap.edu.br
1. Introduction
Epidemiology is commonly regarded as the methodological backbone of the fields of public health and outcomes research, as its practitioners describe patterns of disease occurrence, identify risk factors and etiological determinants, and demonstrate the utility of interventions [1]. Epidemiological research has made numerous discoveries that have contributed to improving public health. For example, epidemiologists have identified many health risks from active and environmental exposure to tobacco and have found effective smoking prevention and cessation options.
Epidemiologists are constantly seeking to improve their understanding of patterns of disease occurrence in human populations [2]. Historically, they have used inductive approaches to identify simple relationships between risk factors and health outcomes. However, many of the more complex relationships between risk factors and outcomes have yet to be discovered. To address this challenge, techniques such as factor analysis, multilevel modeling, and causal diagrams have been developed to help understand these complex relationships. Although these techniques have limitations in their ability to uncover previously unimaginable interrelationships between etiologic factors, they have been valuable in advancing epidemiologic understanding [3]. In addition, epidemiologists have also adopted deductive approaches, such as dynamical systems models, which allow the prediction of empirical observations and can be particularly useful in the study of infectious diseases [4]. These advanced mathematical models can accelerate hypothesis generation and improve our description of a complex world, allowing epidemiologists to investigate interactions more efficiently between system elements and establish new hypotheses for further testing and validation.
1.1 Importance of medical geography in the spatial analysis of disease
Spatial analysis techniques, such as point, line, and surface patterns, play a fundamental role in medical geography for disease analysis [5]. These techniques provide tools to identify the spatial and temporal distribution of diseases, which allows an understanding of the patterns of occurrence. Point pattern methods allow for examining the spatial clustering of disease occurrences, while line methods analyze spatial connections and relationships [6]. On the other hand, surface techniques are used to identify trends and gradients in disease distribution. In addition, comparison methods and autocorrelation measures are available to help assess spatial similarity between different geographic areas. These spatial analysis techniques are fundamental to understanding the geography of disease and provide valuable information for public health decision-making.
The COVID-19 pandemic has further highlighted the importance of spatial analysis in the health field. Maps have been widely used to track the spread of the virus and understand its spatiotemporal diffusion. The use of geographic information system (GIS) and web-based tools has revolutionized health geography by providing the ability to analyze and visualize disease patterns more efficiently. However, spatial analysis of epidemiological data in real-time presents significant challenges. The speed with which data are generated for an emerging disease such as COVID-19 requires agile technical and methodological solutions. Despite advances, challenges exist in real-time data integration, interpretation of results, and implementation of measures based on spatial analysis. As we face these challenges, it is critical to take full advantage of spatial analysis techniques to effectively understand and address diseases in the geographic context.
1.2 Evolution of geoprocessing techniques and their influence on the transformation of medical geography
Advances in geoprocessing techniques, especially geographic information system (GIS), have had a significant impact on the transformation of medical geography [7]. GIS has been widely used in epidemiological applications, enabling the description, analysis, and prediction of spatial patterns using geographic data and related attributes. These tools have facilitated the creation of spatially explicit variables, such as measures of the built environment, environmental exposures, and demographic characteristics [8]. In addition, GIS has enabled the integration of data from different sources and spatial scales, which has improved the visualization, management, and analysis of information.
GIS-generated thematic maps have been valuable for identifying high-risk areas, highlighting health disparities, assessing resources, and generating explanatory hypotheses [9, 10]. From an analytical perspective, GIS tools have been used to explore spatial or spatiotemporal groupings, investigate locally varying relationships, and model spatial dependencies in data [11]. These analytical resources have provided a deeper understanding of spatial factors and their influence on population health.
It is critical to consider the spatial context in which people live and seek care. The location and characteristics of the environment can influence health outcomes at the individual level, as well as access and quality of care at the provider and system level. Contextual data are important for both the description and analysis of health determinants. For example, one can examine the distribution of green space in a region and develop an index that predicts the likelihood of meeting physical activity guidelines or individual weight status. In addition, hierarchical models allow one to examine how outcomes vary at the individual and group levels, as well as to identify external factors that affect people’s health and well-being. It is essential to consider the role of “place” in epidemiological analysis, as it can have a significant impact on health and should be considered in health interventions and policies.
2.1 Definition of geoprocessing and its main applications
“Geoprocessing is a set of computational techniques that operates on georeferenced databases, which are records of occurrences, to transform them into relevant information” [12]. But what is this relevant information? This question is important to understand a type of information called geoinformation and, consequently, other terms related to geoprocessing, such as geoinformation science, geographic information system (GIS), remote sensing (RS), digital image processing (DIP), geostatistics and spatial analysis.
Currently, we live, according to Takahashi [13], in a unique moment for the world society, where information flows at unimaginable speed and quantity, and the Internet is the icon of this society, known as the Information Society.
Information is generated by the processing or interpretation of data, which is the symbolic form of representation of reality in a quantified way. For example, when we write the letters “A” “D” “A” “T”, which are symbols of grammatical reality in the English language, they have no meaning. However, when we rearrange these same letters to form the word “D” “A” “T” “A”, we obtain a word with four letters and a meaning. In this moment of processing the word DATA, information is generated.
In the universe of geoprocessing, we deal with a special type of data, and we generate very particular information, namely the geographic data and the geoinformation. Therefore, it is always necessary to work with a location in space. Geographic data are those that intrinsically have location, such as latitude and longitude, and geoinformation or spatial information, which is the result of processing spatial data manipulated by computers, maintaining the location in space.
Geoprocessing and remote sensing are two disciplines or technologies that provide the basis for geoinformation science and are equipped with computational tools, such as GIS and PDI, respectively. These technologies, together with geostatistics and spatial analysis techniques, form a set called geotechnologies. Figure 1 presents a visualization of the hierarchy and connection between these concepts, and Table 1 presents the concepts of each of these terms based on prominent sources.
Figure 1.
Relationship between various terms related to geoprocessing. Source: The authors.
Terms
Concepts
Sources
Geoinformation science
Study and implementation of different forms of computational representation of geographic space.
Technology of obtaining data from the Earth’s surface as images by capturing and recording electromagnetic energy emitted or reflected by the Earth’s surface.
It is a sequence of computational processes that allow the rapid manipulation of matrix data for maximum information extraction. It is viewed in terms of one basic requirement, which is interactive (near real-time) operation, and two general characteristics, which are high data volume and the repeated application of a sequence of calculations to each data element.
These are sets of scientific techniques and methods applied to the analysis, exploration, study, and conservation of natural resources, considering different scales and spatial information (geographic location).
2.2 Introduction to geographic information systems (GISs) and their functionalities
The geographic information system (GIS) emerged in the 1980s, when the price of computers began to decline enough to sustain the software industry, considering the cost-benefit of its applications [22]. The timber sector was the first to experiment with this technology, due to the need to control its resources and regulate their use. After this moment, the evolution in the technological, academic, and commercial fields allowed the GIS to be improved according to the new conditions imposed. The launch of satellites, the availability of satellite positioning systems, the internet, and more robust software and hardware have contributed to this improvement.
GISs are powerful tools and services for socio-environmental planning. This system aims to process a large amount of data that describes the environment in an advanced way, both in ordinary and extraordinary situations. The combined use of this tool allows us to generate useful scenarios for decision-making regarding land management [23].
GISs are systems that combine the semantic component of land features (mainly tabular data) with their georeferenced geometric representation. They are equipped with various processors and tools that allow the effective representation of the territory. For example, digital surface models (DSMs) allow the creation of 3D virtual worlds with a major impact on communication.
Like any system, GIS is composed of interrelated elements. In this case, the elements are the software, which provides the functions and tools necessary to store, analyze, and visualize geographic information; the hardware, which consists of the set of equipment necessary for the software to perform its functions; and the peopleware, which refers to the people who, in addition to knowing geoprocessing techniques, must know the application area to correctly select the variables that will simplify the analyzed reality.
According to Magalhães et al. [24], GISs are composed of procedures for obtaining and manipulating graphic and non-graphic data, responsible for data entry, database management systems, spatial data analysis techniques, procedures for data storage and retrieval, and procedures for making results available (visualization, plotting and reporting). What characterizes this system and makes it unique is the possibility to combine geographic data with alphanumeric data, as can be seen in Figure 2.
Figure 2.
The image in the background shows the location of dams in the Amazon through the blue vertical bars, and the image in the center is a zoom that allows the visualization of the link between alphanumeric data (tabular) and a spatial data (point geometry) highlighting a mining tailings dam in the Amazon. Source: Adapted from https://tailing.grida.no/map/data/andhttps://globaia.org/water-anthropocene.
In addition to the function of data storage and information dissemination, GIS also requires the data acquisition stage. This phase is comprehensive, as it involves several techniques. Remote sensing is one of them, which aims to acquire information about targets on the Earth’s surface without direct contact with the object. This acquisition can occur passively or actively, and the resulting products are satellite or radar images, as well as graphs, spectral curves, and others. Another form of data acquisition is through satellite positioning systems, whose function is to collect a pair of coordinates to locate specific events (Figure 3).
Figure 3.
Example of data input into GIS. Source: Adapted from OXTS (2020) and National Geographic (2023).
Ramalho et al. [25] emphasize that geographic information system should not be confused with the same concept of geoprocessing. The latter covers various technologies for the treatment and manipulation of geographic data through computer programs. GISs (geographic information systems) are only tools for the realization of geoprocessing, as illustrated in Figure 4.
Figure 4.
Difference between geoprocessing and GIS. Source: The authors.
Therefore, this system, with its multiple facets, both in the production of maps and in solving geographic problems and supporting spatial decisions, presents elements of paramount importance when connected. A crucial feature is the interoperability of data, allowing the integration of information from different sources and a rapid dissemination of information. The Internet is the available means of diffusion, being responsible for the dissemination and retrieval of data, with numerous websites specialized in geotechnologies [22].
This may seem abstract, but GISs are already part of a technological frontier that is their use on the Internet, through the so-called WebGIS. Among the various examples that could be cited, the most famous are Google Maps and Google Earth, which are certainly used in the daily lives of the world’s population when they are moving around, either in cities or on trips.
2.3 Using remote sensing to obtain geospatial data
The use of remote sensing to obtain geospatial data is essential in the field ofgeoprocessing. Geoprocessing and remote ensing are disciplines/techniques that are increasingly interconnected, serving as tools for interdisciplinary research. This research has intrinsic characteristics of dialog and integration between several scientific disciplines [26].
The products generated by the remote sensing tool, through digital image processing, are used as input in geoprocessing through the geographic information system (GIS). These products are mostly matrix data known as satellite images. These images are obtained by sensors attached to orbital satellites, which have radiometers capable of collecting electromagnetic radiation that interacts with targets on the Earth’s surface. From these data, it is possible to infer values of variables, such as temperature and air humidity, distinguish different targets on the Earth’s surface, and obtain digital terrain models [27].
Remote sensors can be imagers or not and can only generate graphics. They can be manual, such as handheld spectroradiometers, or be attached to balloons, drones, aircraft, and satellites. These sensors can be passive or active (Figure 5), collecting part of the wavelengths of electromagnetic radiation emitted by the Sun and interacting with the Earth’s surface, or emitting their own pulses in the microwave range and interacting with terrestrial targets, returning to the sensor (Figure 6).
Figure 5.
Active sensors (L-band of a synthetic aperture radar - SAR) emitting and receiving pulses and passive sensors, only receiving the radiation from the sun that interacts with the targets. Source: Adapted from IBGE [28].
Figure 6.
Electromagnetic spectrum with its divisions by wavelength and frequency, the wavelength increases in the direction from right to left of the viewer, and the frequency increases in the opposite direction. Source:https://science.nasa.gov.
To infer values of environmental variables from the Earth’s surface, orbital remote sensors use characteristics of electromagnetic waves. They capture fractions of the length of these waves through bands (channels) in the sensors. These fractions are recorded as electromagnetic radiation flux, also known as radiance, and are stored as digital numbers (DN) in a matrix. This matrix is further processed to form an image with understandable data of an environmental variable, which will serve as input for geoprocessing (Figures 7 and 8).
Figure 7.
Raw data from passive sensors with DN in a matrix, forming an RGB color composite image and being processed, generating spatial land use and land cover information. Source: The authors.
Figure 8.
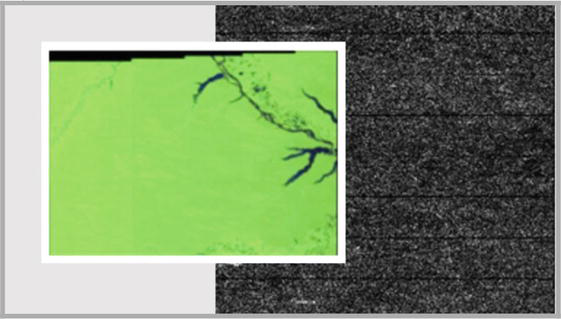
Raw radar data and its visualization after processing. Source: Maciel and Diniz [29].
Thus, orbital remote sensors use electromagnetic radiation to obtain information about the Earth’s surface. By capturing this information through different spectral bands, they record the radiation as digital values that can be processed to form images that represent environmental variables. These images are fundamental for geoprocessing, providing relevant data for spatial analysis and decision-making in several areas, such as environmental monitoring, and urban and agricultural planning, among others.
Figure 9 shows passive sensors, such as the advanced baseline imager (ABI) of the GOES-16 satellite, which aims to infer terrestrial meteorological data. Bands 1, 2, and 3 of this sensor store data in bands of the visible and near-infrared electromagnetic spectrum. This curve is shown in red, where the peaks represent high transmittance, i.e., a good passage of the wavelengths of radiation that interacts with the target and is recorded by the sensor. The valleys in the curve show high absorption due to the presence of atmospheric gases such as ozone and water vapor.
Figure 9.
Atmospheric transmittance of upward electromagnetic radiation from the Earth’s surface. Source: [27].
These passive sensors, such as the ABI, are fundamental for the collection of terrestrial meteorological data. They allow the observation and recording of different wavelengths of electromagnetic radiation, providing information on atmospheric conditions and allowing more accurate weather analysis and forecasting. The use of these passive sensors is essential in monitoring and studying weather and climate, contributing to the understanding of meteorological phenomena and their impacts on the environment and society.
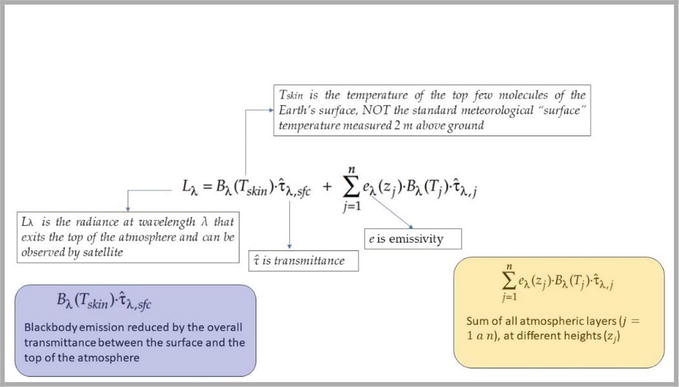
The Schwarzschild equation shows how radiance, one of the sensor inputs, is obtained. In this case, it is used as an example to illustrate the interaction with the atmosphere, as can be seen in Figure 10.
Figure 10.
Explanation of obtaining the radiation flux at one wavelength with an example of the atmospheric interaction based on the Schwarzchild equation. Source: Adapted from [27].
The Schwarzschild equation is a fundamental tool in the study of electromagnetic radiation and its interaction with the Earth’s atmosphere. This equation allows the calculation of radiance, which is the amount of radiation emitted or reflected by an object in a specific direction.
Figure 10 graphically represents this interaction between radiation and the atmosphere. It can be seen how solar radiation strikes the atmosphere and some of it is absorbed, scattered, or reflected before reaching the earth’s surface. This interaction with the atmosphere has an impact on the data that are captured by the sensors since the radiation undergoes modifications on its way through the atmosphere.
Understanding and modeling this interaction is essential in the processing of remotely sensed data, as it allows correcting for atmospheric effects and obtaining more accurate information about the Earth’s surface.
2.4 Collecting and organizing health data
The merging of geographic data with health goes back a long way. This combination of information has been recorded since the nineteenth century, when the English physician John Snow mapped cholera cases and water supply locations in the city of London, England. Although he used methods that are considered simplistic by today’s standards and did not rely on the use of hardware and software due to the lack of these technologies at the time, it was possible to overlay the data and visualize, through spatial analysis, the relationship between contaminated water wells and disease outbreaks that resulted in many deaths in the region. This allowed the implementation of public health measures, such as the closure of these wells, to contain the epidemic.
Nowadays, with the advancement of technology, the process of building maps and making decisions has become much faster and more efficient. The possibility of integrating spatial data with quantitative information on diseases and health care has been of great importance. A notable example was the real-time and online updating of data related to the COVID-19 pandemic. As the disease spread around the world and countermeasures were implemented, this data was constantly updated by various professional organizations around the world. Figure 11 illustrates an example of this type of data visualization.
Figure 11.
COVID-19 dashboard: Center for Systems Science and Engineering (CSSE) at Johns Hopkins University (JHU). Available via the link: https://www.arcgis.com/apps/dashboards/bda7594740fd40299423467b48e9ecf6.
The integration of geospatial data and health information has led to significant advances in disease monitoring and understanding, enabling better decision-making and the development of effective prevention and control strategies. This collaborative approach between the fields of geotechnology and health has proven increasingly important in the search for solutions to public health challenges.
2.5 Available health data sources
The main sources of health data are obtained through health information systems (HIS), which are digital systems that collect data from different sources and make them available through information technology tools to generate strategic information for the benefit of public health. These systems enable decision-makers at all levels of the health system to identify problems and needs, make evidence-based decisions about health policies, and optimally allocate limited resources [30]. Some examples of these systems around the world can be seen in Table 2.
Health system
Characteristics
Country
National Health Service (NHS)
This system is made up of other systems such as Electronic Health Records (EHR), Summary Care Records, and NHS Spine, which is a secure network for sharing patient information between different healthcare providers.
United Kingdom
Veterans’ Health Information Systems and Technology Architecture (VistA)
Electronic health record system developed by the U.S. Department of Veterans Affairs (VA). It is used to manage VA health care delivery and patient information.
USA
Sistema Único de Saúde (SUS)
The national public health system has DATASUS (Department of Informatic SUS), a health information system. DATASUS collects and manages health data from across the country, supporting health surveillance, epidemiology, resource management, and monitoring of health indicators.
Brazil
My Health Record
It is a digital health record system implemented to enable individuals to securely store and manage their health information, which can be accessed by health service providers to support coordinated care and improve health outcomes.
Australia
National Health Information System (NHIS)
Provides a platform to capture, store, and analyze health data at the national level. NHIS supports health planning, monitoring of health services, and resource allocation.
Ghana
National Electronic Health Record System (NEHRS)
It is a comprehensive health information system implemented to facilitate the sharing of electronic health records between different health service providers, supporting care coordination and enabling health professionals to access patient information whenever needed.
Singapore
Table 2.
Different health information systems implemented around the world.
Source: The authors.
Health information systems collect data from different sources, such as medical records, health surveys, epidemiological reports, and mortality records. These data are collected and processed in a standardized way to ensure quality and interoperability. In addition, anonymization and data protection techniques are used to ensure the confidentiality and privacy of individuals’ health information.
The availability of these health data sources has enabled significant advances in research, epidemiological surveillance, and health decision-making. The data collected are used to identify disease patterns, evaluate the effectiveness of public health interventions, monitor the spread of infectious diseases, and assess the burden of disease in different populations.
Importantly, access to and availability of health data varies between countries and jurisdictions, and it is critical to establish policies and legal frameworks that promote the ethical and safe use of these data. Collaboration between health professionals, researchers, and decision-makers is essential to make the most of these data sources and use them to improve the health of populations.
These various health information systems, when combined with GIS, demonstrate their full potential in generating spatial information in the field of public health, enabling more informed decision-making.
2.6 Construction of GIS in health
Pina [31] outlines the steps for building a GIS developed for the healthcare sector. However, the author emphasizes that creating a GIS is not a standalone task for the healthcare sector, as obtaining spatial data requires contacting municipal or state planning agencies. These data include information related to infrastructure, basic sanitation, road networks, and aerial imagery, among others. As data to be analyzed, one can utilize information from available information systems stored in databases, such as the DATASUS in Brazil, which is a database of the Unified Health System (SUS) that provides products and services specifically aimed at the public health sector.
In terms of GIS software for data analysis, there are several options available, both open-source and proprietary. Each has its own advantages and disadvantages, which should be assessed during the system’s design phase for the healthcare field. Among the open-source software licensed under the GNU General Public License, one can mention QGIS, driven by volunteers from around the world. On the other hand, among proprietary software options, ArcGIS Pro by Esri stands out as a global giant in this market niche, with its slogan “The Science of Where.” Esri developed the shapefile format in the early 1970s, which revolutionized the storage and processing of geospatial data.
However, these two elements alone are not sufficient for the construction of a GIS, as mentioned earlier. Acquiring computers with sufficient processing power to handle the volume of data entering the system is of great importance. Currently, with the vast amount of available data, one frontier of this technology is the use of cloud-based supercomputers, such as Google’s Application Programming Interface (API), the Google Earth Engine. This enables working with petabytes of geospatial data [32]. Additionally, skilled individuals in the fields of geoprocessing, remote sensing, and programming are essential to ensure the successful construction of a GIS project.
3.1 Geographic information system (GIS) software. Presentation of the main GIS software used in health
There are many GIS software options available, and each one has tools that can be used in health applications. However, some of the most used software in this field can be found in Table 3.
GeoDa is a free and open-source software designed to facilitate spatial analysis and data modeling.
SaTScan™ is a free software specifically focused on spatial statistics in the health domain. While it can be used in other areas, it is particularly well-suited for health-related studies and is supported by international foundations and institutes in the health field.
Epi Info 7™, developed and maintained by the CDC (Centers for Disease Control and Prevention) in the United States, is a public software specifically designed for health applications. It offers mobile, desktop, and cloud versions, allowing the generation of input databases through forms and enabling spatial analysis, mapping, and planning of epidemiological surveillance systems.
MapWindow GIS is an open-source desktop GIS software project that provides flexibility for programming and the deployment of plugins.
QGIS is the most widely used free and open-source GIS software worldwide. Maintained by volunteers and supported by donations, it offers numerous plugins and programming capabilities, including Python scripting, attracting a large user community.
ArcGIS Pro is a proprietary software that allows customization through open-source code, enabling programmers to develop specific plugins for their work. It is a leading software in the industry, although its high cost should be considered during the planning of the desired solution.
Additionally, Table 4 presents some global geospatial databases in the health field.
The description of the main tools and algorithms used in spatial analysis aims to identify existing patterns in geographic data and determine relationships between different spatial variables. For this purpose, the tools used in geoprocessing for spatial analysis are grouped into Spatial Statistics, Geostatistics, Uncertainty Representation, and Dynamic Modeling [20].
Other classifications of spatial analysis tools can be found in the literature, based on data models such as points, lines, areas, tabular data, networks, and images [33]. However, Rosa [34] highlights the most common spatial analysis operations in GIS, which can be subdivided into reclassification, overlay, weighting, cross-tabulation, neighborhood analysis, network analysis, and querying georeferenced databases.
Reclassification is performed to improve the visual representation of data or when the attributes of the original data are not suitable for the analysis of the specific problem. For example, in the MapBiomas project (https://mapbiomas.org/), the categories of land use and land cover in the Amazon region can be too detailed for an epidemiological study that requires relating a specific vector with the environment. In such cases, the land use and land cover categories can be grouped into a smaller number, indicating areas with low, medium, and high risk of contact with the vector.
Overlay is often used when extracting data from two or more maps, such as determining areas where a specific land use type occurs on certain soil types. Soil information is contained in one map, while land use information is in another. This function allows for analysis based on a Boolean approach.
Weighting involves generating a weighted average map based on multiple information layers in the database, such as soil, topography, geology, and vegetation cover. A typical example of weighting is the creation of agricultural suitability maps using various information layers.
Cross-tabulation calculates the intersection areas between classes from two information layers, determining the areas of intersection. Table 5 presents the results of a cross-tabulation between slope and land use maps in a specific watershed.
Land Use and Land Cover Category
(%)
<2
2 a 5
5 a 10
>10
Forest
549
96,75
9,25
—
Savannah
392,5
2,75
1,75
20,05
Pasture
29,969,75
9207,75
3537,25
565,75
Reforestation
9804,75
1247
188,5
13,5
Perennial Crop
254,25
55,25
—
—
Table 5.
Result of the cross-tabulation between two information layers (in hectares).
These spatial analysis tools play a crucial role in uncovering insights and relationships within geographic data, aiding decision-making processes in various fields, including public health and epidemiology.
Neighborhood operators select an area located at a certain distance from a feature of interest. Generally, the user can specify a distance criterion (radius, elevation threshold, etc.) from an object within the information layer, and this function generates a new information layer containing the impact zone around the selected object. For example, from the information layer containing contour lines of a specific area, a new information layer can be generated using this function to identify areas within a certain altitude range. An example of applying the neighborhood operation is the determination of environmental protection areas around watercourses and reservoirs.
Network analysis encompasses a variety of types, and its main applications include determining the shortest path, flow functions, and hydrology. A complex network analysis function involves delineating drainage basins by calculating the direction of surface flow using topographic maps. Another example is evaluating alternative routes for emergency vehicles based on a combination of total path distance and anticipated congestion, which is dependent on the time of day.
Querying a georeferenced database, using the key attribute of GIS, which is the linkage of spatial variables with alphanumeric data stored in a geographic database, allows for queries using SQL (Structured Query Language) in many software applications. For example, using a map and a georeferenced database organized by municipalities, one can answer questions such as: Which municipalities have a population density equal to or greater than 5 inhabitants per square kilometer? Locate on the map the cities located within 60 km of municipality X. What is the distance between cities X and Y?
Geographic analysis techniques consist of primitive spatial operations that can be applied to one or more information layers with the aim of creating new information layers or calculating measures. The combination of these operations is mostly performed using Boolean algebra.
3.3 Exploration of clustering techniques, density analysis, and spatial interpolation
Some spatial statistics techniques in geoprocessing allow for confirmatory analysis, verifying the existence of perceived clusters, or exploratory analysis, searching for cluster patterns. Clustering methods can provide answers to a range of public health questions, such as: Are there unusual clusters of health events in an area? Which locations have a high prevalence of a certain disease? Where are the risks of a disease higher or lower?
Cluster detection methods can be divided into three groups: global methods, which assess clustering in the entire study area; local methods, which identify the location of clusters; and specific methods, which evaluate clustering around a point source, such as a hazardous facility.
The local measure of spatial autocorrelation, known as LISA (Local Indicators of Spatial Autocorrelation), is a measure of clustering that relates a particular location to the values of adjacent areas. Conversely, the Moran’s Index (a global method) can be used to assess whether the sampled data exhibit spatial autocorrelation across the entire area. The LISA statistic for subareas i is calculated using Eq. (1).
Ii=Zi∑i≠jWijZjE1
Where zi represents the normalized value of the health indicator of interest in zone i, and wij is a spatial weight that measures the proximity between zones i and j [35].
Figures 12 and 13 provide an example of the Moran’s Index and LISA, respectively, conducted by Anselin [36], using data from a classic social science study by Andre-Michel Guerry on crime, suicide, literacy, and other “moral statistics” from 1830 in France. In this specific case, a univariate analysis was performed with the per capita charity donation data (Donatns variable) yielding a Moran’s Index of 0.353, which ranges from −1 to 1. The closer it is to zero, the lower the spatial autocorrelation. The LISA presents a default result for 999 permutations with a p-value of 0.05, with the significance mapping shown on the left and the cluster mapping on the right.
LISA at a significance level of 0.05. Source: Anselin [36].
The Kernel density estimation (heat maps) is not a clustering process itself, but a method for exploring and visualizing patterns of spatial point data presented in concentration areas. As explained by Rizzati et al. [37], it involves transforming point data into a continuous analysis surface through interpolation, allowing for the examination of potential data trends even in areas where no actual data has been collected.
Figure 14 visually demonstrates the principle of Kernel density estimation, and Eq. (2) serves as the basis for calculating the smoothing of probabilities.
Figure 14.
Visual representation of kernel density estimation. Source: Rizzati et al. [37].
λR(P)=∑i=1n1R2k(P−P1R)E2
Where λ is an estimator that depends on P (locations), R is the radius of influence, “n” is the events, and “k” is a bivariate kernel function (which can be quadratic, triangular, uniform, Epanechnikov, or Gaussian).
3.4 Examples of application of spatial analysis tools in health studies
There are several examples of generating geographic information at different scales of analysis in the field of health. The research by Kraemer et al. [38] projects the distribution of diseases such as chikungunya and yellow fever worldwide, considering variables such as human population, climate, and the main transmission vectors of these diseases, Aedes albopictus and Aedes aegypti, respectively (Figure 15).
Figure 15.
(a-d) Projected global geographical distribution in 2050 for Ae. aegypti and Ae. albopictus vectors. (a) Ae. aegypti (b) Ae. Albopictus. (c-d) Projection under different uncertainty scenarios (c) Ae. aegypti and (d) Ae. albopictus. Source: Kraemer et al. [38].
On a more regional scale, the spatial distribution of mortality rates from heart diseases can be observed in Figure 16. The map depicts the rates for adults aged 35 years and older by municipality in the United States from 2018 to 2020. The concentrations of municipalities with the highest mortality rates from heart diseases, represented by the upper quintile, are primarily located in Alabama, Mississippi, Louisiana, Arkansas, Oklahoma, Georgia, Kentucky, Tennessee, and Guam. Additionally, pockets of municipalities with high rates can be found in Michigan, Ohio, West Virginia, Virginia, North Carolina, South Carolina, Missouri, Texas, and Nevada.
Figure 16.
Distribution of heart disease in the United States. Available via the link: https://www.cdc.gov/dhdsp/maps/national_maps/hd_all.htm.
An example of analysis at the local scale is the study by Tao and Cheng [39], which shows the accessibility of health services in Beijing, China (Figure 17).
Figure 17.
Model of accessibility to health services in Beijing, China. Source: Tao and Cheng [39].
3.5 The contribution of data science and machine learning in medical geography
Data science and machine learning play a crucial role in the field of medical geography, and their impact has been emphasized throughout this chapter. The intersection of data science and machine learning with medical geography represents a powerful synergy that plays a fundamental role in improving decision-making in the healthcare domain.
These disciplines provide tools and techniques that enable the analysis and interpretation of health data in spatial and temporal dimensions, thereby facilitating informed decision-making [40]. In this context, geospatial analysis, and the use of geographic information system (GIS) become fundamental allies in exploring the relationships between health and geographical location. This allows for a deeper understanding of disease patterns and the spatial and environmental determinants that influence various health conditions [41].
Medical geography greatly benefits from the application of advanced data analysis and modeling techniques [42]. The incorporation of geographic information system (GIS) and geospatial analysis allows for the investigation of complex relationships between human health and geographical location. This spatial perspective reveals disease patterns that are related to specific spatial and environmental determinants, providing a deeper insight into the epidemiology of various health conditions [41].
Machine learning algorithms are versatile tools that can be applied to large, complex medical data sets. This enables risk assessment, diagnosis, and classification, allowing for the identification of high-risk areas and the characterization of diseases based on their impact and other relevant features [43]. The integration of data from various sources and their standardization through machine learning methods allows for the creation of unified data sets for data-driven medical research [44]. Furthermore, machine learning streamlines the integration of health data at the syntactic, structural, and semantic levels, reducing the need for manual data configuration and refinement [45].
To enhance the processing, analysis, and dissemination of health information using data science and machine learning, a simple framework is proposed to establish basic criteria for interrelating variables from various data sources.
The first step is to obtain reliable data on the type of medical condition under study, tests conducted, demographic characteristics, mobility, and socioeconomic factors in the region of interest. Reliable sources include public health reports, government databases, and mobility data, i.e., data from primary and/or secondary sources.
This involves addressing missing data, removing outliers, and normalizing data to make it suitable for analysis. Feature engineering tasks are also performed to create useful features from raw data.
Visualize and explore the data to identify patterns. This could include heat maps of cases, trend charts over time, and correlation analysis between variables.
Utilize machine learning algorithms to predict high-risk areas. Common approaches include regression or classification models. In this case, the target variable could be the infection rate or the likelihood of an outbreak in a region.
Split the data into training and testing sets and use metrics such as accuracy, recall, and F1-score to assess model performance. Cross-validation can also be used to ensure model robustness.
Implement the model in a real-time system if necessary and continuously monitor data to detect changes in outbreak risk.
11. Results communication
Communicate results to public health authorities and the public. This can aid in decision-making, such as resource allocation for testing, vaccination, or social distancing measures (Figure 18).
Figure 18.
Framework for enhanced health data processing and analysis. Source: The authors.
These tools will have an increasingly significant impact on health geography and can assist in various ways, including identifying health data patterns and trends, predicting disease outbreaks, and optimizing the allocation of healthcare resources at different decision-making levels. When analyzing large data sets, data science, and machine learning can uncover hidden relationships and correlations that may not be evident through traditional methods, providing valuable insights into disease distribution, the identification of high-risk areas, and the specific design of interventions. Furthermore, these technologies can help monitor and track disease spread in real-time, enabling timely response and intervention strategies.
Hence, data science and machine learning have the potential to revolutionize medical geography by enhancing our understanding of health patterns and enabling evidence-based decision-making. It’s essential to note that this is a simplified process, and medical geography is a complex field that may require more sophisticated models, considering factors such as population mobility, virus variants, and governmental responses. Additionally, it is crucial that the data used is accurate and up to date for the predictions to be valuable in public health decision-making.
11.1 Recommendations for the application of geotechnologies in public health: toward a sustainable and equitable future
Governments should prioritize investment in the development and application of geotechnologies in their public health policies. This is based on information from various sources of first and second-order epidemiological data that can be processed using data science and machine learning. These technologies have the potential to improve resource allocation, epidemiological surveillance, and the response to health emergencies.
Healthcare sector companies should leverage geotechnologies to optimize their operations, not only in administration but also in early detection and timely assistance. This includes the use of geographic information systems for efficient management of medical facilities, route planning for the distribution of medical supplies, and spatial analysis to identify high-demand areas for healthcare services.
On the other hand, it is essential for citizens to be informed about the advantages and challenges of using geotechnologies in healthcare. This will enable them to actively participate in promoting their health and make informed decisions about access to medical services and the adoption of preventive measures.
By implementing these recommendations, we can maximize the potential of geotechnologies to enhance public health, strengthen healthcare systems, identify areas of risk, and facilitate the efficient provision of healthcare services to the population.
12. Conclusions
In conclusion, geotechnologies are a critical component in the field of public health and offer numerous opportunities to improve decision-making and resource optimization. Through the application of geographic information system, spatial analysis, and visualization tools, it is possible to gain a deeper understanding of health issues, identify spatial patterns and trends, and design effective intervention strategies.
Throughout this chapter, the diversity of applications of geotechnologies in public health has been explored, ranging from epidemiological surveillance to health services planning and environmental risk assessment. These technologies have proven to be valuable tools for the analysis and interpretation of spatial data, enabling researchers and health professionals to make informed, evidence-based decisions.
However, it is important to be aware of the challenges associated with the use of geotechnologies, such as the complexity of their implementation, associated costs, and concerns related to data privacy. Addressing these challenges through adequate training, strategic financial investment, and the implementation of robust data protection policies is critical.
Ultimately, by harnessing the potential of geotechnologies in the field of public health, we can improve the quality of life for people, optimize resource allocation, and more effectively address the health challenges facing our society. It is crucial to promote collaboration between governments, businesses, health professionals, and the community at large to maximize the benefits of these technologies and achieve a healthier and more equitable future for all.
Acknowledgments
We would like to express our heartfelt gratitude to the State University of Amapá and the Federal University of Pará for their invaluable support. We extend our sincere appreciation to Professor Marcia Aparecida da Silva Pimentel and Professor Thanan Walesza Pequeno Rodrigues for generously providing us with their time and wholehearted cooperation in facilitating our research endeavors.
Conflict of interest
The authors declare no conflict of interest.
Notes/thanks/other declarations
This research aims to serve as a foundational resource for public servants, empowering them in their decision-making processes by providing systematically organized and geographically referenced data. These insights will be instrumental in planning activities spanning various scales, ranging from the local to the state and even national levels.
References
1.Ness RB, Andrews EB, Gaudino JAJ, Newman AB, Soskolne CL, Stürmer T, et al. The future of epidemiology. Academic Medicine. 2009;84(11):1631
2.Friedman GD, Steinberg B. Primer of Epidemiology. New York: McGraw-Hill; 1994
3.Ness RB, Koopman JS, Roberts MS. Causal system modeling in chronic disease epidemiology: A proposal. Annals of Epidemiology. 2007;17(7):564-568
4.Halloran ME, Ferguson NM, Eubank S, Longini IM, Cummings DAT, Lewis B, et al. Modeling targeted layered containment of an influenza pandemic in the United States. Proceedings of the National Academy of Sciences of the United States of America. 2008;105(12):4639-4644
5.Câmara G, Carvalho M. Análise de eventos pontuais. In: Druck S, Carvalho M, Câmara G, Monteiro A, editors. Análise Espacial de Dados Geográficos Brasília, EMBRAPA. 1st ed. Brasília: EMBRAPA; 2004
6.Gesler W. The uses of spatial analysis in medical geography: A review. Social Science & Medicine. 1986;23(10):963-973
7.Cromley EK, McLafferty SL. GIS and Public Health. New York: Guilford Press; 2011
8.Kirby RS, Delmelle E, Eberth JM. Advances in spatial epidemiology and geographic information systems. Annals of Epidemiology. 2017;27(1):1-9
9.Eberth JM, Kramer MR, Delmelle EM, Kirby RS. What is the place for space in epidemiology? Annals of Epidemiology. 2021;64:41-46
10.Ahasan R, Alam MS, Chakraborty T, Hossain MM. Applications of GIS and geospatial analyses in COVID-19 research: A systematic review. F1000Research. 2022;9:1379
11.Bowen GJ, West JB, Zhao L, Takahashi G, Miller C, Zhang T. Cyberinfrastructure for isotope analysis and modeling. EOS. Transactions of the American Geophysical Union. 2012;93(19):185-187
12.Xavier-da-Silva J. Geoprocessamento para análise ambiental. 1st ed. Rio de Janeiro: D5 Produção Gráfica; 2001
13.Takahashi T. Brazil, Programa Sociedade da Informação (Brazil). 1st ed. Ministério da Ciência e Tecnologia: Sociedade da informação no Brasil: Livro verde, Brasília; Brasília – DF, Brasil. 2000. 203 p
14.Câmara G, Davis C, Monteiro A. Introdução à Ciência da Geoinformação. 1st ed. São José dos Campos: INPE; 2001
15.Fitz PR. Geoprocessamento sem complicação. São Paulo, SP, Brasil: Oficina de Textos; 2008. 160 p
16.Jensen JR. Remote Sensing of the Environment: An Earth Resource Perspective, Prentice Hall Series in Geographic Information Science. 2nd ed. Upper Saddle River, NJ: Pearson Prentice Hall; 2007. 592 p
17.de Silva AB. Sistemas de informações geo-referenciadas: Conceitos e fundamentos. In: Sistemas de informações geo-referenciadas: Conceitos e fundamentos [Internet]. 1st ed. Campinas: Unicamp; 2003 [Accessed: Jul 15, 2023]. pp. 236-236. Available from: https://pesquisa.bvsalud.org/portal/resource/pt/lil-766568
18.INCE F. Digital image processing systems and remote sensing†. International Journal of Remote Sensing. 1983;4(1):129-148
19.Yakamoto J, Landim P. Geoestatística: Conceitos e Aplicações. 1st ed. Sao Paulo, Brasil: Oficina de Textos; 2013
20.Druck S, Carvalho M, Câmara G, Monteiro AMV. Análise Espacial de Dados Geográficos. 1st ed. Brasilia, DF: EMBRAPA; 2004
21.Tosto SG, Rodrigues C, Bolfe E, Batistella M. Geotecnologias e geoinformação: O produtor pergunta, a Embrapa responde. 1st ed. Brasília: EMBRAPA; 2014
22.Longley PA, Goodchild MF, Maguire DJ, Rhind DW, editor. Geographical Information Systems and Science. 2nd ed. Chichester; Hoboken, NJ: Wiley; 2005. 517 p
23.Gomarasca MA. Basics of Geomatics. 1st ed. Berlin: Springer Science & Business Media; 2009. 690 p
24.Magalhães MAFM, Gracie R, Barcellos C. Sistemas de Informações Geográficas em saúde. In: Santos SM, Barcellos C, editors. Abordagens espaciais na saúde pública. 1st ed. Brasilia, DF: Ministerio de Saúde; 2006. pp. 43-81
25.Ramalho WM. Conceitos e Arquitetura de Sistemas de Informações Geográficas. In: Santos SM, editor. Introdução à Estatística Espacial para a Saúde Pública. 1st ed. Brasilia, DF: Ministerio de Saúde; 2007
26.National Academies of Sciences, Engineering, and Medicine. Facilitating Interdisciplinary Research [Internet]. Washington, D.C.: National Academies Press; 2004 . Available from: http://www.nap.edu/catalog/11153 [Accessed: Jul 15, 2023]
27.Stull R. Practical Meteorology: An Algebra-Based Survey of Atmospheric Science. 1st ed. Vancouver: UBC; 2017
28.IBGE. Atlas geográfico escolar. 7 ed. Rio de Janeiro: IBGE; 2016
29.Maciel DA, Diniz JMFS. Radar: Um outro modo de mapear. RadarGeo; 2021
30.PAHO/WHO. Health Information Systems - PAHO/WHO. Pan American Health Organization [Internet]. Available from: https://www.paho.org/en/topics/health-information-systems [Accessed: Jul 15, 2023]
31.Pina MF. Armazenamento dos Dados em SIG. In: Carvalho M, Pina MF, Santos S, editors. RIPISA–Rede Interagencial de Informações Para a Saúde Conceitos Básicos de Sistema de Informações Geográficas e Cartografia Aplicados à Saúde. 1st ed. Brasilia, DF: OPAS-RIPSA; 2000. pp. 41-66
32.Gorelick N, Hancher M, Dixon M, Ilyushchenko S, Thau D, Moore R. Google earth engine: Planetary-scale geospatial analysis for everyone. Remote Sensing of Environment. 2017;202:18-27
33.Gesler WM, Albert DP. How spatial analysis can be used in medical geography. In: Albert DP, Gesler WM, Levergood B, editors. Spatial Analysis, GIS, and Remote Sensing Applications in the Health Sciences. 1st ed. Chelsea, Michigan: Ann Arbor Press; 2000
34.Rosa R. Sistema de Informação Geográfica. 1st ed. Uberlandia: UFB; 2004
35.Anselin L. Exploring Spatial Data with GeoDaTM: A Workbook. 1st ed. Center for Spatially Integrated Social Science: University of Illinois; 2005. 244 p
36.Anselin L. GeoDa documentation. GeoDa Workbook [Internet]. 2020 [Accessed: Jul 15, 2023]. Available from: https://geodacenter.github.io/workbook/6b_local_adv/lab6b.html#fn1
37.Rizzatti M, Batista NL, Spode PLC, Erthal DB, de Faria RM, Scotti AAV, et al. Mapeamento da COVID-19 por meio da densidade de Kernel. Metodol E Aprendizado. 2020;3:44-53
38.Kraemer MUG, Reiner RC, Brady OJ, Messina JP, Gilbert M, Pigott DM, et al. Past and future spread of the arbovirus vectors Aedes aegypti and Aedes albopictus. Nature Microbiology. 2019;4(5):854-863
39.Tao Z, Cheng Y. Modelling the spatial accessibility of the elderly to healthcare services in Beijing, China. Environment and Planning B: Urban Analytics and City Science. 2019;46(6):1132-1147
40.Garg PK. Geospatial Health Data Analytics for Society 5.0. In: Garg PK et al., editors. Geospatial Data Science in Healthcare for Society 5.0. Disruptive Technologies and Digital Transformations for Society 5.0. Singapore: Springer; 2022. pp. 29-58
41.Hurd J, Hurley O, Asghari S. Issues to consider before initiating a project in medical geography. Frontiers in Public Health. 2016;4:1-4
42.Delmelle EM et al. Uncertainty in geospatial health: Challenges and opportunities ahead. Annals of Epidemiology. 2022;65:15-30
43.Boyapati S, Swarna SR, Sharma S, Agrawal R. A review of bigdata and machine learning techniques in healthcare. In: 3rd International Conference on Intelligent Sustainable Systems (ICISS). Thoothukudi, India; 2020. pp. 756-761. DOI: 10.1109/ICISS49785.2020.9315876
44.Tradigo G, Veltri P, Greco S. Geomedica: Managing and querying clinical data distributions on geographical database systems. Procedia Computer Science, ICCS 2010. 2010;1(1):979-986
45.Müller A et al. Machine learning for medical data integration. In: Caring is sharing–Exploiting the value in data for health and innovation. 2023. p. 691
Written By
Melgris José Becerra and Mariano Araujo Bernardino da Rocha
Submitted: 15 July 2023Reviewed: 21 July 2023Published: 13 March 2024
 Open access peer-reviewed chapter