Open Access is an initiative that aims to make scientific research freely available to all. To date our community has made over 100 million downloads. It’s based on principles of collaboration, unobstructed discovery, and, most importantly, scientific progression. As PhD students, we found it difficult to access the research we needed, so we decided to create a new Open Access publisher that levels the playing field for scientists across the world. How? By making research easy to access, and puts the academic needs of the researchers before the business interests of publishers.
We are a community of more than 103,000 authors and editors from 3,291 institutions spanning 160 countries, including Nobel Prize winners and some of the world’s most-cited researchers. Publishing on IntechOpen allows authors to earn citations and find new collaborators, meaning more people see your work not only from your own field of study, but from other related fields too.
Non-Radiolabeled Study to Evaluate the Metabolism and Residue Kinetics of Veterinary Drugs in Food-Producing Animals and Anti-Doping Analysis in Equine Sports: Application of High-Resolution Mass Spectrometry
Written By
Wei Tong, Rose Huang, Ruediger Narbe and Laura Letendre
Submitted: 06 March 2023Reviewed: 10 March 2023Published: 12 May 2023
To purchase hard copies of this book, please contact the representative in India:
CBS Publishers & Distributors Pvt. Ltd.
www.cbspd.com
|
customercare@cbspd.com
The chapter discusses an alternative approach to conduct the metabolism and residue kinetics of veterinary medicine for food-producing animals using high-resolution mass spectrometry in a non-radiolabeled study under the scope of VICH GL46. The application of high-resolution mass spectrometry for anti-doping analysis in horse racing is also briefly discussed. Section 1, Introduction, gives an overview of high-resolution mass spectrometry, metabolism and residue studies, and general requirements for traditional radiolabeled metabolism and residue kinetics studies. The limitations of conducting a radiolabeled residue study will also be discussed. Sections 2 and 3 review the techniques of non-radiolabeled (cold) metabolite profiling/identification with high-resolution mass spectrometry (various data acquisition functions, data mining tools, and the semi-quantitative and quantitative methods for metabolites). Section 4 presents two case studies, where high-resolution mass spectrometry was used for the marker residue and marker to total residue ratio determination in residue studies for gamithromycin in sheep and ciclesonide in horses. The application of high-resolution mass spectrometry in anti-doping analysis and the study of the metabolism of steroids in racing horses is briefly discussed in Section 5. Section 6 summarizes the advantages and disadvantages of the high-resolution mass spectrometry technique and future perspectives for the use of high-resolution mass spectrometry in other fields of veterinary drug development.
Boehringer Ingelheim Animal Health, Drug Safety and DMPK, North Brunswick, NJ, USA
Rose Huang
Boehringer Ingelheim Animal Health, Drug Safety and DMPK, North Brunswick, NJ, USA
Ruediger Narbe
Boehringer Ingelheim Vetmedica GmbH, Drug Safety and DMPK, Ingelheim, Germany
Laura Letendre
Boehringer Ingelheim Animal Health, Drug Safety and DMPK, North Brunswick, NJ, USA
*Address all correspondence to: wei.tong@boehringer-ingelheim.com
1. Introduction
The study of drug metabolism and drug disposition is essential in drug discovery, research, and development in both human and veterinary medicines. Drug metabolism is generally a detoxification process in which drugs are converted to molecular structures/components (metabolites) that are more readily eliminated from the body. Many of these metabolites are pharmacologically inactive and chemically stable, but in some cases, they are active, toxic and/or unstable. Metabolism impacts drug exposure, clearance, and drug-drug interactions and it is therefore essential that the formation of metabolites is investigated during veterinary drug development [1]. This should comprise not only the identification of metabolites but also the determination of the pathways involved in the metabolism of the active substance, to establish potential drug interactions. The relative contribution of the different routes of excretion of the total substance [active substance and metabolite(s)] should be quantified (e.g., expressed as a percentage of the administered dose). This is especially important to veterinary medicine because the drugs and their metabolites (collectively defined as “residues”) can enter the human food chain as well as the environment. Therefore, metabolism and residue kinetics studies in veterinary drug development are needed for human food safety evaluation to ensure that food derived from treated food-producing animals is safe for human consumption [2]. The Veterinary International Conference on Harmonization (VICH) guideline GL46 [3] states that “The human food safety evaluation of veterinary drugs help ensure that food derived from treated animals is safe for human consumption. As part of the data collection process, studies should be conducted to permit an assessment of the quantity and nature of residues in food derived from animals treated with a veterinary drug. These metabolism studies provide data on (1) the depletion of residues of concern from edible tissues of treated animals at varying times after drug administration, (2) the individual components, or residues, that comprise the residue of concern in edible tissues, (3) the residue(s) that can serve as a marker for analytical methods intended for compliance purposes (i.e., monitoring of appropriate drug use), and (4) the identification of a target tissue or tissues, as applicable to national or regional programs.”. One of the important objectives of these studies is to determine the marker residue to total residue ratio (M/T) in edible tissues of food-producing animals to ensure the marker used to determine the withdrawal period is representative, measurable and has a known relationship to the total residue concentration in tissue. Traditionally, in vivo metabolism and residue studies in veterinary drug research were conducted to obtain quantitative information using radiolabeled drugs [3]. Radiolabeled drug metabolism studies are required for product registration of all drugs used in food-producing animals to establish maximum residue limits (MRLs), drug monitoring methods, and withdrawal periods. These radiolabeled drug metabolism studies are expensive and time extensive to perform and must be conducted for every species that will be treated. In some cases, radiolabeled studies are difficult to conduct, e.g., in the case of inhaled or topically administered drugs. VICH guideline GL46 [3] also indicates that the metabolism and residue kinetics in food-producing animals may be conducted by an alternative approach [3]: “Alternative approaches (i.e., not using radiolabeled drug) to characterize the components of the residue in food derived from treated animals might be suitable.” One of the promising techniques to approach this is the use of high-resolution mass spectrometry (HRMS).
HRMS has been widely used in human pharmaceutical R&D for metabolite profiling and identification during early drug discovery and first-in-human (FIH) studies during development [4]. FIH studies are a critical step in drug development to obtain an early readout of human metabolism by profiling the metabolites from plasma samples collected during single and multiple dose studies and to ensure the major metabolites are exposed in preclinical species. Recent advances in data acquisition functions and data mining tools have greatly improved metabolite profiling by HRMS [5, 6, 7, 8, 9]. Software packages are also available from the major mass spectrometer vendors such as Thermo Fisher Scientific, AB Sciex, and Waters. It is now a common practice to use non-radiolabeled drugs to study metabolism without the disadvantage of possibly missing major metabolites. One of the advantages of HRMS is the ability to perform a quantitative–qualitative workflow [10, 11], i.e., the simultaneous quantitation and metabolite structural identification using post-acquisition data mining.
Compared to the large number of published papers describing the use of HRMS in human pharma metabolite profiling and identification, the literature reports on the use of HRMS in veterinary drug analysis, especially with regard to metabolism and residue kinetics supporting human food safety, are scarce. Nonetheless, EU and US regulatory agencies for veterinary medicine have recognized HRMS significantly expands the scope of analytical methods used to monitor chemical residues. There are a few published guidelines containing information on the confirmation of the identity of drug residues by HRMS [12, 13, 14]. In addition, HRMS has been applied in monitoring multiple pesticides and veterinary drug residues in food including edible animal tissues [15, 16]. In the field of anti-doping in horse racing, HRMS also finds more application in studying the metabolism of anabolic/androgenic steroids (AASs) in order to find better ways of detecting the abuse of endogenous steroids, especially the new and more evasive AASs including designer steroids [17].
In order to evaluate the metabolism and residue kinetics of veterinary drugs in food-producing animals in a non-radiolabeled study, the first step is to obtain the metabolite profiles for each tissue matrix without missing any major metabolite(s). Next is to quantitatively or semi-quantitatively estimate the relative amount of each residue (metabolite and the parent drug) in each tissue matrix, choose the marker residue and determine the maker to total residue ratio. In this chapter, we will review the advance of high-resolution mass spectrometry instrumentation over the past 20 years, data mining software, quantitation/semi-quantitation approaches, as well as our experience in applying HRMS in the metabolism and residue kinetics studies supporting human food safety.
2. Advance of HRMS in instrumentation and data mining strategy
The advent of liquid chromatography coupled with mass spectrometry (LC-MS) in the late 1980s and early 1990s revolutionized the way of conducting drug metabolism research in drug discovery and development, especially for metabolite profiling and identification [18]. Before the 1990s, individual metabolites were normally isolated manually by various separation and preparation methods and analyzed by mass spectrometry in an offline fashion. The emergence of commercial triple quadrupole and ion trap mass spectrometers has modernized metabolite identification methods. The application of LC-MS, coupled with the use of radiometric flow detectors enabled the generation of quantitative metabolite profiles in biological matrices in radiolabeled absorption/distribution/metabolism/excretion (ADME) studies. A typical instrument setup and workflow are illustrated in Figure 1. Generally, in vitro (microsomal or hepatic incubations) or in vivo samples (plasma, urine, feces, bile, or tissue) are injected into an HPLC or UPLC after some cleanup steps (e.g., protein precipitation, solid phase extraction, etc.). For radiolabeled drugs, the metabolites in the samples are separated by LC, where the LC flow is normally split post-column to the mass spectrometer and flow scintillation analyzer. Radio-chromatograms and the corresponding total ion chromatograms (may also include data-dependent and data-independent scans) can be obtained simultaneously. For non-radiolabeled drugs, the total LC flow is normally directed to the mass spectrometer. Data mining is then carried out by surveying mass spectra near the retention times of the radio-chromatographic peaks either manually or using the software. Structural elucidation is carried out either manually or with the help of software to assign the proposed metabolite structures. Data-dependent MS/MS data or separate MS/MS or multiple-stage tandem MS (MSn) run data are used to aid structural elucidation. If necessary, definitive structural identification is performed by isolating the metabolite of interest and performing Nuclear Magnetic Resonance (NMR) analysis.
Figure 1.
Typical metabolite identification instrument setup and workflow.
The 2001 paper by Clarke et al., summarized the approaches starting with triple quadrupole mass spectrometry (precursor ion scan, constant neutral loss scan, and MS/MS) to further structural elucidation with ion trap mass spectrometry (MSn) and accurate MS and MS/MS [19]. Until the late 1990s and early 2000s high-resolution mass spectrometers in drug metabolism laboratories were relatively rare, limited to big pharma, and earlier generation of quadrupole time-of-flight (QTOF) mass spectrometers. Since then, the development of the QTOF instrument allowed the production of mass spectral resolution from 10,000 to 80,000 at full width at half maximum (FWHM) with routine mass accuracy of ~2–4 ppm and wider dynamic range [20, 21]. In the mid-2000s, mass spectrometers based on the Orbitrap mass analyzer became available [22]. This mass analyzer enables very high mass spectral resolution of up to 1 million FWHM and mass accuracy <3 ppm [23].
It is the combination of a variety of powerful data acquisition functions of the modern HRMS and data mining techniques that take full advantage of the accurate mass and high-resolution capability and enable routine metabolite profiling with non-radiolabeled samples. We will highlight current practices using HRMS as a platform for drug metabolite identification in the following sections.
2.1 Data-dependent acquisition (DDA)
DDA has been developed to reduce the data acquisition duty cycle and to increase the throughput of metabolite identification [5, 20]. Typically, a full-scan MS is acquired, and the software analyzes the full-scan mass spectra in real-time to determine which precursor ion is subjected for subsequent MS/MS scans based on the selected criteria. After the MS/MS scans were performed, the system cycles back to the full-scan. Ion intensity, accurate mass inclusion list, isotope pattern, pseudo-neutral loss, mass defect, etc. are the commonly selected criteria to trigger the switch from full-scan MS to MS/MS mode.
DDA triggered by ion intensity threshold is the most common, typically referred to as TopN DDA. This generic DDA method does not require prior knowledge of the m/z values of the precursors and has been relatively more effective for metabolite identification of in vitro samples. Direct use of intensity-dependent MS/MS acquisition for biological samples is often limited by overwhelming matrix interferences.
A more practical use of intensity-dependent MS/MS DDA is to trigger MS/MS with the accurate m/z values of the expected or predicted metabolites. This can be achieved by putting the accurate m/z values of the expected or predicted metabolites on the inclusion list. After the survey full-scan MS, the software will analyze the full-scan spectrum in real-time to determine if the m/z of any ions matched those in the inclusion list within a certain mass tolerance window and above a defined intensity threshold. The software will switch to MS/MS mode and acquire the MS/MS spectrum of the ion of interest. DDA with inclusion list based predicted metabolites enhances the probability of acquiring product ion spectra for low-level metabolites in complex biological matrices. While the masses of the predicted metabolites do not exist in the survey scan, the instrument will switch to intensity-dependent MS/MS acquisition. Both full-scan MS and MS/MS spectra for all the expected metabolites can be obtained from a single LC–MS/MS run [24, 25]. This approach reduces the number of steps used in a manual or traditional data acquisition process and, therefore, increases the throughput of metabolite identification.
There are numerous knowledge-based software packages (e.g., META, MetabolExpert, Meteor, etc.), that use biotransformation knowledge- and structure-dependent rules for metabolite prediction. Database-based systems (MDL, BIOVIA (formerly Accelrys), etc.) use published literature and similarity to parent structures. Structure-based system (MetaSite) considers both enzyme-substrate recognition (which is a thermodynamic factor) and the chemical transformations induced by the enzyme (a kinetic factor) and therefore tends not to over-predict the metabolism, which can be the weakness of knowledge- or data-based software. Data processing software from instrument vendors such as Metabolynx (Waters), Compound Discoverer (Thermo Fisher), MetabolitePilot™ (AB Sciex), Mass Hunter (Agilent), MetaboliteTools (Bruker), and MetID Solution (Shimadzu) all provide a metabolite detection software package to perform targeted searching of potential metabolites based on common biotransformation pathways. Mass-MetaSite (Mass Analytica) is a vendor-neutral software that is capable of handling “all-in-one” HRMS datasets from nontargeted Data-Independent Acquisition (DIA) (Section 2.2) as well as data-dependent MS/MS datasets. However, in the case of major metabolites that are formed through uncommon biotransformation or multiple-step pathways, another DDA triggering approaches such as isotope pattern or mass defect will be needed to ensure that no metabolites are missed.
2.2 Data-independent acquisition (DIA)
DIA started with the MSE concept using a QTOF in which two acquisitions are conducted in parallel in full-scan mode, one at low collision energy (~5 eV) and the other at high collision energy (~20–40 eV), and a collision energy ramp can be utilized to obtain wider fragmentation coverage. The mass spectra from low collision energy provide intact molecular ion information, while the mass spectra from the high collision energy contain fragmentation data useful for structural elucidation [26, 27, 28]. The MSE approach does not require prior knowledge of the m/z values of potential metabolites and can perform both full-scan MS and pseudo-MS/MS spectra from a single LC–MS run. However, matrix ions and co-eluting metabolite ions make this technique challenging for assigning low-intensity product ions with their precursor ions. Ideally, baseline separation chromatography and samples with a low matrix background (such as in vitro incubation samples) will be extremely helpful for MSE workflow [28]. The technique does not work well with samples from in vivo sources with high backgrounds from the matrix, such as samples of urine, bile, feces, and tissues.
Similar technology was subsequently implemented in Orbitrap [(‘all ion fragmentation (AIF)’) and AB Sciex TripleTOF® systems (MS/MSALL with SWATH™ (sequential windowed acquisition of all theoretical fragment ions) acquisition)]. While AIF with Orbitrap works similarly with MSE and therefore has similar weaknesses, SWATH™ acquisition fragments all ions across a given mass range in sequential narrow ranges as they emerge from the liquid chromatograph [29]. This approach divides a wide mass range of precursors into multiple narrower windows (~20–25 m/z). The relatively narrow mass window makes it easier to link between the product ions and the corresponding precursor ions and reduces the missing assignment of the product ions.
A hybrid MSM approach that combines inclusion list and ion intensity-dependent acquisition and all-ion fragmentation acquisition using LTQ-Orbitrap, was developed for metabolite identification [30]. The acquired datasets were then subjected to multiple accurate-mass-based data mining tools such as precursor ion filter, multiple mass defect filter (MDF), product ion filter, and neutral loss filter to search for all metabolites of interest [31]. The MSM approach is very powerful in achieving fast detection of common and uncommon metabolites for both in vitro and in vivo samples.
2.3 Other data-dependent acquisition
Isotope pattern-dependent acquisition is also a form of DDA. Halogen (Cl and Br)-containing molecules contain unique isotope patterns which are extremely helpful in the search for drug-related components assuming that these halogen atoms remain intact during biotransformation. With HRMS, more accurate criteria can be set to trigger the DDA. For example, criteria can be set to search for Cl-containing compounds by looking for ion pairs with m/z difference of 1.99705 Da and an intensity ratio of ∼3:1. Similarly, searching for Br-containing compounds uses ion pairs with m/z difference of 1.99795 Da and an intensity ratio of ∼1:1. This approach was demonstrated to be extremely effective in metabolite profiling of complex matrices like bile with the ability to search for drug-derived components and provide MS/MS spectra for structural elucidation in a single LC-MS run [32].
Pseudo neutral loss as a trigger for MS/MS acquisition was developed on QTOF in MSE mode as a useful way to detect metabolites that give characteristic neutral losses upon collision-induced dissociation, which is particularly useful for detecting common phase II metabolites. This DDA experiment monitors m/z differences of ion-pairs (neutral loss) between consecutive low and high collision energy full-scan MS, such as 176.0321of for glucuronides, 129.0426 for glutathione conjugates, and 79.9568 for sulfate conjugates, etc. within a certain mass tolerance window. The specific precursor ions are identified from the low collision energy data and the instrument automatically switches to MS/MS mode to acquire the product ion spectra of those ions [33]. All MS and pseudo-MS/MS and product ion (MS/MS) spectra are also recorded for each sample from the same LC–MS run.
Mass defect-dependent acquisition is developed as another form of DDA utilizing a precursor selection criterion to trigger MS/MS acquisition. Mass defect filter (MDF) was widely used as a post-acquisition data processing method and has been incorporated in the metabolite identification software packages from major instrument vendors. In this case, MDF is applied to analyze full-scan HRMS data and identifies precursor ions with mass defects (see Section 2.4) fall within a specific window of an MDF. Only these ions are automatically followed by MS/MS acquisition. Multiple MDFs are often required to detect different classes of metabolites. This approach performs MS/MS acquisition of both common and uncommon metabolites with little matrix interference in a lot of cases [34, 35]. Currently, this function is only available on AB Sciex TripleTOF® instrument.
2.4 Data mining strategies
HRMS-based data mining strategies can be categorized as targeted and untargeted data mining. Targeted data mining, such as extracted ion chromatogram (XIC), mass defect filter (MDF), isotope pattern filter (IPF), neutral-loss filter (NLF), and product ion filter (PIF), is based on the knowledge of drug properties and relevant metabolic pathways and more suitable for common metabolic pathways. Non-targeted approaches, such as background subtraction, do not require prior knowledge of the drug structure, m/z, or fragmentation and are therefore suitable for both common and uncommon/unknown metabolites. However, eventual structural elucidation of the metabolite will require the structure of the drug.
As indicated in Section 2.1, most of the metabolite data mining software searches for common biotransformation by extracted ion chromatograms with a narrow mass tolerance window (≤5 ppm) and compares the XICs with the control samples to minimize false positives. This is the easiest, most intuitive, and most common approach.
The mass defect of an element is the difference between the exact atomic weight and the nominal atomic weight. Carbon-12 has a mass of exactly 12.0000 Da and therefore the mass defect is “zero”, but all other elements have a uniquely different mass defect. For example, the mass defect of hydrogen and oxygen are 0.007825 and − 0.005085 Da, respectively. Therefore, oxidation with an addition of oxygen will introduce a mass defect of −5.1 mDa. Mass defect of common Phase I and Phase II metabolites normally fall within the 50 mDa window of the parent drug or its cleavage product. MDF was first introduced by Zhang et al. [36] as a software filter to remove interference ions of matrices from the drug and its metabolites in LC/HRMS full scans. The drug-related ions are “enriched” in the MDF processed data for further analysis. Based on the mass defect of the parent drug and its core templates, multiple MDFs each with a narrow MDF filter window of ~50 mDa can be applied to retain the ions derived from the parent drug and its metabolites. MDF has been widely used for both in vitro and in vivo metabolite profiling [37, 38, 39, 40, 41, 42, 43, 44, 45]. Most HRMS vendors provide software packages to perform mass defect filtering. The success of mass defect filtering is also dependent on how complex the matrices are and where the mass defects of the parent drug fall relative to endogenous ions [46].
As discussed in Section 2.3, an accurate mass-based isotope pattern filter is extremely powerful in filtering out the endogenous interference ions for halogen (Cl or Br) containing or stable isotope-labeled drugs [9, 47, 48]. A neutral loss filter is extremely useful for detecting Phase II metabolites. Another useful targeted data mining tool is the product ion filter (PIF). Fragment Ion Search™ (FISh) analysis function in Compound Discoverer (Thermo Fisher) is a PIF that extracts spectral peaks for structurally related features, for example, compounds related to the parent drug that share a common list of fragments.
Although intuitive, the non-targeted data mining tool, background subtraction (BS), is probably the most useful tool for detecting uncommon metabolites [7, 49]. For each ion detected in the analyte file, the algorithm searches the control file if the same ion was also present. If such a target ion is present in the control file within a predefined mass tolerance, the maximal intensity of the ion is multiplied by a predefined scaling factor and subtracted from the intensity of the ion in the analyte file. The algorithm was further improved to tolerate the retention time shift between the control and analyte acquisition runs [8]. The key factor for a better result of background subtraction is the selection of control samples, ideally from the same animals (predose) or animals dosed with the vehicles. A similar function is also built-in to some commercial software packages, for example, the Compound Discoverer (Grouping & Ratios), where the ratios of ions between sample and control are calculated and where a ratio of infinity normally represents a component in the sample but not existing in the control; it, therefore, warrants further investigation.
Although powerful instrument scan functions and data mining tools based on HRMS have been developed, it still needs an integrated approach to ensure no major metabolites are missing from the metabolite profiling and characterization in a non-radiolabeled study [46, 50]. As illustrated in Figure 2, full-scan mass spectra are collected followed by data-dependent MS/MS acquisition or non-selective all-ion fragmentation (or MSE) acquisition using HRMS. Expected metabolites are filtered out by extracting the accurate m/z values of these predicted metabolites. The full-scan accurate mass dataset may then be further processed by multiple MDFs, background subtraction and isotope pattern filtering to detect common and uncommon metabolites selectively and effectively. In addition to this, the data-dependent MS/MS or non-selective MS/MS dataset can also be used to search for metabolites by applying an accurate mass production ion filter and neutral loss filter. In some cases, such as in vitro incubation samples, the UV signal, especially at higher absorption wavelengths (>250 nm), can be helpful in finding metabolites. Once the metabolite profiles are complete and tentative structures are proposed, further characterization may be warranted to understand the precise nature of the metabolic modification such as position and definitive structures.
Figure 2.
Strategies of metabolite profiling and identification using high-resolution mass spectrometry.
In the case of residue studies for veterinary drugs, GL46 [3] indicates that the degree of characterization and structural identification depend on several factors which include the amount of residue present, the concern for the compound or the class of compounds to which it belongs, and the suspected significance of the residue based on prior knowledge or experience. GL46 suggests as a point of reference, major metabolites are those comprising 100 μg/kg or 10% of the total residue in a sample collected at the earliest euthanasia interval (or following attainment of steady-state or at or near the end of treatment for continuous-use drug products).
During the metabolism and residue studies, it is important to know quantitatively the relative ratios of each metabolite in each tissue to the parent at different time points. The purpose of this quantitative step is to assign the marker residue and determine the marker to total residue ratios for each edible tissue and each time point. As indicated in VICH G46 [3], an appropriate marker residue has the following properties: (1) there is a known relationship established between the marker residue and the total residue concentration in the tissue of interest; (2) the marker residue should be appropriate to test for the presence of residues at the time point of interest, i.e., adherence to the withdrawal period; and (3) there should be a practicable analytical method to measure the marker residue at the level of the MRL. Normally, this will be performed with radiolabeling. However, in a non-radiolabeled residue study, depending on the extent of metabolism and the number of metabolites formed and presented in each tissue, it is not possible to quantify every single metabolite, not to mention the analysis needs to be done with a validated method [51].
The simplest and most straightforward approach to quantify metabolite ratios is to use the peak area of each residue from the LC-HRMS full scan data with a narrow isolation window (~5–10 ppm). As it is well known, each molecule’s responses in the mass spectrometers are highly structure dependent. The ion source condition and a mobile phase (solvent and pH) also play a critical role in the mass spectral response. Therefore, the quantitation with the peak area of extracted ion chromatogram is at most semi-quantitative. Practically, this approach can be combined with validated LC-MS/MS assays for the major components in the metabolite profiles. An example is given in Section 4 for the marker to total residue ratio determination in sheep for gamithromycin using non-radiolabeled residue study data. Several methods are reported in the literature that use certain UV or radiometric signals as “calibrator.”
Yang et al. [52] reported an approach to determine the extent of circulating metabolites using “metabolite standards” generated by in vitro incubations at relatively high concentration (50 μM) in combination with the correction for mass spectrometry response based on UV response. The in vitro incubation sample containing all the generated metabolites is spiked in plasma to serve as a single point calibration standard for calculating the metabolite concentrations in pharmacokinetic (PK) samples. Using buspirone as a model compound, the authors compared the concentration versus time profiles of buspirone and its metabolites in rats obtained using a UV correction approach with those obtained with synthetic metabolite standards and calibration curves. It was demonstrated that the estimated metabolite exposure of buspirone using this UV correction approach resulted in the rank ordering of metabolite exposure within three-fold of the value obtained with metabolite standards, in contrast, to eight-fold without UV correction. Although UV is not a universal response detector, its response is generally more universal than MS responses. One of the requirements is that the UV spectra of the metabolite will need to be similar among the metabolites and the parent drug also has a decent turnover in the in vitro incubations to generate enough metabolites for quantitation.
Another approach is to use a radiolabel response of the metabolite as the response factor calibrator for quantitation [53, 54]. In many cases, radiolabel metabolism studies were performed in vitro in laboratory animal-derived hepatic incubations, or in vivo in either laboratory animal or target animal species. The radioactive samples generated in these studies can be saved and served as a calibrator for the residue studies of minor species. In this approach, the HPLC radiometric data for metabolites obtained from profiling other species’ biologic matrices (as percentages) are used in combination with the known specific activity of the parent drug to calculate the concentration of each metabolite. These data can then be used to calibrate the MS instrument response for metabolites of interest, and then metabolite concentrations in the samples of target species can be measured using this calibrated response. This is a very cost-effective method and animal welfare friendly. Radiolabeled in vitro or rodent metabolism studies in general require less material than a large minor species such as equine. In most cases, radiolabeled studies would be already carried out in major species such as cattle or swine and the samples from those studies can also be banked for this purpose.
NMR spectroscopy is another technology that can be used for metabolite quantification without synthetic standards. Both 1H NMR [55] and 19F NMR [56] have been reported in human drug development for this purpose. Fluorine is not found in endogenous compounds; therefore, this method is very selective although the sensitivity is lower compared to mass spectrometry. Quantitative NMR has been reported, validated, and accepted from a bioanalytical perspective for purity determinations. More recently, drug metabolism scientists have reported on its application to metabolites [57]. Isolated metabolites quantitated by NMR can then be used as analytical standards for quantitative LC-MS assays.
Accelerator mass spectrometry (AMS) has been used to support human drug ADME studies for many years [58, 59]. AMS, a technology that measures the intensity ratio between 14C over 12C, can measure extremely low levels of 14C. However, AMS is a destructive technique that does not identify the metabolite, the sample preparation (graphitization followed by combustion and detection of 14C/12C ratio) is relatively labor-intensive and the AMS system is expensive. In addition, each metabolite will need to be separated and fraction collected to be subject(ed) to AMS sample preparation and analysis. In the case of a veterinary drug residue study, this process needs to be repeated for each metabolite, in each tissue, and at each collection time point, which will greatly impede its practicality.
While chemical synthesis of metabolites is technically possible, in practice, intensive resources will be required for the synthesis, purification, and certification. Quantitative LC-MS/MS method development and validation for all metabolites is not practical either. Therefore, the synthesis of major metabolite(s) seems to be the more practical and rational approach. Some of the most effective systems for metabolite synthesis are enzyme-based, such as common in vitro reagents (e.g., liver microsomes), engineered P450s, and microorganisms. These systems represent a vast array of synthetic versatility and potential transformations [60]. Biocatalysts often provide better chemo-, regio-, and/or stereo-selectivity than chemical synthesis. Such bioengineered systems with better catalytic efficacy are now commercially available from CROs such as Hypha Discovery (UK) which offers this kind of metabolite biosynthesis services including chemical synthesis, mammalian biotransformations (S9s / microsomes of liver and other tissues), recombinant enzymes such as PolyCYPs, as well as the purification of metabolites from biological matrices.
4. Feasibility of conducting non-radiolabeled study to evaluate the metabolism and residue kinetics of veterinary drugs in food-producing animals
4.1 Determination of marker to total residue ratio for gamithromycin in sheep with a non-radiolabeled drug residue study
Gamithromycin (GAM) is a novel azalide that belongs to the 15-membered semisynthetic macrolide antibiotics of the azalide sub-class with a uniquely positioned alkylated nitrogen atom at the 7a-position of the lactone ring. The compound was first developed for the treatment of bovine and swine respiratory diseases [61]. Thorough documentation, including food safety studies were prepared and submitted to the European Medicine Agency (EMA) to support the registration of Zactran® (Boehringer Ingelheim Vetmedica GmbH), a GAM-based product, for the treatment and metaphylaxis of bovine respiratory disease (BRD) associated with Mannheimia haemolytica, Pasteurella multocida, and Histophilus somni; and treatment of swine respiratory disease (SRD) associated with Actinobacillus pleuropneumoniae, P. multocida, Haemophilus parasuis, and Bordetella bronchiseptica [62, 63]. The registered claims of Zactran® were later extended for systemic treatment of infectious pododermatitis (foot rot) in sheep associated with virulent Dichelobacter nodosus and Fusobacterium necrophorum [64].
In vivo metabolism of GAM in sheep was similar to in vivo metabolism in cattle, swine, and dog (which were conducted using radiolabeled GAM). The in vitro metabolism study demonstrated that in sheep, as with other species, GAM has limited metabolism and declad (loss of a cladinose) is the major metabolite. This data was used to establish a reliable in vivo and in vitro correlation. In addition, similar PK profiles in sheep, cattle, and swine further support the fact that GAM has similar absorption, distribution, metabolism, and elimination properties across the species [65, 66, 67]. Considering the available data for this minor species (sheep), a non-radiolabeled marker residue study for determination of the M/T ratios in edible tissues and a combination of cold semi-quantitative LC-HRMS and quantitative triple quadrupole LC-MS/MS approach was carried out [61] and accepted by the European Medicines Agency (EMA) [64] to have adequately defined the human food safety profile of Zactran in sheep.
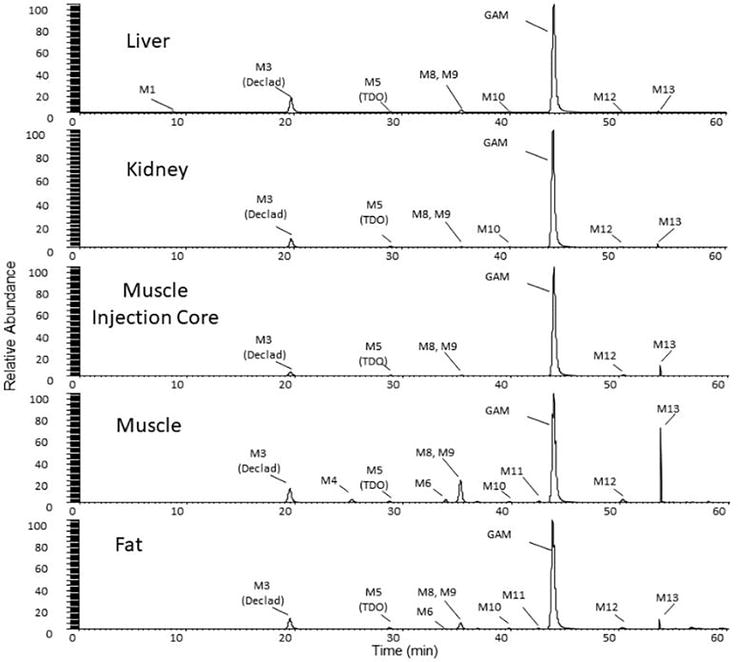
Metabolite profiles of GAM in edible tissues as well as excreta (urine and feces) from sheep treated with subcutaneous injections of Zactran at 6 mg/kg body weight were obtained with HRMS. Representative metabolite profiles in the sheep edible tissues (liver, kidney, injection site core, loin muscle, and peri-renal fat) collected on Day 5 expressed in extracted ion chromatograms (XIC, 10 ppm window) are shown in Figure 3. The relationship between the level of GAM and the total treatment-related residues was semi-quantitatively established by determining the percentages of peak areas of extracted ion chromatograms for metabolites and parent compound residues in each tissue (Table 1) [61].
Figure 3.
Representative metabolite profiles in extracted ion chromatograms for various sheep tissues on day 5 (Ref. [61]).
Matrix
Days Post Dose
M1
M2
M3 (declad)
M4
M5 (TDO)
M6
M7
M8
M9
M10
M11
GAM
M12
M13
Liver
5
0.43
0.05
12
0.13
0.54
0.02
0.03
0.33
1.29
0.77
0.08
83.9
0.31
0.18
9
0.48
0.05
17.4
0.08
0.61
ND
ND
0.23
1.38
0.96
ND
78.3
0.31
0.16
14
0.86
ND
23
0.2
0.51
ND
ND
0.26
1.72
0.72
ND
72.3
0.23
0.21
21
0.88
ND
26.2
0.2
0.52
ND
ND
0.3
2.13
1.03
ND
68.6
ND
0.11
28
0.64
0.3
32.4
ND
0.86
ND
ND
ND
2.63
ND
ND
63.2
ND
ND
Kidney
5
0.02
0.06
7.1
0.07
0.95
0.03
0.01
0.15
0.33
0.46
0.19
89.7
0.44
0.56
9
0.02
0.04
11.2
0.06
0.78
ND
ND
0.18
0.46
0.53
0.15
85.3
0.55
0.72
14
0.09
ND
19.9
0.11
0.63
ND
ND
0.3
0.88
0.46
0.09
76.3
0.49
0.73
21
ND
ND
23.2
ND
0.33
ND
ND
0.31
1.4
ND
ND
74.3
ND
0.45
28
ND
ND
30
ND
ND
ND
ND
ND
2.22
ND
ND
67.8
ND
ND
Muscle
5
ND
ND
8.94
2.13
0.82
1.41
0.06
6.91
5.89
0.58
0.87
70.2
2.1
0.15
9
ND
ND
11.4
3.26
0.46
2.75
ND
20.5
9.32
0.29
0.64
42.5
2.22
6.62
14
ND
ND
13.7
1.46
0.41
13.3
ND
31.3
10.8
ND
ND
25.4
0.67
3.1
21
ND
ND
8.57
1.73
ND
13.4
ND
48.1
18.1
ND
ND
8.19
ND
1.93
Muscle Injection Core
5
ND
ND
3.76
0.05
0.6
0.04
0.001
0.2
0.35
0.27
0.19
91.9
0.94
1.69
9
ND
ND
6.08
0.06
0.64
0.03
ND
0.18
0.45
0.3
0.19
89.6
1.08
1.38
14
ND
ND
7.46
0.03
0.18
ND
ND
0.36
0.74
0.13
0.14
88
0.7
2.2
21
ND
ND
12.8
0.07
0.22
ND
ND
0.24
1.06
ND
ND
83.3
0.62
1.62
28
ND
ND
14.2
ND
ND
ND
ND
0.19
2.49
ND
ND
81.6
0.25
1.26
35
ND
ND
16.9
ND
ND
ND
ND
0.61
2.38
ND
ND
78.5
0.27
1.34
Peri-renal Fat
5
0.1
0.06
7.3
0.11
0.99
0.2
0.02
1.61
2.79
0.67
0.48
83.1
1.21
1.35
9
0.22
ND
14.7
0.54
0.81
0.5
ND
2.56
5.16
0.29
0.31
72.1
1.83
1.05
14
ND
ND
27.2
ND
0.37
0.19
ND
2.63
9.8
ND
ND
59.6
ND
0.25
21
ND
ND
37.7
ND
0.36
0.79
ND
4.47
18.7
ND
ND
37.9
ND
ND
Table 1.
Summary of percent gamithromycin and metabolites in sheep edible tissues from extracted ion chromatogram (%XIC) (Ref. [61]).
ND: Not detected.
A validated liquid chromatography/tandem mass spectrometry (LC-MS/MS) method was used to quantify major components (GAM and its major metabolite, declad). For excreta, metabolite profiles were also obtained, and the major components were quantified with an LC-MS/MS method. Taking into account previous knowledge of marker residue studies in cattle and swine, as well as metabolite data across various species from an in vitro comparative metabolism study, GAM is designated as the marker residue in sheep edible tissues [61].
The marker to total residue ratios were established (Table 2) using quantitative results for the marker residue and declad and the semi-quantitative HRMS results. The GAM residue concentrations in all tissues (liver, kidney, injection site core, injection site ring, loin muscle, and peri-renal fat) are much higher than declad. Depletion of GAM followed first-order kinetics with the liver showing the slowest depletion rate among all tissues analyzed (Figure 4). The half-lives of GAM depletion in liver, kidney, muscle, fat, injection site core, and injection site ring were calculated to be 5.48, 4.22, 2.55, 2.82, 4.43, and 2.39 days, respectively. The GAM tissue residue levels after Day 21 post-dose followed the order: injection site core > liver > kidney > injection site ring > loin muscle > peri-renal fat. Therefore, the liver is proposed as the target tissue because it has the slowest depletion rate and the residues are the highest after Day 21 post-dose, except the injection site.
Day post dose
Liver
Kidney
Loin muscle
Fat
Injection site core
5
83.9
89.7
70.2
83.1
91.9
9
78.3
85.3
42.5
72.1
89.6
14
72.3
76.3
25.4
59.6
88.0
21
68.6
74.3
8.2
37.9
83.3
28
63.2
67.8
NA
NA
81.6
35
NA
NA
NA
NA
78.5
Table 2.
Estimated Average Gamithromycin (M) to Total Residue (T) Ratios (M/T) from %XIC in Sheep Tissues Using HRMS Data (Ref. [61], bold numbers stand for the selected M/T ratio for each tissue).
Figure 4.
Depletion of Gamithromycin residues in various sheep tissues (Ref. [61]).
Based on VICH GL 46 [3], GAM can be designated as the marker residue with the following rationale: (1) A known relationship was established between GAM and total residue in the edible tissues as shown in Table 2; (2) GAM is appropriate to test for the presence of residues at the proposed withdrawal periods estimated; and (3) An LC-MS/MS analytical method is available for the determination of GAM concentrations in all sheep edible tissues [61].
4.2 Non-radiolabeled residue study for ciclesonide in equine
The Aservo®EquiHaler® - an inhaler containing the inhalation solution, is indicated for use in horses for the alleviation of clinical signs of severe equine asthma. The dosing apparatus includes a polyurethane nostril adapter which provides 343 micrograms of ciclesonide per actuation. The Aservo®EquiHaler® is an example where safety was established and radiolabeled in vivo metabolism and residue kinetics studies may not be required: The active ingredient, ciclesonide, is a novel drug in veterinary medicine and is a pro-drug that is rapidly metabolized into the major active metabolite desisobutyryl-ciclesonide (des-CIC or des-ciclesonide) following inhalation. Des-ciclesonide has a large glucocorticoid-receptor affinity and demonstrates anti-inflammatory properties which are exerted through a wide range of inhibitory activities. Given that horses are a minor species with a limited market status, a minor use minor species (MUMS) market authorization could be granted. Consequently, the possibility to use HRMS could be investigated.
In vitro metabolism of ciclesonide in rat, dog, and human liver microsomes showed no significant interspecies differences. At least three metabolites were formed in all three species: major metabolite (M1, formed by de-esterification of ciclesonide), M2 (the 6-hydroxy derivative of M1), and M3 (the 23 or 24 hydroxy derivatives of M1). In vitro metabolism studies using horse liver slices revealed 33 different metabolites. The three major metabolites (des-CIC and two isomers of hydroxycyclohexane des-CIC) and three minor metabolites (dihydroxycyclohexane des-CIC, isomer of hydroxycyclohexane des-CIC, and hydroxysteroid des-CIC) were identified by LC-MS/MS. These metabolites are comparable to those identified in other animal species [68].
A non-radiolabeled study was performed to establish the marker to total ratio in equine tissue samples using semi-quantitative high-resolution mass spectrometry after repeated inhalation administration of ciclesonide for 10 days in healthy male and female horses [69]. Reference standards for the major metabolite of ciclesonide (Figure 5) were synthesized using various approaches including the microbial system. Response factors of the M3 metabolites, desisobutyryl ciclesonide, desisobutyryl ciclesonide oleate, and desisobutyryl ciclesonide palmitate relative to the parent (ciclesonide) in a particular tissue were determined by spiking equal molar concentration of each compound in that tissue. The results showed that ciclesonide and des-CIC were the only circulating drug-derived components detected in plasma. The metabolite profiles were qualitatively similar in all selected tissues. Only very low levels of ciclesonide and/or des-CIC were detected in muscle, liver, kidney, and lung. Very low levels of desisobutyryl ciclesonide oleate were also detected in Day 10 lung samples. Relatively higher amounts of ciclesonide and des-CIC and very low levels of M3 metabolites were detected in fat. A GLP study to establish residue depletion in the horse was performed [68]. After the standard 10 days treatment period, groups of four horses were euthanized at 12 hours, 3 days, 6 days, and 9 days following the final treatment (group 1, 2, 3, and 4, respectively). Liver, kidney, fat, loin muscle, and lung were collected and analyzed for des-CIC, and the metabolites M3-2 and M3-4 using validated LC-MS/MS methods. The metabolites M3-2 and M3-4 were below or close to the limit of detection in-vivo, and were under the Lower Limit of Quantification (LLOQ) at the first sampling point, i.e., 12 hours after the last dose.
Figure 5.
Structures for reference standards of ciclesonide and its metabolites.
The results of both the semi-quantitative HRMS analysis and the quantitative analysis of the pivotal marker residue depletion study are consistent. The results of both studies show that the major metabolite of ciclesonide in vivo is des-CIC. Although M3-2 and M3-4 were the major observed metabolites found in in vitro studies, this could not be confirmed in vivo—neither in tissues nor in plasma most likely due to their extremely low levels. Considering the uncertainties in the HRMS study due to the limited number of metabolites detected, and the relatively low sensitivity of the full scan HRMS method, a conservative approach was used to establish a conservative marker to total residue ratio. Therefore, to support the market authorization, the ratio of marker to total residues was conservatively set to 0.5 for muscle and fat, 0.15 for liver, and 0.25 for kidney based on mean residue levels seen across the first three time points [68].
5. Application of HRMS for equine sports anti-doping
Anti-doping in equine sports poses different challenges compared to those in human sports. Compared to human sports, many more banned substances or controlled medications must be controlled in equine sports. It is not only limited to the prohibited list of banned and controlled medication substances by Fédération Equestre Internationale (FEI) [70] but also extends to other compounds with similar chemical structures or similar biological effects including designer drugs. The development of comprehensive screening methods that can detect all illegal substances is virtually impossible.
Traditionally, GC-MS has been widely used for AAS screening with sensitivity and selectivity that are ideally suited for low-level analytes and complex biological matrices [71, 72]. In addition, enormous amount of knowledge and experience were accumulated over the years for GC-MS-based AAS testing in human and sport horses. However, the sample processing is labor intensive. Although LC-MS has become increasingly more popular technique in doping screening, the detection of saturated hydroxysteroids by LC-MS is still not ideal due to their low ionization efficiency in electrospray ionization sources. In the last 10–15 years, HRMS has seen more applications in multiple-drug screening methods with the accurate mass measurement at high resolution to overcome the interferences from the matrix. The HRMS approach also enables retrospective analysis by reprocessing previously acquired data with new data mining tools when new doping agents reveal without re-processing and re-analyzing the suspect samples. The method development to incorporate new substances into the HRMS method is also much easier. Kioussi et al. [73] have developed a generic screening method for horse doping screening by LC-TOF-MS, GC-HRMS, and GC-MS. A combined implementation of LC-MS and GC-MS analysis was established using the same sample preparation method. The sample pretreatment began with two parallel procedures: enzymatic hydrolysis of sulfate and glucuronide conjugates, and methanolysis of the 17β-sulfate steroid conjugates. The extracts were subjected to LC-TOF-MS, GC-HRMS, and GC-MS analysis. Most of the prohibited substances were identified through LC-HRMS without prior derivatization. Library searching using automated mass spectral deconvolution and identification system (AMDIS) combined with deconvolution reporting software (DRS) was used to enhance the screening. The method detects over 350 target analytes in horse urine and may easily incorporate many new substances without changes in chromatography. The full scan HRMS data allows retrospective identification of new prohibited substances by data reprocessing.
For confirmatory analysis, it is required to compare the data from the collected samples (urine or plasma) with a reference standard. Either fully characterized synthetic standards or those derived and isolated from in vivo or in vitro metabolism studies can be used for this purpose. For designer steroids, which have been synthesized for the purpose of performance enhancement but evade detection, it is difficult to detect them in a biological matrix using common GC-MS, LC-MS approaches, or by mass spectral library search since all these approaches would require establishing the analytical characteristics with suitable reference materials [74, 75]. In that regard, a good understanding of the metabolism of prohibited substances is important to target the substance itself or its metabolite(s) and more relevant matrix (urine, plasma, hair, etc.). However, due to the substantial number of potentially prohibited substances including designer steroids and over-the counter-supplements [76], it is not possible to conduct in vivo metabolism studies by dosing animals for each AASs not to mention carrying out these studies with radiolabeled materials. For this reason, most of the metabolism studies to understand the metabolism of the AASs were conducted in vitro in equine liver microsomes, S9, hepatocytes, or liver slices/homogenates and with non-radiolabeled materials and HRMS [77, 78]. After the identification of in vitro metabolites, mostly by searching for the accurate mass of predicted metabolites, in vivo metabolism studies can subsequently be performed to follow the identified metabolites in the relevant matrix to determine the longest detection time for controlling the doping abuse. A quick literature search indicated that the data mining tools described in Section 2 are underutilized. In most cases, only targeted data mining techniques are used. This could be one of the future directions by using these modern data mining strategies to ensure no major potential target metabolites are missed in metabolism studies.
Another promising method is to couple the HRMS and chemometrics for the structural characterization of AASs for early detection of unknown designer structures [79]. This method analyzes the mass spectrometric data on trimethylsilyl (TMS)-derivatives of the target AASs acquired by GC-QTOF MS with electron ionization. Five subclasses of steroids were used in the training set according to their structural similarity. The HRMS data was processed by the chemometric models (clustering, discriminant, modeling, etc.) considering over 30 variables, which allowed the identification of class-specific common fragments and structural trends. This will minimize the time needed for identifying unknown AASs by classifying them into a specific category and narrowing the scope of the investigation, which is particularly useful for completely unknown substances. It is hopeful that this approach can be adapted for the analysis of real samples such as urine if the HRMS spectrum under examination is suitably defined.
The development of HRMS over the past two decades has made significant progress in instrument design with various scan functions, data mining tools, and semi-quantitative and quantitative methods for metabolite quantification that make the profiling and identification of metabolites with non-radiolabeled drug routine and reliable. It has been demonstrated over the past 15 years in human drug development under the “Metabolites in Safety Testing” regulatory guidance that this method is mature and reliable. The chance of missing any major metabolite(s) in complex biological matrices is small. This development in instrumentation and data mining techniques will certainly help the understanding of the metabolism of AASs and facilitate the anti-doping analysis in equine sports although currently, the application of advanced data mining techniques in this field is still relatively rare. In fact, even with a radiolabeled drug, due to the position and nature of the label, the metabolites from the part of the molecule that does not contain the radiolabel will not show up in the radiochromatograms. There are even debates in the drug metabolism community concerning the radiolabeled mass-balance excretion and metabolism studies in laboratory animals are still necessary [80, 81]. Innovative “fit-for-purpose” studies may well be a better choice in a particular drug development program than a standard animal ADME “package.” The same applies to the development of veterinary medicine. In our opinion, radiolabeled metabolism and residue studies are still the “gold standard” and should be required for at least one major species in food-producing animals. However, the regulation does allow alternative approaches (i.e., not using the radiolabeled drug) to characterize the components of the residue in food derived from treated animals. As demonstrated with the examples in Section 4 of this chapter, it is feasible that metabolism and residue kinetics in food-producing animals may be appropriately determined using HRMS without a traditional radiolabeled study. The HRMS approach has been shown here to be useful for understanding the M/T ratio and metabolism profile for regulatory purposes. It is particularly useful if prior M/T knowledge in other species is available, and the parent is not highly metabolized or when all major residues can be measured quantitatively by LC-MS/MS. It is important to demonstrate that metabolism across species is similar which can be done with the HRMS method. It is also particularly useful in certain situations when traditional radiolabeled studies are not feasible or safe. In the case of anti-doping analysis, it may be possible to conduct non-radiolabeled metabolism studies in horses directly if needed to overcome the potential disconnection of in vitro and in vivo results. It is not difficult to imagine, even for companion animals, that the “fit-for-purpose” ADME studies may also be performed with a non-radiolabeled veterinary drug to understand the major excretion pathways and safety profiles to renal or hepatic impaired animals as well as to the environment.
2.Beyene T. Veterinary drug residues in food-animal products: Its risk factors and potential effects on public health. Journal of Veterinary Science Technology. 2016;7:1-7. DOI: 10.4172/2157-7579.1000285
3.EMA/CVMP/VICH/463072/2009. Committee for Medicinal Products for Veterinary Use (CVMP) VICH GL46: Studies to evaluate the metabolism and residue kinetics of veterinary drugs in food-producing animals: metabolism study to determine the quantity and identify the nature of residues. 2011
4.Schadt S, Bister B, Chowdhury SK, Funk C, et al. A decade in the MIST: Learnings from investigations of drug metabolites in drug development under the “metabolites in safety testing” regulatory guidance. Drug Metabolism and Disposition. 2018;46:865-878. DOI: 10.1124/dmd.117.079848
5.Zhu M, Zhang H, Humphreys WG. Drug metabolite profiling and identification by high-resolution mass spectrometry. The Journal of Biological Chemistry. 2011;286:25419-25425. DOI: 10.1074/jbc.R110.200055
6.Ma S, Chowdhury SK. Analytical strategies for assessment of human metabolites in preclinical safety testing. Analytical Chemistry. 2011;83:5028-5036. DOI: 10.1021/ac200349g
7.Zhang H, Ma L, He K, Zhu M. An algorithm for thorough background subtraction from high-resolution LC/MS data: Application to the detection of troglitazone metabolites in rat plasma, bile, and urine. Journal of Mass Spectrometry. 2008;43:1191-1200. DOI: 10.1002/jms.1432
8.Zhu P, Ding W, Tong W, Ghosal A, Alton K, Chowdhury S. A retention-time-shift-tolerant background subtraction and noise reduction algorithm (BgS-NoRA) for extraction of drug metabolites in liquid chromatography/mass spectrometry data from biological matrices. Rapid Communications in Mass Spectrometry. 2009;23:1563-1572. DOI: 10.1002/rcm.4041
9.Zhu P, Tong W, Alton K, Chowdhury S. An accurate-mass-based spectral-averaging isotope-pattern-filtering algorithm for extraction of drug metabolites possessing a distinct isotope pattern from LC-MS data. Analytical Chemistry. 2009;81:5910-5917. DOI: 10.1021/ac900626d
10.Bateman KP, Kellmann K, Muenster H, Papp R, Taylor L. Quantitative-qualitative data acquisition using a benchtop orbitrap mass spectrometer. Journal of American Society. 2009;20:1441-1450. DOI: 10.1016/j.jasms.2009.03.002
11.Huang M, Lin Z, Weng N. Application of high resolution MS in bioanalysis. Bioanalysis. 2013;5:1269-1276. DOI: 10.4155/bio.13.100
12.2002/657/EC: Commission Decision of 12 August 2002 Implementing Council Directive 96/23/EC Concerning the Performance of Analytical Methods and the Interpretation of Results (Text with EEA Relevance) (Notified under Document Number C(2002) 3044) - Publications Office of the EU (europa.eu).
13.EURL | Residues of Pesticides | Method Validation & Quality Control Procedures for Pesticide Residues Analysis in Food & Feed (eurl-pesticides.eu).
14.US Food & Drug Administration Office of Foods and Veterinary Medicine. Memorandum: Acceptance Criteria for Confirmation of Identity of Chemical Residues Using Exact Mass Data within the Office of Foods and Veterinary Medicine. 2015
15.Deng X, Yang H, Li J, Song Y, Guo D, Luo Y, et al. Multiclass residues screening of 105 veterinary drugs in meat, milk, and egg using ultra high performance liquid chromatography tandem quadrupole time-of-flight mass spectrometry. Journal of Liquid Chromatography & Related Technologies. 2011;34:2286-2303. DOI: 10.1080/10826076.2011.587224
16.Kaufmann A, Butcher P, Maden K, Walker S, Widmer M. Development of an improved high resolution mass spectrometry based multi-residue method for veterinary drugs in various food matrices. Analytica Chimica Acta. 2011;700:86-94. DOI: 10.1016/j.aca.2010.11.034
17.Teale P, Houghton E. Metabolism of ababolic steroids and their relevance to drug detection in horseracing. Bioanalysis. 2010;2:1085-1107. DOI: 10.4155/bio.10.57
18.Liang C, Wang G, Xie L, Sheng L. Recent development in liquid chromatography/mass spectrometry and emerging technologies for metabolite identification. Current Drug Metabolism. 2011;12:329-344. DOI: 10.2174/138920011795202910
19.Clark NJ, Rindgen D, Korfmacher WA, Cox K. Systematic LC/MS metabolite identification in drug discovery. Analytical Chemistry. 2001;73:430A-439A. DOI: 10.1021/ac012480y
20.Xie C, Zhong D, Yu K, Chen X. Recent advances in metabolite identification and quantitative bioanalysis by LC–Q-TOF MS. Bioanalysis. 2012;4:937-959. DOI: 10.4155/bio.12.43
21.Andrews GL, Simons BL, Young JB, Hawkridge AM, Muddiman DC. Performance characteristics of a new hybrid quadrupole time-of-flight tandem mass spectrometer (TripleTOF 5600). Analytical Chemistry. 2011;83:5442-5446. DOI: 10.1021/ac200812d
22.Makarov A, Denisov E, Kholomeev A, Wilko B, Oliver L, Kerstin S, et al. Performance evaluation of a hybrid linear ion trap/orbitrap mass spectrometer. Analytical Chemistry. 2006;78:2113-2120. DOI: 10.1021/ac0518811
23.Perry RH, Cooks RG, Noll RJ. Orbitrap mass spectrometry: Instrumentation, ion motion and applications. Mass Spectrometry Reviews. 2008;27:661-699. DOI: 10.1002/mas.20186
24.Anari MR, Sanchez RI, Bakhtiar R, Franklin RB, Baillie TA. Integration of knowledge-based metabolic predictions with liquid chromatography data-dependent tandem mass spectrometry for drug metabolism studies: Application to studies on the biotransformation of indinavir. Analytical Chemistry. 2004;76:823-832. DOI: 10.1021/ac034980s
25.Lim HK, Chen J, Sensenhauser C, Cook K, Subrahmanyam V. Metabolite identification by data-dependent accurate mass spectrometric analysis at resolving power of 60,000 in external calibration mode using an LTQ/orbitrap. Rapid Communications in Mass Spectrometry. 2007;21:1821-1832. DOI: 10.1002/rcm.3024
26.Bateman KP, Castro-Perez J, Wrona M, Shockcor JP. MSE with mass defect filtering for in vitro and in vivo metabolite identification. Rapid Communications in Mass Spectrometry. 2007;21:1485-1496. DOI: 10.1002/rcm.2996
27.Wrona M, Mauriala T, Bateman KP, Mortishire-Smith RJ, O’Connor D. ‘All-in-one’ analysis for metabolite identification using liquid chromatography/hybrid quadrupole time-of-flight mass spectrometry with collision energy switching. Rapid Communications in Mass Spectrometry. 2005;19:2597-2602. DOI: 10.1002/rcm.2101
28.Tiller PR, Yu S, Castro-Perez J, Fillgrove KL, Baillie TA. High-throughput, accurate mass liquid chromatography/tandem mass spectrometry on a quadrupole time-of-flight system as a ‘first-line’ approach for metabolite identification studies. Rapid Communications in Mass Spectrometry. 2008;22:1053-1061. DOI: 10.1002/rcm.3472
29.Hopfgartner G, Tonoli D, Varesio E. High-resolution mass spectrometry for integrated qualitative and quantitative analysis of pharmaceuticals in biological matrices. Analytical and Bioanalytical Chemistry. 2012;402:2587-2596. DOI: 10.1007/s00216-011-5641-8
30.Cho R, Huang Y, Schwartz JC, Chen Y, Carlson TJ, Ma J. MSM, an efficient workflow for metabolite identification using hybrid linear ion trap orbitrap mass spectrometer. Journal of the American Society for Mass Spectrometry. 2012;23:880-888. DOI: 10.1007/s13361-012-0351-9
31.Ruan Q , Peterman S, Szewc MA, Ma L, Cui D, Humphreys WG, et al. An integrated method for metabolite detection and identification using a linear ion trap/orbitrap mass spectrometer and multiple data processing techniques: Application to indinavir metabolite detection. Journal of Mass Spectrometry. 2008;43:251-261. DOI: 10.1002/jms.1311
32.Ma S, Chowdhury SK, Alton KB. Application of mass spectrometry for metabolite identification. Current Drug Metabolism. 2006;7:503-523. DOI: 10.2174/138920006777697891
33.Castro-Perez J, Plumb R, Liang L, Yang E. A high-throughput liquid chromatography/ tandem mass spectrometry method for screening glutathione conjugates using exact mass neutral loss acquisition. Rapid Communications in Mass Spectrometry. 2005;19:798-804. DOI: 10.1002/rcm.1855
34.Tian T, Jin Y, Ma Y, Xie W, Xu H, Zhang H. Identification of metabolites of oridonin in rats with a single run on UPLC-triple-TOF-MS/MS system based on multiple mass defect filter data acquisition and multiple data processing techniques, J. Chromatogr. B anal. Technol. Biomed. Life Sciences. 2015;1006:80-92. DOI: 10.1016/j.jchromb.2015.10.006
35.Zhang X, Yin J, Liang C, Sun Y, Zhang L. UHPLC-Q-TOF-MS/MS method based on four-step strategy for metabolism study of Fisetin in vitro and in vivo. Journal of Agricultural and Food Chemistry. 2017;65:10959-10972. DOI: 10.1021/acs.jafc.7b04265
36.Zhang H, Zhang D, Ray K. A software filter to remove interference ions from drug metabolites in accurate mass liquid chromatography/mass spectrometric analyses. Journal of Mass Spectrometry. 2003;38:1110-1112. DOI: 10.1002/jms.521
37.Zhu M, Ma L, Zhang D, Ray K, Zhao W, Humphreys WG, et al. Detection and characterization of metabolites in biological matrices using mass defect filtering of liquid chromatography/high resolution mass spectrometry data. Drug Metabolism and Disposition. 2006;34:1722-1733. DOI: 10.1124/dmd.106.009241
38.Mortishire-Smith RJ, Castro-Perez JM, Yu K, Shockcor JP, Goshawk J, Hartshorn MJ, et al. Generic dealkylation: A tool for increasing the hit-rate of metabolite rationalization, and automatic customization of mass defect filters. Rapid Communications in Mass Spectrometry. 2009;23:939-948. DOI: 10.1002/rcm.3951
39.Ruan Q , Zhu M. Investigation of bioactivation of ticlopidine using linear ion trap/orbitrap mass spectrometry and an improved mass defect filtering technique. Chemical Research in Toxicology. 2010;23:909-917. DOI: 10.1021/tx1000046
40.Deng P, Zhong D, Nan F, Liu S, Li D, Yuan T, et al. Evidence for the bioactivation of 4-nonylphenol to qui-none methide and ortho-benzoquinone metabolites in human liver microsomes. Chemical Research in Toxicology. 2010;23:1617-1628. DOI: 10.1021/tx100223h
41.Liu M, Zhao S, Wang Z, Wang Y, Liu T, Li S, et al. Identification of metabolites of deoxyschizandrin in rats by UPLC-Q-TOF-MS/MS based on multiple mass defect filter data acquisition and multiple data processing techniques, J. Chromatogr. B anal. Technol. Biomed. Life Sciences. 2014;949-950:115-126. DOI: 10.1016/j.jchromb.2013.12.022
42.Bateman KP et al. MSE with mass defect filtering for in vitro and in vivo metabolic identification. Rapid Communications in Mass Spectrometry. 2007;21:1485-1496. DOI: 10.1002/rcm.2996
43.Sun W, Tong L, Miao J, Huang J, Li D, Li Y, et al. Separation and analysis of phenolic acids from Salvia miltiorrhiza and its related preparations by off-line two-dimensional hydrophilic interaction chromatography x reversed-phase liquid chromatography coupled with ion trap time-of-flight mass spectrometry. Journal of Chromatography. A. 2016;1431:79-88. DOI: 10.1016/j.chroma.2015.12.038
44.Zhang D, Cheng PT, Zhang H. Mass defect filtering on high resolution LC/MS data as a methodology for detecting metabolites with unpredictable structures: Identification of oxazole-ring opened metabolites of muraglitazar. Drug Metabolism Letters. 2007;1:287-292. DOI: 10.2174/187231207783221466
45.Zhu M, Ma L, Zhang H, Humphreys WG. Detection and structural characterization of glutathione-trapped reactive metabolites using liquid chromatography-high-resolution mass spectrometry and mass defect filtering. Analytical Chemistry. 2007;79:8333-8341. DOI: 10.1021/ac071119u
46.Zhang H, Zhang D, Ray K, Zhu M. Mass defect filter technique and its applications to drug metabolite identification by high-resolution mass spectrometry. Journal of Mass Spectrometry. 2009;44:999-1016. DOI: 10.1002/jms.1610
47.Rousu T, Pelkonen O, Tolonen A. Rapid detection and characterization of reactive drug metabolites in vitro using several isotope-labeled trapping agents and ultra-performance liquid chromatography/time of flight mass spectrometry. Rapid Communications in Mass Spectrometry. 2009;23:843-855. DOI: 10.1002/rcm.3953
48.Yang A, Zang M, Liu H, Fan P, Xing J. Metabolite identification of the antimalarial piperaquine in vivo using liquid chromatography-high-resolution mass spectrometry in combination with multiple data-mining tools in tandem. Biomedical Chromatography. 2016;30:1324-1330. DOI: 10.1002/bmc.3689
49.Zhang H, Yang Y. An algorithm for thorough background subtraction from high-resolution LC/MS data: Application for detection of glutathione-traped reactive metabolites. Journal of Mass Spectrometry. 2008;43:1181-1190. DOI: 10.1002/jms.1390
50.Ma S, Chowdhury SK. Data acquisition and data mining techniques for metabolite identification using LC coupled to high-resolution MS. Bioanalysis. 2013;5:1139-1315. DOI: 10.4155/bio.13.103
51.EMA/CVMP/VICH/463202/2009. Committee for Medicinal Products for Veterinary Use (CVMP) VICH GL49: Studies to Evaluate the Metabolism and Residues Kinetics of Veterinary Drugs in Human Food-Producing Animals: Validation of Analytical Methods used in Residue Depletion Studies. 2015.
52.Yang Y, Grubb MF, Luk CE, Humphreys WG, Josephs JL. Quantitative estimation of circulating metabolites without synthetic standards by ultra-high-performance liquid chromatography/high resolution accurate mass spectrometry in combination with UV correction. Rapid Communications in Mass Spectrometry. 2011;25:3245-3251. DOI: 10.1002/rcm.5220
53.Yu C, Chen CL, Gorycki FL, Neiss TG. A rapid method for quantitatively estimating metabolites in human plasma in the absence of synthetic standards using a combination of liquid chromatography/mass spectrometry and radiometric detection. Rapid Communications in Mass Spectrometry. 2007;21:497-495. DOI: 10.1002/rcm.2863
54.Xu L, Woodward C, Dai J, Prakash C. Metabolism and excretion of 6-chloro-9-(4-methoxy-3,5-dimethylpyridin-2-ylmethyl)-9H-purin-2-ylamine, an HSP90 inhibitor, in rats and dogs and assessment of its metabolic profile in plasma of humans. Drug Metabolism and Disposition. 2013;41:2133-2147. DOI: 10.1124/dmd.113.054023
55.Dear GJ, Roberts AD, Beaumont C, North SE. Evaluation of preparative high performance liquid chromatography and cryoprobe-nuclear magnetic resonance spectroscopy for the early quantitative estimation of drug metabolites in human plasma. Journal of Chromatography. B, Analytical Technologies in the Biomedical and Life Sciences. 2008;876:182-190. DOI: 10.1016/j.jchromb.2008.10.040
56.James AD, Marvalin C, Luneau A, Meissner A, Camenisch G. Comparison of 19F NMR and 14C measurements for the assessment of ADME of BYL719 (alpelisib) in humans. Drug Metabolism and Disposition. 2017;45:900-907. DOI: 10.1124/dmd.117.075424
57.Walker D, Brady J, Dalvie D, Davis J, Dowty M, Duncan JN, et al. A holistic strategy for characterizing the safety of metabolites through drug discovery and development. Chemical Research in Toxicology. 2009;22:1653-1662. DOI: 10.1021/tx900213j
58.Swart P, Frederic Lozac F, Zollinger M. A Mass Balance and Metabolite Profiling Study of Sonidigib in Healthy Male Subjects Using Microtrace Approach. Hoboken, NJ: John Wiley & Sons Inc.; 2016. DOI: 10.1002/9781118949689.ch10
59.Morcos PN, Yu L, Bogman K, Sato M, Katsuki H, Kawashima K, et al. Absorption, distribution, metabolism and excretion (ADME) of the ALK inhibitor alectinib: Results from an absolute bioavailability and mass balance study in healthy subjects. Xenobiotica. 2017;47:217-229. DOI: 10.1080/00498254.2016.1179821
60.Trosset JY, Carbonell P. Synthetic biology for pharmaceutical drug discovery. Drug Design, Development and Therapy. 2015;9:6285-6302. DOI: 10.2147/DDDT.S58049
61.Tong W, Huang R, Zuo H, Zarabadipour C, Moore A, Hamel D, et al. Feasibility of establishing a veterinary marker to total residue in edible tissues with non-radiolabeled study using high resolution mass spectrometry. Research in Veterinary Science. 2022;149:60-70. DOI: 10.1016/j.rvsc.2022.06.006
62.EMEA/CVMP/220772/2008. Committee for Medicinal Products for Veterinary Use, Summary of Opinion: ZACTRAN. 2008. Available from: https://www.ema.europa.eu/en/documents/smop-initial/committee-medicinal-products-veterinary-use-summary-opinion-zactran-international-non-proprietary_en.pdf
63.EMEA/V/C/000129/X/0027. Committee for Medicinal Products for Veterinary Use, CVMP Assessment report for ZACTRAN for pigs. 2015. Available from: https://www.ema.europa.eu/en/documents/variation-report/zactran-v-c-129-x-0027-epar-assessment-report-variation_en.pdf
64.EMEA/V/C/000129/X/0034. Committee for Medicinal Products for Veterinary Use, CVMP Assessment Report for ZACTRAN to add New Target Species, Sheep. 2017. Available from: https://www.ema.europa.eu/en/documents/variation-report/zactran-v-c-129-x-0034-epar-assessment-report-variation_en.pdf
65.Huang RA, Letendre LT, Banav N, Fisher J, Somerville B. Pharmacokinetics of gamithromycin in cattle with comparison of plasma and lung tissue concentrations and plasma antibacterial activity. Journal of Veterinary Pharmacological Therapy. 2010;33:227-237. DOI: 10.1111/j.1365-2885.2009.01125.x
66.Kellerman M, Huang RA, Forbes AB, Rehbein S. Gamithromycin plasma and skin pharmacokinetics in sheep. Research in Veterinary Science. 2014;97:199-203. DOI: 0.1016/j.rvsc.2014.08.008
67.Hamel D, Richard-Mazet A, Voisin F, Böhne I, Fraisse F, Rauth R, et al. Gamithromycin in swine: Pharmacokinetics and clinical evaluation against swine respiratory disease. Veterinary Medical Science. 2021;7:455-464. DOI: 10.1002/vms3.375
68.EMA/608546/2019. Veterinary Medicines Division, CVMP assessment report for Aservo EquiHaler (EMEA/V/C/004991/0000). 2019. Available from: https://www.ema.europa.eu/en/documents/assessment-report/aservo-equihaler-epar-public-assessment-report_en.pdf
69.Narbe R. Detailed and Critical Summary on the Residue Documentation for Aservo Equihaler. Boehringer Ingelheim Vetmedica GmbH; 2019 (unpublished report)
70.Federation Equestre Internationale (FEI). Equine Prohibited Sub-Stances List. 2023. Available at: https://inside.fei.org/content/anti-doping-rules
71.McKinney AR. Modern techniques for the determination of anabolic-androgenic steroid doping in the horse. Bioanalysis. 2009;1(4):785-803. DOI: 10.4155/BIO.09.52
72.Wong ASY, Leung GNW, Leung DKK, Wan TSM. Doping control analysis of anabolic steroids in equine urine by gas chromatography-tandem mass spectrometry. Drug Test Analysis. 2017;9:1320-1327. DOI: 10.1002/dta.2090
73.Kioussi MK, Lyris EM, Angelis YS, Tsivou T, Koupparis MA, Georgakopoulos CGA. Generic screening methodology for horse doping control by LC–TOF-MS, GC–HRMS and GC–MS. Journal of Chromatography B. 2013;941:69-80. DOI: 10.1016/j.jchromb.2013.10.008
74.Fragkaki, A.G, Kioukia-Fougia, N, Kiousi, P, Kioussi, M, Tsivou, M. Challenges in detecting substances for equine anti-doping. Drug Test Analysis 2017, 9, 1291-1303. DOI: 10.1002/dta.2162.
75.Nielen MWF, Bovee TFH, Van Engelen MC, Rutgers P, Hamers ARM, Van Rhijn JA, et al. Urine testing for designer steroids by liquid chromatography with androgen bioassay detection and electrospray quadrupole time-of-flight mass spectrometry identification. Analytical Chemistry. 2006;78:424. DOI: 10.1021/ac051317q
76.Rahnema CD, Crosnoe LE, Kim ED. Designer steroids – Over-the-counter supplements and their androgenic component: Review of an increasing problem. Andrology. 2015;3:150-155. DOI: 10.1111/andr.307
77.Kwok WH, Leung GNW, Wan TSM, Curl P, Schiff PJ. Metabolic study of androsta-1,4,6-triene-3,17-dione in horses using liquid chromatography/high resolution mass spectrometry. The Journal of Steroid Biochemistry and Molecular Biology. 2015;152:142-154. DOI: 10.1016/j.jsbmb.2115.05.011
78.Choi TLS, Wong JKY, Kwok WH, Curl P, Mechie S, Wan TSM. Metabolic study of methylstenbolone in horses using liquid chromatography-high resolution mass spectrometry and gas chromatography-mass spectrometry. Journal of Chromatography. A. 2018;1546:106-118. DOI: 10.1016/j.chroma.2018.02.041
79.Leogrande P, Botrè F, Torre X, Jardines D, Parr MK, Marini F. Coupling high-resolution mass spectrometry and chemometrics for the structural characterization of anabolic-androgenic steroids and the early detection of unknown designer structures. Talanta. 2021;227:122173. DOI: 10.1016/j.talanta.2021.122173
80.White RE, Evans DC, Hop C, Moore DJ, Prakash C, Surapaneni S, et al. Radiolabeled mass-balance excretion and metabolism studies in laboratory animals: A commentary on why they are still necessary. Xenobiotica. 2013;43:219-225. DOI: 10.3109/00498254.2012.706724
81.Obach RS, Nedderman AN, Smith DA. Radiolabelled mass-balance excretion and metabolism studies in laboratory animals: Are they still necessary? Xenobiotica. 2012;42:46-45. DOI: 10.3109/00498254.2011.621985
Written By
Wei Tong, Rose Huang, Ruediger Narbe and Laura Letendre
Submitted: 06 March 2023Reviewed: 10 March 2023Published: 12 May 2023
 Open access peer-reviewed chapter