Open Access is an initiative that aims to make scientific research freely available to all. To date our community has made over 100 million downloads. It’s based on principles of collaboration, unobstructed discovery, and, most importantly, scientific progression. As PhD students, we found it difficult to access the research we needed, so we decided to create a new Open Access publisher that levels the playing field for scientists across the world. How? By making research easy to access, and puts the academic needs of the researchers before the business interests of publishers.
We are a community of more than 103,000 authors and editors from 3,291 institutions spanning 160 countries, including Nobel Prize winners and some of the world’s most-cited researchers. Publishing on IntechOpen allows authors to earn citations and find new collaborators, meaning more people see your work not only from your own field of study, but from other related fields too.
To purchase hard copies of this book, please contact the representative in India:
CBS Publishers & Distributors Pvt. Ltd.
www.cbspd.com
|
customercare@cbspd.com
The hybrid method allows the overall performance of a fin and tube evaporator to be determined, beginning from local analysis results and combining the accuracy of the data obtained with a small-scale numerical approach with the low processing costs of the analytical approaches. The program calculates heat transfer rates, pressure drops, and temperature fields for both sides of the heat exchanger using regression equations derived from known data (analytical, experimental, or numerical). The hybrid method has been progressively refined and enhanced with the goal of modeling heat exchangers more closely to actual typologies often used for HVAC applications that involve intricate circuit arrangements. In order to aid designers to choose the optimal configuration, various refrigerant circuitry layout choices were examined as well as a proper trade-off analysis was performed.
Department of Management, Finance and Technology, Casamassima (Bari) LUM University, Italy
Silvia Macchitella
Department of Engineering for Innovation, University of Salento, Lecce, Italy
Gianpiero Colangelo
Department of Engineering for Innovation, University of Salento, Lecce, Italy
*Address all correspondence to: starace@lum.it
1. Introduction
In order to save production and operating costs, heat exchangers (HXs) employed for refrigeration application require excellent design and optimization procedures. The design process should be efficient and accurate at the same time, avoiding oversizing that is frequently the result of poor design accuracy and that consequently causes production costs to rise. On the other hand, the higher precision obtained with CFD approaches can significantly slow down the optimization process while still resulting in high design costs.
Corberán et al. [1, 2] developed a distributed model for finned exchangers acting as evaporators and condensers using a control volume approach. This model iteratively calculates the pressure and temperature characteristics on the air and refrigerant side while also incorporating mass, energy, and momentum equations.
Jiang et al. [3] created CoilDesigner, a general-purpose modeling and design tool for air-to-refrigerant heat exchangers that use a “segment-by-segment” methodology. A basic finned-tube coil with complex refrigerant circuitry layout, many working fluids, and no restrictions on the number and positioning of the intake and outlet streams was used for the research.
Tarrad and Al-Nadawi [4] developed a mathematical model utilizing the segment-by-segment method to forecast the performance of a louvered finned-tube evaporator operating with pure and zeotropic refrigerants. It was demonstrated that there was a good correlation between the numerical results and the data coming from the experimental testing done on an air conditioner.
Due to the large number of design factors, the optimization process for a finned-tube HX can be extremely difficult. It has been also demonstrated that, due to constraints that frequently arise in small installation spaces or other manufacturing issues, optimizing the refrigerant path by altering circuit arrangement is the best method for cost savings, as discussed by Yun and Lee [5] and Matos et al. [6]. Some researchers investigated the effect of refrigerant circuit layout by conducting tests with various circuitry layouts, such as Joppolo et al. [7], who performed a numerical study on a fin and tube condenser, estimating the heat transfer rate between air and refrigerant using the ε-NTU method for each element into which the condenser geometry was divided.
Sim et al. [8] and Wang et al. [9] have recently carried out experiments on finned-tube heat exchangers with reversely variable circuitry to improve performance. When a heat pump is used for both heating and cooling, the traditional FTHXs have two-way fixed circuitry with the same refrigerant flow channel in the opposite direction. In tests conducted by Wang et al. [9], it was found that allowing the exchanger’s circuitry arrangement some flexibility - depending on whether it was acting as an evaporator or condenser - increased the heat pump’s overall performance.
Starace et al. [10] created an alternative design procedure called the hybrid method using a multi-scale approach, starting from data sets coming from either analytical or numerical studies or also from experimental investigations in order to reduce computational efforts while achieving a high accuracy of the results. The hybrid approach was originally used on compact cross-flow HXs, where the entire geometry was split into a number of control volumes, each of which had a cold side and a warm side. Through the application of a regression technique, Carluccio et al.’s thermofluidynamic simulation findings on the two finned surfaces of the HXs [11] were used to develop the heat transfer prediction functions, extending the local results throughout the full geometry of the HX.
By using small-scale experiments as a starting point, Fiorentino and Starace [12] created another hybrid technique application for countercurrent evaporative condensers in order to assess their performance. Results indicate that, if compared to experimental tests, the method is accurate and can determine the air temperature and relative humidity at the output with errors of 2.5% and 4%, respectively. Then, Starace et al. [13] applied the method to a plate-finned evaporator with a simple refrigerant circuit configuration that was organized into independent rows and fed uniformly at the top of the exchanger. Moreover, Starace et al. [14] achieved progress in the development of the hybrid technique by applying it on evaporators with complex circuit layouts to assess the impact of circuitry configuration on the overall performance in terms of heat transfer rate and refrigerant pressure decreases. Afterward, the hybrid approach algorithm underwent additional modifications to make it even more adaptable and compatible with real heat exchangers [15]. Part of the algorithm code was altered in order to broaden the model’s application range, and new tests were conducted by changing the operating conditions.
Here, various simulations using the hybrid method on an evaporator with different circuitry layouts together with a trade-off analysis have been carried out to assess the influence of refrigerant circuit configurations on performance while taking into account the effects of two-phase fluid.
The staggered finned-tube exchanger used here works with a refrigerant that evaporates due to heat transfer, while air flows through the fins normally to the tubes. Two or more complex circuits with the same number of pipes each - within which the refrigerant flows - constitute the evaporator. Since the curves connecting the pipes are ignored throughout the heat transfer process, they are regarded as adiabatic (future developments are planned to provide an estimation of the heat losses to be validated with an experimental campaign).
Each of the tube-centered elementary cells into which the entire geometry of the HX is divided is identified by the model using a three-dimensional matrix (Figure 1).
Figure 1.
Schematic representation of the evaporator by a three dimensional matrix [16].
An edge cell without any pipes is positioned at the bottom of each row of odd numbers and at the top of each row of even numbers in the staggered pipes of the evaporator. The properties in the border cells are calculated independently. The heat transfer rate and wall temperature for all other cells are computed using an iterative process that requires the following input data:
the HX geometry;
the arrangement of the refrigerant circuits;
the operating conditions;
the regression coefficients, which are determined by applying the outcomes of experimental, numerical, or analytical research.
Following entering the data, the algorithm determines the refrigerant flow direction, the circuit to which the tube belongs, as well as the branch tube (Figure 2a) or the previous tube in the refrigerant flow order, in order to assign to each cell a refrigerant flow rate and a vapor quality both consistent with the circuit under consideration. The flow rate and vapor quality are set equal to the input values in the first delivery cell of each circuit. For all the subsequent cells, the algorithm assigns the same refrigerant characteristics at the branch pipe’s outlet, assuming that the curve pipe sections are adiabatic. The initial row of the HX is thought to have an evenly distributed airflow; however, the distribution in each of the succeeding rows is created by mixing the air from the cells of the prior rows (Figure 2b).
Figure 2.
Representation of refrigerant (a) and air (b) paths [16].
As long as the convergence condition between the heat transfer rate on the air side and that on the refrigerant side is verified, taking into account the convective contribution of the air and refrigerant and the conductive contribution of the piping, the algorithm iteratively calculates the wall temperature of the pipe for each cell of the HX, as reported in Eq. (1).
Q̇R=Q̇AE1
Correlations in Table 1 provide the additional thermodynamic variables as a function of the inner and outer wall temperatures.
Correlations for calculation of air side and refrigerant side variables.
The heat transfer rates of the edge cells are calculated as a percentage of the neighboring cells’ heat transfer rates, which are found below the edge cell in odd ranks and above in even ranks (Figure 2), instead of being obtained by the convergence method.
Finally, the algorithm verifies pressure drops on the air side and refrigerant side once all cells have been calculated as in Eq. (2).
∆pAij=∑k=1Nk∆pAijkE2
If the condition in Eq. (3) is not satisfied, the algorithm then redistributes the air mass flow rate into each cell again, changing the flow rate according to the error from the mean value.
∆pAij=∆pA,mE3
∆pR,z=∆pR,mE4
As in Eq. (4), the pressure drops for each circuit of the refrigerant should be within 1% of the mean value. The program then distributes the refrigerant flow rates among the circuits until each zth circuit’s condition is confirmed. The conservation of the total input mass flow rate is guaranteed throughout the whole calculation, when changing both the local air and refrigerant flow rates.
The predictive function for calculating the heat power and all the thermodynamic parameters involved is extrapolated through a quadratic regression method with the goal of finding the correlation between the input and output variables on both the air and refrigerant sides. Here, the data used to perform the regression technique were derived from the experimental correlations shown in Table 1. Due to the model’s great flexibility, it is always possible to use available numerical analysis in place of them. While the air side response variables TA,outt,iA,out, and pA,out are determined using Eq. (5), the refrigerant side response variable txR,outis calculated as in Eq. (6).
β·αTE5
β·γTE6
where the 15 polynomial coefficients derived from the regression analysis are the elements of the vector β, and α and γ are the vectors whose elements are displayed in Tables 2 and 3, respectively.
Due to the large number of design factors, the optimization process is quite difficult when facing the design of a HVAC evaporator. For instance, spreading the refrigerant flow across two or more circuits will minimize refrigerant pressure drops when large flow rates are required.
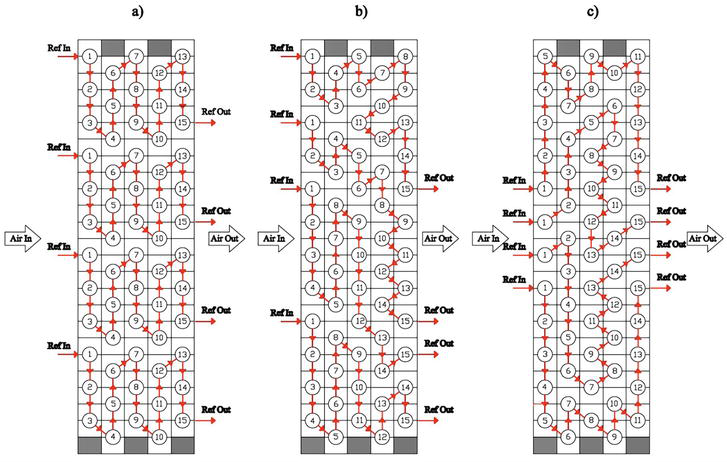
In order to explore the impact of circuit layout on the HX performance in terms of heat transfer rate and refrigerant pressure drops, four distinct simulation tests using three different circuitry designs have been carried out in the present work. There are four different layouts for Set 1, which is represented in Figure 3. All of the circuit inlets are located on the same side of the heat exchanger, while the outlets are situated on the opposite one. The air intake - that flows over the fins normally to the axes of the pipes - is positioned on the same side as the refrigerant inlets. In Set 2 (Figure 4), instead, the air inlet is located on the same side as the refrigerant outlets. The three circuitry arrangements from Set 3 (Figure 5) consist of four-circuit layouts with more pipes per row (12 tubes per row in Set 3, 8 tubes per row in Set 1 and Set 2).
Figure 3.
Circuitry arrangements of Set 1 [16].
Figure 4.
Circuitry arrangements of Set 2 [16].
Figure 5.
Circuitry arrangements of Set 3 [16].
Each test had a clear objective:
investigation on the circuitry arrangements of Set 1 with various refrigerants (test a);
investigation on the circuitry arrangements of Set 1 with various refrigerant flow rates but the same heat transfer rate (test b);
comparison between the circuitry layouts of Set 2 and Set 1 (test c);
investigation on the circuitry layouts of Set 3 made up entirely of 4-circuit layouts to help designers in optimizing evaporator circuit arrangement (test d).
The results of running the hybrid method to a 5-row evaporator with various circuit arrangements are reviewed in terms of heat transfer rate and refrigerant pressure drops as well as compared through a trade-off analysis. With the aim of assisting designers in making design decisions, four tests were conducted on three different sets of configurations, as shown in Table 4. These tests were carried out by varying the refrigerant (test a) and the refrigerant mass flow rate, keeping the same heat transfer rate (test b), the air inlet side (test c), and the number of tubes per row (test d). Table 5 provides a summary of the geometrical parameters of the tested HVAC evaporator.
Quantity
Unit
Test a
Test b
Test c
Test d
Refrigerant fluid
—
a) R134a/R410a/R32 b) R404a/R507a/ R1234yf/R1234ze
R134a
R32
R32
Number of tubes per row
—
8
8
8
12
Refrigerant mass flow rate
kg/s
a) 0.047 b) 0.058
0.047/0.103/ 0.122/0.195
0.036
0.047
Air mass flow rate
kg/s
a) 0.644 b) 0.515
0.644
0.644
0.940
Evaporation temperature
K
271.5
271.5
271.5
271.5
Air inlet temperature
K
288
288
288
288
Air inlet relative humidity
—
0.65
0.65
0.65
0.65
Inlet vapor quality
—
0.2
0.2
0.2
0.2
Air inlet velocity
m/s
a) 5 b) 4
5
5
5
Table 4.
Simulation test setup for test a, test b, test c, and test d [16].
Tubes
Fins
Quantity
Unit
Value
Quantity
Unit
Value
Material
—
Copper
Material
—
Aluminum
Internal diameter
mm
7.38
Thickness
mm
0.1
External diameter
mm
7.94
Pitch
mm
2
Length
mm
500
Longitudinal pitch
mm
21.65
Transversal pitch
mm
25
Table 5.
Geometrical parameters of tested HVAC evaporator [16].
The purpose of test a was to compare performance while varying the number of circuits. Figures 6 and 7 illustrate variations in heat transfer rate and refrigerant pressure drop as a function of the number of circuits, respectively, for cases a) with R134a, R410a, and R32 and b) with R404a, R507a, R1234yf, and R1234ze. Circuitry layouts from Set 1 were used for test a, as illustrated in Figure 3.
Figure 6.
Test a, case a): Heat transfer rate (a.1) and refrigerant pressure drops (a.2) for each of the four circuit layouts of Set 1. Tested refrigerants: R134a, R410a, and R32 [16].
Figure 7.
Test a, case b): Heat transfer rate (b.1) and refrigerant pressure drops (b.2) for each of the four circuit layouts of Set 1. Tested refrigerant: R404a, R507a, R1234yf, and R1234ze [16].
Results showed that when the number of circuits under consideration rises, the heat transfer rate drops approximately linearly. For all the refrigerants taken into consideration, there is a mean reduction in heat transfer rate for the 8-circuit configuration of 11.14% for case a) and 12.12% for case b) compared to the 2-circuit arrangement. A drop in the refrigerant flow rate through each circuit caused by an increase in the number of circuits also brings a reduction in the convective heat transfer coefficient, which has an adverse impact on the overall heat transfer. As a result, the 8-circuit layout’s outlet vapor quality was shown to be worse than the 2-circuit configuration. On the other hand, as the number of circuits increases, flow rate across each circuit decreases, resulting in a strong decreasing of pressure drops with a parabolic pattern for all the refrigerants investigated.
R32 appears to be the most efficient refrigerant in case a) because it has the highest heat transfer rate and almost the smallest pressure drops. The same cannot be said for R1234ze, which has the highest heat transfer rate among case b) refrigerants but also exhibits the highest pressure drops. R134a, on the other hand, performs the worst, with the slowest rate of heat transfer and the greatest pressure reductions.
The R134a refrigerant was used in test b on Set 1 circuitry design (Figure 3), with the goal of comparing various layouts at the same heat transfer rate in terms of refrigerant pressure drops and outlet vapor quality by adjusting the input refrigerant mass flow rate, as stated in Table 4. Results in Figure 8 demonstrate that the 8-circuit configuration, compared to the 2-circuit configuration, has a smaller refrigerant pressure drop at the same heat transfer rate. Therefore, a coil designer could decide for an 8-circuit arrangement to lower operating costs while retaining the same heat transfer rate performance by increasing the refrigerant flow rate. In test b, it is demonstrated that by using an 8-circuit layout rather than a 2-circuit one, it is possible to reduce pressure drops by 45.3% while maintaining the same performance level.
Figure 8.
Test b: Refrigerant pressure drops (a) and mean outlet vapor quality (b) for each of the four circuit layouts of Set 1 [16].
Another effect of selecting a layout with many circuits is that, in order to achieve a given heat transfer rate, the total flow rate must be increased because of the lower local velocities and lower mean outlet vapor quality (in Figure 8b, the vapor quality decreases from 0.99 in the 2-circuit configuration to a value of 0.35 in the 8-circuit configuration (−64%)). Here, the flooded evaporator principle is evident, which denotes the recirculation of the liquid phase and ensures that a saturated vapor exits the evaporator toward the compressor.
test c was performed to compare the circuitry designs of Sets 1 and 2. The only difference between the two sets is that Set 1’s air inlet is situated on the same side as the refrigerant inlets, while Set 2’s air inlet is located on the side with the refrigerant outlets. Both sets have the same refrigerant path and the same number of circuits. R32 served as the working fluid in test c, and the inlet conditions are listed in Table 4. Results in Figure 9 demonstrate how, for Set 2 circuitry layouts, the heat transfer rate linearly reduces as the number of circuits grows (a). However, it is evident from comparing Sets 1 and 2 that the air inlet side has little to no impact on the HX’s heat transfer rate (Figure 9a). In any scenario, Set 2 performs worse than Set 1 with a 0.74% lower average deviation and 6.78% fewer refrigerant pressure drops than Set 1. Finally, the refrigerant pressure drop follows the same parabolic pattern as tests a and b: as the number of circuits rises, the pressure drop drastically declines (Figure 9b).
Figure 9.
Test c: Heat transfer rate (a) and refrigerant pressure drops (b) for each of the four circuit layouts of Set 1 and Set 2 [16].
In order to investigate the effects of the refrigerant path on the coil performance while maintaining a consistent number of circuits, test d was performed using R32 on the three configurations of Set 3. This is the main reason why Set 3’s HX has more tubes per row than Set 1’s and Set 2’s.
For the investigated scenarios a), b), and c) of Set 3 (see Figure 10), there was no discernible effect of the refrigerant path on heat transfer rate. Actually, the largest divergence of the heat transfer rate from configuration a) to b) is −0.03%.
Figure 10.
Test d: Heat transfer rate and refrigerant pressure drops for circuitry arrangement a), b), c) of Set 3 [16].
Pressure loss throughout a refrigeration unit’s whole circuit as well as the change in LMTD brought on by the drop in saturation pressure in both the evaporator and the condenser have an impact on compressor power. As a result, while maintaining the set constraints, the heat exchanger selection is a crucial component of the design of the entire refrigeration unit [26].
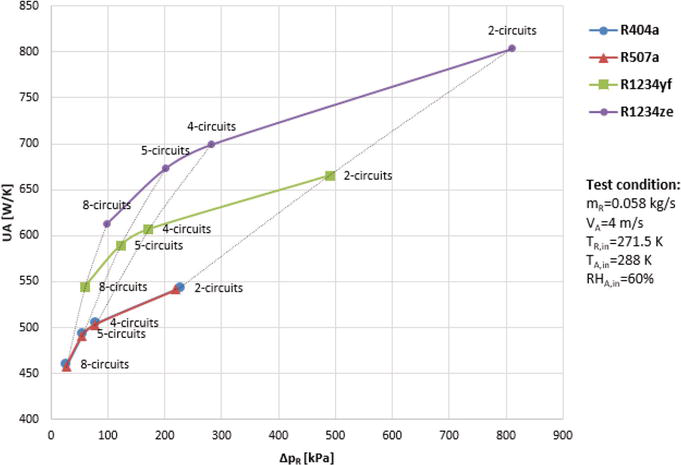
Diagrams in Figures 11 and 12 illustrate the trade-off between UA and ∆pR for multiple refrigerants and per number of circuits, extrapolating data from the test findings presented in Section 3. The same HX geometry and either air or refrigerant inlet conditions were adopted for all testing; however, alternative refrigerant paths were used. Each diagram’s point represents a single tested circuitry arrangement (set 1, Figure 3). It must be emphasized that even if an optimization of the refrigerant path with the same number of circuits is feasible, as proved with test d and as stated in Section 3, the expected modifications in terms of UA and pressure drop would be quite minimal. As a result, it is safe to conclude that the diagrams in Figures 11 and 12 are indicative of the actual evaporator performance with respect to a specific number of circuits.
Figure 11.
UA vs. refrigerant pressure drop diagram for refrigerants R134a, R32, and R410a [16].
Figure 12.
UA vs. refrigerant pressure drop diagram for refrigerants R404a, R1234yf, R1234ze, and R507a [16].
The 8-circuit arrangement results in a modest reduction in UA as well as in a significant decrease of its pressure drop when compared to the 2-circuit layout. All refrigerants exhibit the same trend but with varied curve slope due to the distinctive characteristics of each refrigerant.
When all refrigerants are taken into account and the 8-circuit arrangement is compared to the 2-circuit one, the pressure drop variation range is between 87.63% and 88.05%, with the minimum and maximum changes in UA of 11.36% and 23.69%, respectively. R32 exhibits the best behavior of the evaluated refrigerants from this perspective. With R32, the pressure drop can be reduced by 87.63% when switching from a 2-circuit layout to an 8-circuit one, even with a slight loss in UA of 11.36%. However, using R1234ze results in a more severe decrease of UA, equal to 23.69%, in exchange for a reduction in pressure drop of 87.89% when an 8-circuit design is used on an evaporator rather than a 2-circuit configuration.
A new feature has been added to the previous version of the hybrid method algorithm, aimed to address specific characteristics of plate-finned tube HVAC evaporators with complex circuit layouts. In order to provide designers with meaningful information for the design process, the multi-scale model, which conducts a local analysis to acquire the heat transfer parameters on each elementary volume, was implemented to compare different circuitry layouts. The regression technique was applied to data coming from experimental correlations found in the literature and useful to set up the prediction functions, then used to calculate the thermodynamic parameters both at the refrigerant and air sides. Three sets of circuits were subjected to four distinct simulation tests. The results showed that for all of the investigated refrigerants, heat transfer rate reduces approximately linearly as the number of circuits is increased, but refrigerant pressure drops substantially decrease with a parabolic pattern (R134a, R410a, R404a, R32, R507a, R1234ze, and R1234yf). Other tests with R134a on various circuitry configurations at the same heat transfer rate revealed that an 8-circuit configuration can be chosen to increase the refrigerant flow rate by 314% while maintaining the same performance in terms of heat transfer rate. This will reduce the refrigerant pressure drop by 45.3% and, consequently, operating costs. Additionally, vapor quality degrades when the liquid phase can be recycled through the evaporator to ensure that the fluid arrives at the compressor as saturated vapor, as is flooded evaporators.
Additional research on alternative circuit layouts revealed that the air inlet side had little to no impact on the HX’s performance in terms of heat transfer rate. Nevertheless, designs with the air inlet located on the side opposite the refrigerant entrances performed worse than those on the same side, with an average heat transfer rate deviation of 0.74% less and a reduction in refrigerant pressure drops of 6.78%. Finally, other experiments also revealed that optimizing the refrigerant path is technically feasible while maintaining the same number of circuits, although the advantage in terms of improved performance is low.
In order to provide designers with a standard procedure to evaluate HVAC evaporators’ performance when the circuitry layout varies, trade-off curves illustrating UA versus refrigerant pressure drop were created, using the data extracted from all the tests.
Further activities are planned in order to improve the algorithm of the hybrid method by adding various features such as the modeling of the frost formation and growth on the coil’s surface and a more closer-to-reality mixing of the air in the cells of the ranks following the first one. Furthermore, experimental investigations are scheduled to test the heat losses through the pipe U-bends, the thermal behavior of the edge cells, as well as the accuracy of the method.
1.Corberán JM, de Fernandez Cordoba P, Ortuno S, Ferri V, Setaro T, Boccardi G. Modelling of tube and fin coils working as evaporator or condenser. In: Proceedings of the 3rd European Thermal Sciences Conference. Heidelberg; 2000
2.Corberán JM, García M. Modelling of plate finned tube evaporators and condensers working with R134a. International Journal of Refrigeration. 1998;21(4):273-284
3.Jiang H, Aute V, Radermacher R. CoilDesigner: A general-purpose simulation and design tool for air-to-refrigerant heat exchangers. International Journal of Refrigeration. 2006;29:601-610
4.Tarrad AH, Al-Nadawi AK. Modelling of finned-tube using pure and zeotropic blend refrigerants. In: Proceedings of ATINER’S Conference. Athens; 2015
5.Yun JY, Lee KS. Influence of design parameters on the heat transfer and flow friction characteristics of the heat exchanger with slit fins. International Journal of Heat and Mass Transfer. 2000:43:2529–2539.
6.Matos RS, Laursen TA, Vargas JVC, Bejan A. Three-dimensional optimization of staggered finned circular and elliptic tubes in forced convection. International Journal of Thermal Sciences. 2004;43:477-487
7.Joppolo CM, Molinaroli L, Pasini A. Numerical analysis of the influence of circuit arrangement on a fin-and-tube condenser performance. Case Studies in Thermal Engineering. 2015;6:136-146
8.Sim J, Lee H, Jeong JH. Optimal design of variable-path heat exchanger for energy efficiency improvement of air-source heat pump system. Applied Energy. 2021;290:116741
9.Wang F, Zhao R, Ma C, Huang D, Qu Z. Reversely-variable circuitry for finned-tube heat exchanger in air source heat pump to enhance its overall energy performance. International Journal of Refrigeration. 2022;142:48-57
10.Starace G, Fiorentino M, Longo MP, Carluccio E. A hybrid method for the cross flow compact heat exchangers design. Applied Thermal Engineering. 2017;111:1129-1142
11.Carluccio E, Starace G, Ficarella A, Laforgia D. Numerical analysis of a cross-flow compact heat exchanger for vehicle applications. Applied Thermal Engineering. 2005;25(13):1995-2013
12.Fiorentino M, Starace G. The design of countercurrent evaporative condensers with the hybrid method. Applied Thermal Engineering. 2018;130:889-898
13.Starace G, Fiorentino M, Meleleo B, Risolo C. The hybrid method applied to the plate-finned tube evaporator geometry. International Journal of Refrigeration. 2018;88:67-77
14.Starace G, Macchitella S, Fiorentino M, Colangelo G. Influence of circuit arrangement on evaporator performance using the hybrid method. In: Proceedings of 6th IIR Conference on Thermophysical Properties and Transfer Processes of Refrigerants. Vicenza; 2021
15.Starace G, Macchitella S, Colangelo G. Improvements to the hybrid method applied to the design of plate-finned tube evaporators. In: Proceedings of 77° ATI Conference. Bari; 2022
16.Starace G, Macchitella S, Colangelo G. The hybrid method for the plate-finned tube evaporator design process. In: Proceedings of 76° ATI Conference. Rome; 2021
17.Wang CC, Lin YT, Lee CJ. An airside correlation for plain fin-and-tube heat exchangers in wet conditions. International Journal of Heat and Mass Transfer. 2000;43(10):1869-1872
18.Bourabaa A, Saighi M, Belal I. The influence of the inlet conditions on the air side heat transfer performance of plain finned evaporator. The International Journal for Computation and Mathematics in Electrical and Electronic Engineering. 2011;5(11):1667-1670
20.Kays WM, London AL. Compact Heat Exchanger. 3rd ed. New York: McGraw-Hill; 1984
21.Liang SY, Wong TN. Experimental validation of model predictions on evaporator coils with an emphasis on fin efficiency. International Journal of Thermal Sciences. 2010;49:187-195
22.Ma X, Dinga G, Zhanga Y, Wang K. Airside heat transfer and friction characteristics for enhanced fin-and-tube heat exchanger with hydrophilic coating under wet conditions. International Journal of Refrigeration. 2007;30(7):1153-1167
23.Stephan K, Abdelsalam M. Heat transfer correlations for natural convection boiling. International Journal of Heat and Mass Transfer. 1980;23(1):73-87
24.Choi TY, Kim YJ, Kim MS, Ro ST. Evaporation heat transfer of R-32, R-134a, R-32/134a and R-32/125/134a inside a horizontal smooth tube. International Journal of Heat and Mass Transfer. 2000;43(19):3651-3660
25.Pierre B. Flow resistance with boiling refrigerants – Part 1. ASHRAE Journal. 1964;6(9):58-65
26.Webb RL, Kim NH. Principles of Enhanced Heat Transfer. 2nd ed. New York: Taylor & Francis Inc; 2005
Written By
Giuseppe Starace, Silvia Macchitella and Gianpiero Colangelo
Submitted: 12 January 2023Reviewed: 25 January 2023Published: 23 March 2023
 Open access peer-reviewed chapter