Open Access is an initiative that aims to make scientific research freely available to all. To date our community has made over 100 million downloads. It’s based on principles of collaboration, unobstructed discovery, and, most importantly, scientific progression. As PhD students, we found it difficult to access the research we needed, so we decided to create a new Open Access publisher that levels the playing field for scientists across the world. How? By making research easy to access, and puts the academic needs of the researchers before the business interests of publishers.
We are a community of more than 103,000 authors and editors from 3,291 institutions spanning 160 countries, including Nobel Prize winners and some of the world’s most-cited researchers. Publishing on IntechOpen allows authors to earn citations and find new collaborators, meaning more people see your work not only from your own field of study, but from other related fields too.
To purchase hard copies of this book, please contact the representative in India:
CBS Publishers & Distributors Pvt. Ltd.
www.cbspd.com
|
customercare@cbspd.com
Multi-criteria decision-making methods have been developed to help people or managers in the decision-making process and make the right decision. The Analytical Hierarchy Process (AHP) method is one of the most frequently used multi-criteria decision-making methods and is used in situations where the decision-makers’ objective and subjective decisions need to be evaluated together. This study explains the application of the AHP method in personnel selection in Excel. AHP is an easily applicable method for solving complex problems. In this study, the problem of decision-making of nurses who apply to the intensive care nursing certificate program is handled. The AHP method was used in the solution to the problem. The three nurses have been selected by considering the criteria determined by the training officer who organized the certificate program among the nurses who applied to the program by ranking. The use of AHP in addition to the traditional method at every stage of human resources planning will contribute to the personnel selection process and the efficiency of health service delivery.
Antalya Training and Research Hospital, Antalya, Turkey
*Address all correspondence to: hatice.esen@gmail.com
1. Introduction
Decision-making is one of the most important activities performed by managers and is also known as the core of management. The decision-making process can be defined as the activity that leads to the solution of a decision-making problem involving at least two alternatives, and the chosen one gives the best result according to the determined goal. The decision-making process is carried out by managers intuitively or using decision-making methods [1]. The Analytical Hierarchy Process (AHP) is a frequently used multi-criteria decision-making (MCDM) method, which is a mathematical approach. AHP is a widely used method to provide solutions to multi-objective decision-making problems, developed by Thomas L. Saaty (1970) and was brought to the agenda by Myers and Alpert (1968) [2]. It is a method [3] using the decision-makers experience, knowledge, and intuition [4] to make objective and subjective decisions [5]. In other words, AHP is a method that aims for people to make their own decisions instead of obliging how to make decisions [6].
AHP has a decision hierarchy with some characteristic features applied to various problems. This hierarchy includes decision objectives, criteria, sub-criteria, and alternatives [7]. After determining the hierarchical structure, AHP determines the relative priorities of the alternatives according to the decision-makers preference. At each level of the hierarchy, the decision-maker needs to make two-way comparisons using the alternatives and the importance of the criteria [8, 9].
In addition to its ease of use, AHP is an easy and successful application for solving complex problems that contain objective and subjective judgments [10]. The method is used when there is more than one decision-maker among many conflicting alternatives under certainty and uncertainty [11]. In other words, the AHP methodology allows us to determine which alternative best fits our criteria and the level of importance we attach to them [12].
It is a well-known and widely used multi-criteria decision-making method in various fields, such as machine selection, supplier selection, ambulance allocation, and prioritization of nurses and other resources in health services [6]. For example, for the global forecast of diabetes patients for 2011–2030 [13], to evaluate the performance of hospitals in Taiwan [14], to determine the most appropriate treatment for rectal cancer treatment [15], to compare pregnant women’s recommended delivery [16], to determine efficacy in colorectal cancer treatment [17], to determine dental treatment priorities [18], to determine the criteria to be used in the decision to admit COVID-19 patients to intensive care units [19], and to design and build a decision support system application [20].
AHP attempts to determine the relative importance of each element of a decision by comparing each pair of alternatives at each hierarchy level. Thus, the technique examines multiple alternatives and provides the decision-maker with the relative priorities of the various alternatives under consideration. When applying AHP to a real-life problem, a decision-maker can convert his subjective view to an objective one, which gives the decision-maker confidence that their intuition and experience are not overlooked when arriving at the final ranking of alternatives. The technique’s simple nature and low mathematical complexity make it the most preferred in various industries, including engineering, healthcare, finance, public policy, and business environments [6].
This study consisted of multi-criteria decision-making AHP, AHP implementation steps, and sample AHP works sections in the introduction of the study. The study consisted of five sections. In the first part, general information about multi-criteria decision-making and AHP is given. In the second part, the strengths and weaknesses of AHP were explained. In the third part, AHP steps are mentioned. In the fourth chapter, the solution to the personnel selection problem with AHP is explained and in the last part, the study was evaluated and recommendations made for future studies.
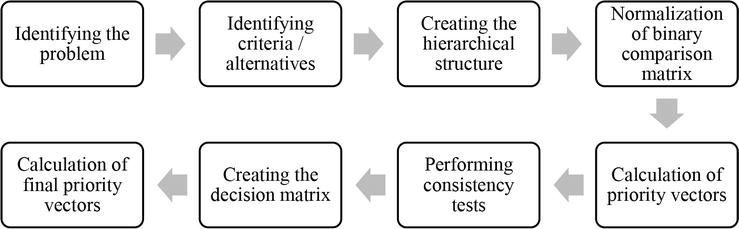
In the first stage of AHP, the problem is clearly defined, and alternatives are determined. Then, the hierarchical structure for solving the problem consists of determining the advantages according to the degree of importance [4] and determining the alternatives if the consistency ratio is acceptable [9].
The stages of the problem-solving process with the AHP method are shown in Figure 1.
Figure 1.
AHP solution process. Source: Ref. [24].
3.1 Creating the hierarchical structure
The first step in AHP analysis is clearly defining the purpose [1] and what is called decision modeling is to create a hierarchy [12]. At the top of the hierarchy, the decision-maker has the ultimate goal to be achieved. With this structure, comparisons can be made easily between the criteria and alternatives determined to achieve the goal [25]. The points to be considered in the design of the hierarchy were explained by Saaty (1990) as follows:
The problem should be explained clearly and precisely.
The problem should cover all factors.
All information that will affect the result should be considered [26].
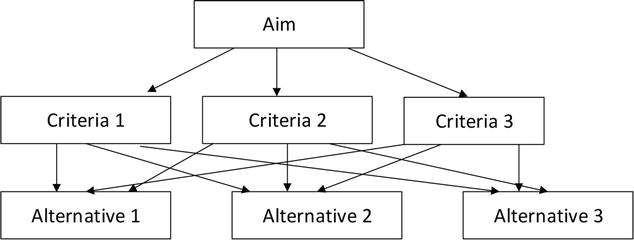
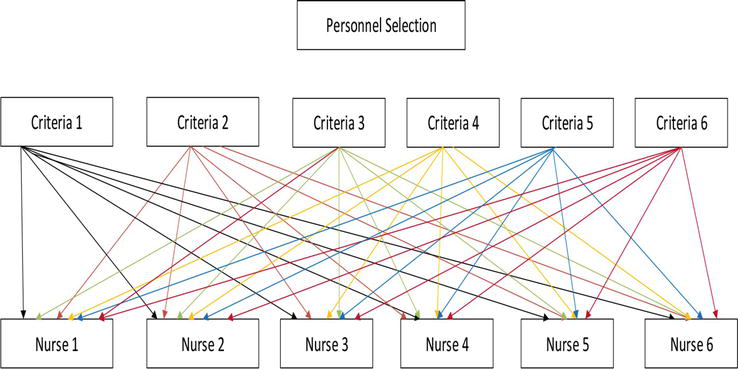
The hierarchical structure of the AHP method is shown in Figure 2.
Figure 2.
AHP hierarchical structure. Source: Ref. [5].
3.2 Creating the binary comparison matrix and determining the weights
After the hierarchical structure is established in AHP, the criteria are compared relative to the importance of determining the priorities [25, 27]. The person or persons who are experts on the subject determine the degree of importance by comparing the criteria at each level in pairs [1]. The comparison matrix for the determining criteria is shown in Table 1. In a matrix with n elements, n (n-1)/2 comparisons are made [21]. For example, comparing criteria 2 and 3 should be evaluated as “which of these two criteria is more important and how important is it to achieve the goal” [22]. Since the relevant factor is compared with itself, the diagonal of the matrix takes the value of 1 [21].
Criteria 1
Criteria 2
Criteria…
criteria j
Criteria 1
W1/W1
W1/W2
…
W1/Wj
Criteria 2
W2/W1
W1/W1
…
W2/Wj
Criteria…
…
…
…
…
Criteria j
Wj/W1
Wj/W2
…
Wj/Wj
Table 1.
Pairwise comparison matrix.
After the hierarchy is established, it is necessary to calculate how important the criteria are to each other, which is their relative importance. The decision-maker determines the degree of importance between the criteria based on the 1–9 scale [28]. The comparison scale developed by Saaty is explained in Table 2.
Importance
Definition
Explanation
1
Equally important
Compared alternatives contribute equally to the defined criteria.
3
Moderately important
The first factor is moderately important compared to the other to achieve the goal.
5
Quite important
The first factor is quite important compared to the other to achieve the goal.
7
Much more important
Factor 1 is very strongly important over the other.
9
Extremely important
The first factor is extremely important compared to the other.
2,4,6,8
Intermediate values
Used when compromise is needed.
Mutual Values
If the value of “x” is compared with the value of “i” and “j”; j will be (1/x) when comparing with i.
Since not all criteria are of equal importance, relative priorities (weights) are obtained [12]. According to the AHP method, the eigenvalues and eigenvectors of the comparison matrix help determine the priority order. The eigenvector corresponding to the largest eigenvalue determines the priorities. The largest eigenvalue of the matrix A is λ enb taken as the W priority vector; (A-λ enb I) W = 0 is obtained by solving the system of equations [30].
3.3 Calculation of eigenvector
For each element in the pairwise comparison matrix, the column vector is calculated with the help of Eq. 1, and the C matrix is created as in Eq. 2 [31, 32].
bij=aij∑i=1naijE1
C=c11c12…c1nc21c22…c2n......cn1cn2…cnnE2
The priority vector showing the importance levels of the factors is obtained, as shown in Eq. 3.
wi=∑j=1ncijnE3
3.4 Calculating consistency ratio
In the AHP method, it is checked whether the comparisons are consistent after the establishment of pairwise comparison matrices and synthesis. For this, the inconsistency rate is calculated in each pairwise comparison matrix, which should be 10% [28]. If the consistency rate is above 10%, the decisions are assumed to be inconsistent, and it is necessary to review the decisions to find the cause of the inconsistency and correct it [12, 31]. If the degree of consistency is acceptable, the process is continued, and the steps are completed. The steps to be followed in calculating the compliance ratio are as follows [33].
The weighted sums of the elements in the columns are calculated for each row of the comparison matrix.
The normal matrix is obtained by dividing the element in each row of the comparison matrix by the total column weight obtained.
A vector of priorities is formed by averaging each row of the normal matrix.
Column vector D is obtained from the matrix multiplication of the comparison matrix A and the priority vector w.
In order to determine the consistent rate of the evaluations made, the compliance rate (consistency) ratio = CR) is calculated. The following formulas are used to calculate this ratio.
CI=Concordance Index
RI=Random Value Index
λmax = It is the average of the values obtained by dividing the elements of the all priorities matrix by the priorities vector [34].
CI=λ−nn−1E5
CR=CI/RI.E6
A hierarchical structure is created if the compliance rate is within acceptable values. Random index (RI) is the mean value of randomly derived pairwise comparison matrices based on n number [21, 35]. The random value indices determined according to the number of criteria are shown in Table 3 [7].
N
one
2
3
4
5
6
7
8
9
10
Random Index (RI)
0.00
0.00
0.58
0.90
1.12
1.24
1.32
1.41
1.45
1.49
Table 3.
Random value index.
3.5 Determining the ranking of alternatives
At this stage, alternatives are determined following the purpose. Obtained alternative evaluations express the importance of subjective perceptions in the decision-makers alternative selection. The sum of the values of the alternatives is 1, and the most suitable alternative with the highest numerical value is [21].
Human resource management and personnel selection are very important in health service delivery. Traditional methods or managerial insights are used in determining the clinics where nurses will be employed in public hospitals and/or the nurses who will participate in certification training. One of the most important resources in hospitals is the personnel and personnel selection is one of the situation in which multi-criteria decision-making methods are most used. In particular, the qualifications of health service personnel may increase service quality, patient satisfaction, and quality of care.
In this study, the solution to the problem by using the AHP method with a scientific approach as well as the traditional method in the selection of nurses to participate in a training and research hospital intensive care certificate program is discussed. Thus, the applicability of multi-criteria decision-making methods in hospitals and the selection of appropriate personnel according to the determined criteria were provided. After the problem was defined, the criteria were determined by the program manager, well-experienced and have been running the program for many years, and is a training nurse working in the training unit. For this study, only the decisions of the program manager were included and the opinion of another expert was not sought. Before the AHP method, personnel selection was generated on limited parameters such as education status and working status in the intensive care unit. By using this method, the selection of personnel who can provide the best contribution to the institution would be made.
4.1 Step-by-step procedure of AHP
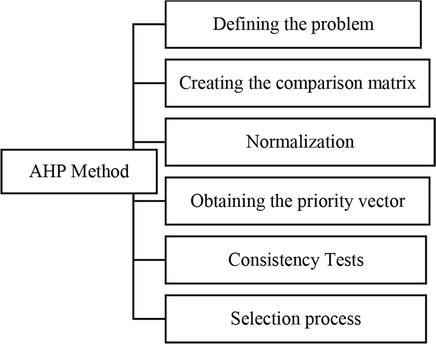
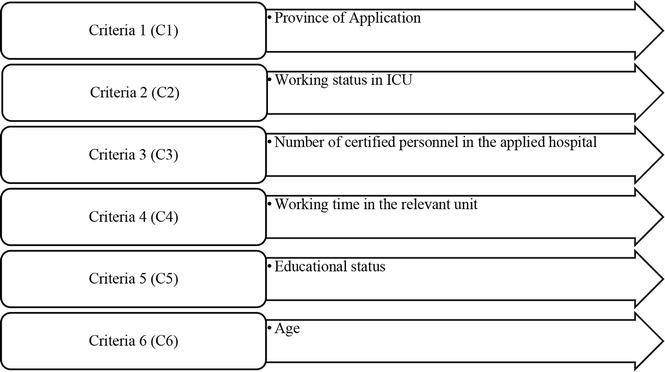
In the case study, we will analyze a personnel selection example with six criteria and six alternatives in Excel. With the application, we will choose three nurses among six, for the intensive care certification program. The nurse criteria to be selected for the certificate program were determined together with the course supervisor (Figure 3). The determined criteria are shown in Figure 4.
Figure 3.
AHP implementation steps. Source: Ref. [18].
Figure 4.
Criteria for a nurse to be selected for the certificate program.
Personnel selection is among the problems in which multi-criteria decision-making methods are applied. Personnel selection criteria were determined by the program manager by taking into account the requirements of the certificate program guide and the needs of the institution.
The personnel selection hierarchy has been established (Figure 5).
Figure 5.
Personnel selection hierarchy structure.
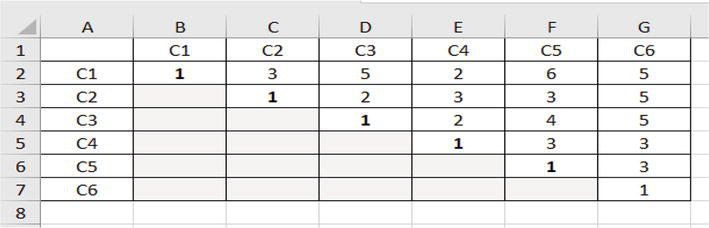
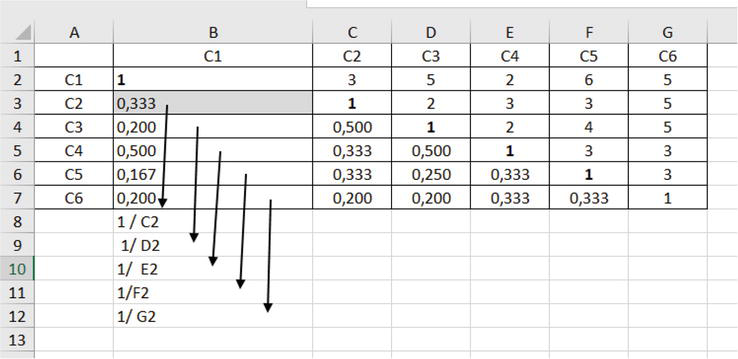
In the AHP method, the criteria are first compared among themselves. Then, considering each criterion, the alternatives are compared. The comparison of the criteria is as follows. Since C1 criteria will not have superiority over C1 criteria, this will be 1. This is why the vertices are made up of 1. When we compare the C1 criteria with the C2 criteria, it is determined how important it is according to the degree of importance table. If the C1 advantage over C2 is 9, which is more important, then the value of C2 over C1 in the same matrix will be the opposite, 1/9.
If opinions are taken from experts in more than one field, a comparison of the binary matrix is taken from each of them separately. Opinions from all experts are collected in a single matrix by taking the geometric mean. The comparison matrix is an n × n square matrix. The matrix components on the diagonal of this matrix take the value 1. In the first stage, the importance level of the pairwise comparison matrix was determined by considering the formulation below (Table 4).
C1
C2
C3
C4
C5
C6
C1
1
3
5
2
6
5
C2
1/3
1
2
3
3
5
C3
1/5
½
1
2
4
5
C4
1/2
1/3
1/2
1
3
3
C5
1/6
1/3
1/4
1/3
1
3
C6
1/5
1/5
1/5
1/3
1/3
1
Table 4.
Determining the significance of the pairwise comparison matrix.
A=a11a12…a1na21a22…a2n......an1an2…ann
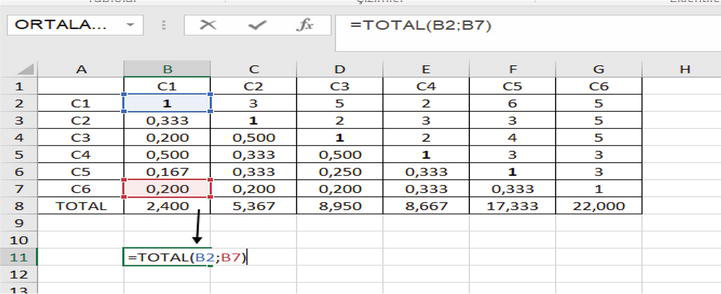
The normalization of the pairwise comparison matrix obtained in the second step was made. The following formula was used for normalization.
bij=aij∑i=1naij.E7
For the normalization process, the sum of each column is calculated. The elements of each column are obtained by dividing the column-by-column sum (Tables 5 and 6).
C1
C2
C3
C4
C5
C6
C1
1/2.40
3 / (5.37)
5/ (8.95)
2 / (8.67)
6 / (17.33)
5/ (22.00)
C2
(1/3) /(2,40)
1 / (5.37)
2 /(8.95)
3 /(8.67)
3 / (17.33)
5/ (22.00)
C3
(1/5)/ (2.40)
(1/2) / (5.37)
1 / (8.95)
2 / (8.67)
4 / (17.33)
5/ (22.00)
C4
(1/2) /(2.40)
(1/3) / (5.37)
(1/2) / (8.95)
1 / (8.67)
3 / (17.33)
3 / (22.00)
C5
(1/6) /(2.40)
(1/3) / (5.37)
(1/3) /(8.95)
(1/3) / (8.67)
1 / (17.33)
3 / (22.00)
C6
(1/5) / (2.40)
(1/5) / (5.37)
(1/3) / (8.95)
(1/3) / (8.67)
(1/3) / (17.33)
1 / (22.00)
TOTAL
2.40
5.37
8.95
(8.67) / (8.67)
17.33
22.00
Table 5.
Normalization steps.
Total value refers to the total of each column.
C1
C2
C3
C4
C5
C6
C1
0.417
0.559
0.559
0.231
0.346
0.227
C2
0.139
0.186
0.223
0.346
0.173
0.227
C3
0.083
0.093
0.112
0.231
0.231
0.227
C4
0.208
0.062
0.056
0.115
0.173
0.136
C5
0.069
0.062
0.028
0.038
0.058
0.136
C6
0.083
0.037
0.022
0.038
0.019
0.045
Table 6.
Normalization matrix.
This matrix was also the normalized matrix.
C=c11c12…c1nc21c22…c2n......cn1cn2…cnnE8
In calculating the priority vector, the arithmetic average of each row is taken. The formula is shown below (Table 7).
C1
C2
C3
C4
C5
C6
Priority vector (w)
C1
0.417
0.559
0.559
0.231
0.346
0.227
0.390
C2
0.139
0.186
0.223
0.346
0.173
0.227
0.216
C3
0.083
0.093
0.112
0.231
0.231
0.227
0.163
C4
0.208
0.062
0.056
0.115
0.173
0.136
0.125
C5
0.069
0.062
0.028
0.038
0.058
0.136
0.065
C6
0.083
0.037
0.022
0.038
0.019
0.045
0.041
Table 7.
Priority vector.
wi=∑j=1ncijnE9
The data obtained in the priority vector is also used as weights in the AHP matrix. After this stage, it is checked whether the answers are consistent.
The necessary parameters to perform the consistency tests are shown below.
Compliance Index (CI)
Random Value Index (RI)
Compliance Rate (CR)
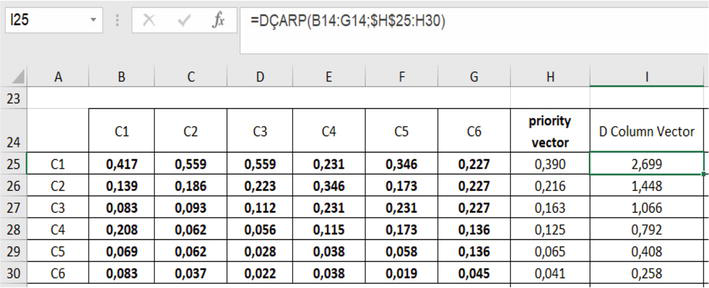
For CI we need lambda value. The lambda value is calculated according to the formula below. In other words, the lambda value is obtained by multiplying the priority vector (w) that we have obtained with the columns of the first pairwise comparison matrix. At the same time, vector D is obtained.
After obtaining the D column vector, the lambda value is obtained with the following formula. Each row of the binary comparison matrix is multiplied by the priority vector (Table 8). (= DMULT formula is used).
C1
C2
C3
C4
C5
C6
Priority vector
D columns vector
C1
0.417
0.559
0.559
0.231
0.346
0.227
0.390
2699
C2
0.139
0.186
0.223
0.346
0.173
0.227
0.216
1448
C3
0.083
0.093
0.112
0.231
0.231
0.227
0.163
1066
C4
0.208
0.062
0.056
0.115
0.173
0.136
0.125
0.792
C5
0.069
0.062
0.028
0.038
0.058
0.136
0.065
0.408
C6
0.083
0.037
0.022
0.038
0.019
0.045
0.041
0.258
Table 8.
D column vector.
In order to perform consistency tests;
Compliance Index (CI).
Random Index (RI).
Compliance Ratio (CR) values are required.
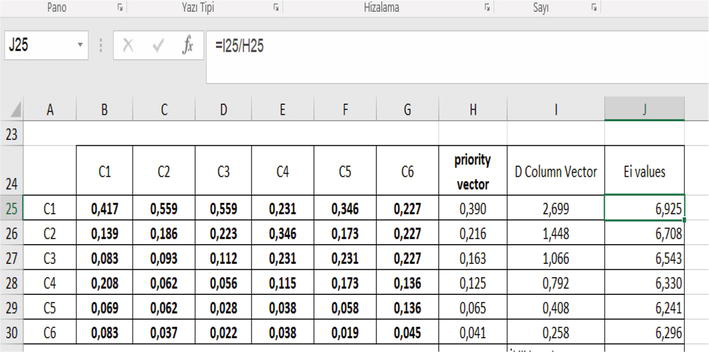
Lambda (λ) values are calculated by taking the arithmetic average of the values resulting from multiplying the comparison matrices by their weights and dividing the matrices again by their weight values. The EI value is calculated by dividing the D column vector/priority vector.
Priority vector
D columns vector
EI values
0.390
2699
6925
0.216
1448
6708
0.163
1066
6543
0.125
0.792
6330
0.065
0.408
6241
0.041
0.258
6296
Six values are averaged to calculate the lambda value (λmax).
λmax=6925+6708+6543+6330+6241+6296/6=6507E11
The lambda (λ) value is subtracted from the number of matrix dimensions and divided by one less than the number of matrix dimensions, and the consistency index is calculated. The consistency ratio is calculated by dividing the consistency index by the randomness value according to the number of matrix dimensions.
CI=λ−nn−1E12
CI=6.507–6/6–1=0.101.E13
Now, we can calculate the CR value. The required RI value is given in Table 3. Since the number of decision alternatives is six, the RI value is 1.24.
CR=CI/RIE14
CR=(0.101/1.24=0.088%E15
The result is within the compliance rate limits, below 10%, so the inconsistency is acceptable.
4.2 Identifying alternatives
All alternatives are compared for each criterion. The value of comparing alternatives with each other is 1. Experts are asked to compare the alternatives, and the final value is obtained by taking the geometric mean. After comparing all the alternatives for the criteria, the priority vectors are placed in the matrix in which the alternatives and criteria are compared. The final AHP matrix is then obtained (Table 9).
Weights
0.4199
0.1905
0.1662
0.1097
0.0716
0.0421
Alternatives
C1
C2
C3
C4
C5
C6
Nurse 1
0.352
0.327
0.402
0.469
0.613
2909
Nurse 2
0.248
0.238
0.261
0.258
0.418
3024
Nurse 3
0.159
0.172
0.181
0.284
0.323
1909
Nurse 4
0.093
0.108
0.120
0.156
0.200
0.580
Nurse 5
0.084
0.089
0.098
0.090
0.085
0.602
Nurse 6
0.064
0.066
0.049
0.046
0.041
0.261
Table 9.
Final AHP matrix.
Then, the weight values are multiplied by the value in each row. Then, the row values are summed to get the total value of the alternative. After this step, we can perform the sorting. The ranking is done in Excel with the = rank formula (Table 10).
Weights
0.4199
0.1905
0.1662
0.1097
0.0716
0.0421
Decision
Alternatives
C1
C2
C3
C4
C5
C6
Total
Rank
Nurse1
0.352
0.062
0.067
0.469
0.044
0.122
1117
1
Selected
Nurse2
0.248
0.045
0.043
0.258
0.030
0.127
0.752
2
Selected
Nurse3
0.159
0.033
0.030
0.284
0.023
0.080
0.609
3
Selected
Nurse4
0.093
0.021
0.020
0.156
0.014
0.024
0.328
4
Not Selected
Nurse5
0.084
0.017
0.016
0.090
0.006
0.025
0.239
5
Not Selected
Nurse6
0.064
0.013
0.008
0.046
0.003
0.011
0.145
6
Not Selected
Table 10.
Personnel selection and ranking.
According to the results, the first three nurses with the highest score will be accepted to the intensive care certification program.
As a result, AHP is a very simple, easy-to-use, multi-criteria decision-making method widely used in solving complex probes, and it can be easily applied in the Excel program without the need for any program.
In this study, the problem of nurse selection for an intensive care certificate program in a hospital, the criteria affecting the selection, and which of the criteria are more important in the selection of nurses were determined. According to the results of this research study, the C1 criterion is more important than the other criteria. In the final part, the top three candidates with the highest scores were accepted to the certificate program.
Personnel selection is a process that needs to be done carefully and consists of some steps. In this process, the criteria to be sought by the personnel to be selected should be determined in advance. The degree of importance of the criteria and the characteristics of the job applicants may differ from each other. In this case, multi-criteria decision-making techniques that allow those who decide on personnel selection to make an objective evaluation play an important role. AHP offers the opportunity to evaluate quantitative and qualitative criteria simultaneously. This method is a useful tool, especially when it is necessary to decide on the selection of more than one candidate. In addition to AHP, it is recommended to use other multi-criteria decision-making methods such as Promethee in personnel selection and in all processes that need to be decided (such as material procurement and purchasing).
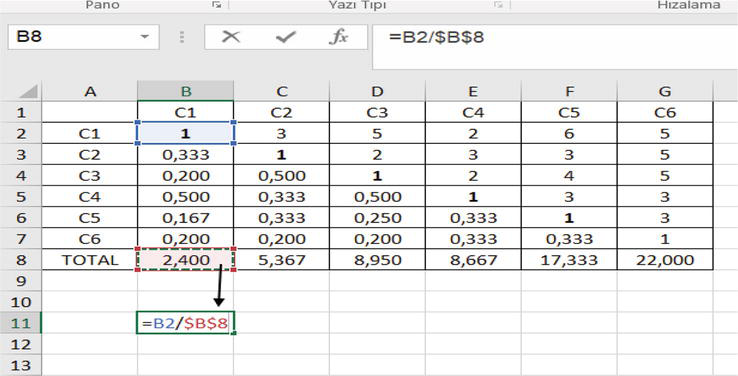
After completing the entry in Excel, the dark-marked areas are obtained by dividing the elements by 1.
Normalization process, column totals are calculated.
After calculating the column totals, each column element is divided by the corresponding column total. The F4 key is used for fixing in Excel (the $ sign that appears in the formula). With this process, the normalization process is done.
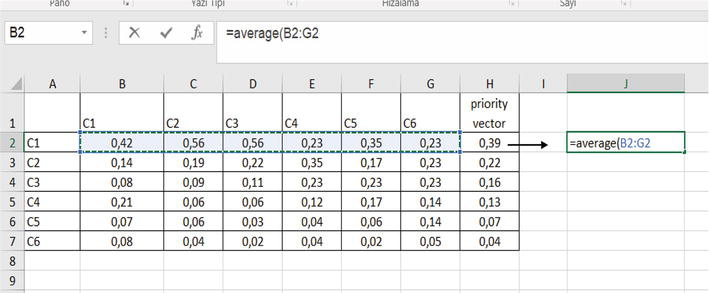
It is calculated by taking the average of the elements in the row to determine the priority vector. Priority vector values are also weight (w) values.
For the discrepancy operation, the swarm vector d and the EI values (for the lambda value) are calculated.
Each row of the binary comparison matrix is multiplied by the priority vector. (=Dmult).
1.Siekelova A, Podhorska I, Imppola JJ. Analytic hierarchy process in multiple-criteria decision-making: A model example. In: proceedings of International Conference on Entrepreneurial Competencies in aChanging World (ECCW 2020). SHS Web of Conferences 90 ECCW 2020. 2021. p. 01019. DOI: 10.1051/shsconf/20219001019
2.Feng YJ, Lu H, Bi K. An AHP/DEA method for measurement of the efficiency of R& D management activities in universities. International Transactions in Operational Research. 2004;11(2):181-191
3.Badri MA. Combining the analytic hierarchy process and goal programming for global facility location-allocation problem. International Journal of Production Economics. 1999;62(3):237-248
4.Vargas GL. An overview of the analytical hierarchy process and its applications. European Journal of Operational Research. 1990;48:2-4
5.Saaty TL. How to make decision: The Analystical hierarchy process. European Journal of Operation Research. 1990;48:9-26
7.Gul M, Guneri AF. Hospital location selection: A systematic literature review on methodologies and applications. Hindawi Mathematics Problems in Engineering. 2021;2021:6682958. DOI: 10.1155/2021/6682958
8.Lee SK, Mogi G, Shin SC, Kim JW. An AHP/DEA hybrid model for measuring the relative efficiency of energy efficiency technologies. In: IEEM 2007 2007 IEEE Int. Conf. Ind. Eng. Eng. Manag. Singapore: IEEE; 2007. pp. 55-59. DOI: 10.1109/IEEM.2007.4419150
9.An SH, Kim GH, Gwang K, K-In. A case-based reasoning cost estimating model using experience by analytic hierarchy process. Building and Environment. 2007;42:2573-2579. DOI: 10.1016/j.buildenv.2006.06.007
10.Onder G, Onder E. Multi-criteria decision making methods. In: Fatih B, editor. Yıldırım, Emrah Önder. Bursa: Dora Basım 3. Press; 2018
11.Saat M. An approach to multi-criteria decision making: Analytical hierarchy method. Journal of Gazi University Faculty of Economics and Administrative Sciences. 2000;2:149-162
12.Mu E, Pereyra-Rojas M. Practical Decision Making Using Super Decisions v3. USA: Springer; 2018
13.Whiting DR, Guariguata L, Weil C, Shaw J. IDF diabetes atlas: Global estimates of the prevalence of diabetes for 2011 and 2030. Diabetes Research and Clinical Practice. 2011;94(3):311-321. DOI: 10.1016/j.diabres.2011.10.029
14.Tsai HY, Chang CW, Lin HL. Fuzzy hierarchy sensitive with Delphi method to evaluate hospital organization performance. Expert Systems with Applications. 2010;37(8):5533-5541. DOI: 10.1016/j.eswa.2010.02.099
15.Suner A, Çelikoğlu CC, Dicle O, Sökmen S. Sequential decision tree using the analytic hierarchy process for decision support in rectal cancer. Artificial Intelligence in Medicine. 2012;56(1):59-68. DOI: 10.1016/j.artmed.2012.05.003
16.Sharma PS, Eden KB, Guise JM, Jimison HB, Dolan JG. Subjective risk vs. objective risk can lead to different post-cesarean birth decisions based on multiattribute modeling. Journal of Clinical Epidemiology. 2011;64(1):67-78. DOI: 10.1016/j.jclinepi.2010.02.011
17.Wu CL, Ke TW, Meen TH. Evaluation of intensified colorectal cancer treatment using model based on Delphi method, fuzzy logic, and analytical hierarchy process (DFAHP). Sensors and Materials. 2021;33(10):3499-3512. DOI: 10.18494/SAM.2021.3538
18.Khan AMR, Prasad PN, Rajamanoharane SW. Service quality performance measurement Management in Corporate Hospitals Using Analytical Hierarchy Process. International Journal of Manufacturing Technology and Management. 2012;26(1/2/3/4):196-212. DOI: 10.1504/IJMTM.2012.051434
19.Ozkan B, Özceylan EE, Kabak M, Dikmen AU. Evaluation of criteria and COVID-19 patients for intensive care unit admission in the era of pandemic: A multi-criteria decision making approach. Computer Methods and Programs in Biomedicine. 2021;209:106348. DOI: 10.1016/j.cmpb.2021.106348
20.Harjanto S, Setiyowati S, Vulandari RT, Surakarta SN. Application of analytic hierarchy process and weighted product methods in determining the best employees. Indonesia Journal of Applied Statistics. 2021;4(2):103-112
21.Subasi H. Comparison of TOPSIS and AHP Methods Used in Multi Criteria Decision Process and An Application [Thesis]. Istanbul: Marmara University, Institute of Social Sciences, Department of Business Administration; 2011
22.Aktaş R, Doğanay MM, Gökmen Y, Gazibey Y, Türen U. Numerical Decision Making Methods. 1st ed. İstanbul: Beta Edition; 2015
23.Timor M. Analytical Hierarchy Process. İstanbul: Türkmenevi Bookstore; 2011
24.Celikbilek Y. Multi-Criteria Decision Making Methods with Annotated and Comparative Health Sciences Applications. 1st ed. Ankara: Nobel Academic Publishing; 2018. DOI: 10.11611/JMER214
25.Omurbek A, Simsek N. Selection of online shopping site based on analytic hierarchy process and analytic network process methods. Journal of Management and economics research. 2014;22:306-327
26.Kazancoglu Y. Performing Supplier Selection and Performance Evaluation with Operations Research Techniques in the Logistics Management Process: AHP and DEA [Thesis]. İzmir: Ege University Institute of Social Sciences; 2008
27.Kargı AVS. Analytical Hierarchy Process Model in the Subcontractor Selection Decision of Managers. Bursa: Ekin Printing Home; 2015
28.Saaty TL. Deriving the AHP 1–9 Scale from First Principle. Switzerland: Berne; 2001
29.Young KD, Younos T, Dymond RL, Kibler DF, Lee DH. Application of the analytic hierarchy process for selecting and modeling Stormwater best management practices. Journal of Contemporary Water Research and Education. 2010;146(1):50-63. DOI: 10.1111/j.1936-704X.2010.00391.x
30.Dagdeviren M, Akay D, Kurt M. Analytical hierarchy process for job evaluation and application. Journal of the Faculty of Engineering and Architecture of Gazi University. 2004;19(2):131-138
31.Tas C, Bedir N, Eren T, Alagas HM, Cetin S. Policlinic evaluation with integrating AHP-TOPSIS methods: An Applicatıon in Ankara. Journal of Health Management. 2018;2(1):1-17
32.Kayhan G. Generation a Hybrid System Using Fuzzy Ahp/Fuzzy Topsis in Human Resource Performance Evaluatıon and an Applicatıon [Thesis]. Turkiye: Erciyes University, Graduate School of Natural and Applied Sciences; 2010
33.Sevinc T, Eren A. Sorting the KOSGEB support models for SMEs by multicriteria decision making methods. International Journal of Engineering Research and Development. 2019;11(1):409-425
34.Wu CR, Lin CT, Chen HC. Optimal selection of location for Taiwanese nursing home to ensure a competitive advantage by using the analytic hierarchy process. Building and Environment. ScienceDirect Elsevier. 2007;42:1431-1444. DOI: 10.1016/j.buildenv.2005.12.016
35.Paksoy S. Current Approaches to Multi-Criteria Decision Making. Adana: Karahan Bookstore; 2017
Written By
Hatice Esen
Submitted: 22 December 2022Reviewed: 26 December 2022Published: 27 February 2023
 Open access peer-reviewed chapter