Open Access is an initiative that aims to make scientific research freely available to all. To date our community has made over 100 million downloads. It’s based on principles of collaboration, unobstructed discovery, and, most importantly, scientific progression. As PhD students, we found it difficult to access the research we needed, so we decided to create a new Open Access publisher that levels the playing field for scientists across the world. How? By making research easy to access, and puts the academic needs of the researchers before the business interests of publishers.
We are a community of more than 103,000 authors and editors from 3,291 institutions spanning 160 countries, including Nobel Prize winners and some of the world’s most-cited researchers. Publishing on IntechOpen allows authors to earn citations and find new collaborators, meaning more people see your work not only from your own field of study, but from other related fields too.
To purchase hard copies of this book, please contact the representative in India:
CBS Publishers & Distributors Pvt. Ltd.
www.cbspd.com
|
customercare@cbspd.com
In general, this chapter is devoted to the optimization of reinforced concrete structures according to the criterion of minimizing their cost. All the design solutions discussed below do not contradict the established requirements of building regulations. It is shown that the current building codes and regulations do not fully disclose and quantitatively describe the reliability of the designed structures. In this chapter, an attempt was made to reveal the resources to reduce the cost of construction projects.
*Address all correspondence to: dolganov-58@mail.ru
1. Introduction
The goal of any project is to provide reliable and cost-effective functionality. Since I was asked to pay attention to the development of the design of reinforced concrete structures, this work is devoted to the analysis of the design problems of these structures.
Let us define the terms right away. So, by reliability we mean the probability of failure-free operation of building structures of buildings and structures. That is, we will give a quantitative assessment of the reliability of structures.
It is known that with insufficient reliability, there is a high risk of failure of construction projects. With excessive reliability, society incurs unreasonably high costs. That is, the issues of development and application in practice of the theory of reliability of building structures are related to socioeconomic issues.
Thus, we set ourselves the solution of the following problems.
Mathematical substantiation of the required level of reliability of building structures for structures of different levels of responsibility [1].
Justify the need to use probabilistic methods as the main ones in the design of building structures [2, 3].
Show the advantages of probabilistic calculation methods [4, 5].
The problem of assigning the optimal level of reliability has existed for a long time and, unfortunately, has not yet resolved. Design according to current building regulations (hereinafter referred to as BR for brevity) does not guarantee sufficient reliability, which is confirmed by regular construction accidents [2]. We can also state that design according to BR does not guarantee the equal reliability of sections of the same type of structures and elements. Often, calculations of reinforced concrete structures lead to both excessive and insufficient reliabilities. Existing standards regulate the reliability of building structures only to some extent. So, according to these documents, the reliability (security) of the standard resistances of materials is taken to be 0.95 (1.64σ), and the security of the design resistances approaches 0.99865 (3σ), because the standard resistances are divided into reliability factors for materials that are greater than 1.
Numerous other proposals for normalizing the failure probabilities Q(t), in our opinion, are not sufficiently substantiated. For example, in [6], it is proposed to determine the probability of going beyond the boundaries of the limiting state:
Qt=10−5ξST/L,E1
here ξS – factor of social significance (Table 1); T – regarded term of exploitation in years; L – an average amount of persons that are located inside building or nearby it for a regarded term when risk is estimated.
For buildings with a normal level of responsibility, the required reliability according to (1) will be:
1−Qt=10−5×0.5×50/50=0.999995or0.955.
Firstly, the required value of reliability, as shown by the experience of designing, surveys of buildings and structures, as well as investigations of construction accidents, is excessive, and secondly, it is practically unattainable.
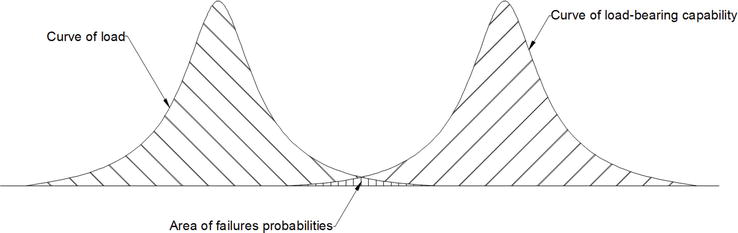
For example, let us determine the reliability for the structures of structures of a normal level of responsibility with known probabilities of the mechanical characteristics of materials and loads. To do this, we use the total probability formula (2). At the same time, we assume that the mechanical characteristics of materials and loads are independent and joint random variables, since the appearance of one random variable does not depend on the appearance of another.
PA⋅B=1−PA/+PB/−PA/PB/E2
where P(A/) and P(B/) are probabilities of opposite events A (security of the mechanical characteristics of materials) and B (security of the design load):
The expression PA/+PB/−PA/PB/ is the area of failure probabilities in Figure 1. Let us substitute the known values of the probabilities of random variables into formula (2) and determine P(A·B):
Figure 1.
For question about assignment of reliability level.
PA⋅B=1−0.05+0.05−0.05×0.05=0.9025
or 1.3σ (for the normal distribution law).
With the reliability of the resistance of materials and loads of about 3σ, we have:
PA⋅B=1−0.00135+0.00135−0.00135×0.00135=0.997
or 2.78σ (for the normal distribution law).
With the reliability of the resistance of materials and loads of about 4σ (0.999968), we have:
Thus, the actual reliability of structures for structures of reduced, normal, and increased levels of responsibility corresponds to the values of 0.90251.3σ,0.9972.8σand0.94363.8σ.
Table 2 summarizes our proposals for assigning the level of reliability of building systems of different responsibility classes.
Level of building’s responsibility
Probability of failure-free operation according to the design limit state1
High
0.9999 (4σ for the normal distribution law)
Conventional
0.9986 (3σ for the normal distribution law)
Low
0.9772 (2σ for the normal distribution law)
Table 2.
Reliability of building systems for different classes of responsibility.
When the condition is met: the design parameter must be no more than the allowable one established by the building rules.
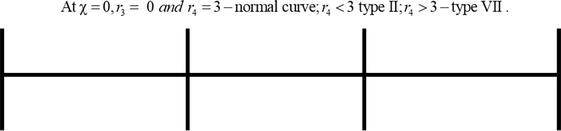
In principle, in our opinion, it would be more correct to determine any load, including snow load, using, for example, Pearson curves (Table 3, Figure 2):
χ=‐∞
χ<0
χ=0
0<χ<1
χ=1
χ>1
χ=+∞
Type III
Type I
Type II, Type VII
Type IV
Type V
Type VI
Type III
Table 3.
Pearson distribution curves.
Figure 2.
To determine the type of distribution curve.
χ=r32r4+3244r4−3r322r4−3r32−6,E4
where r3, r4 are the main statistical moments obtained by dividing the central statistical moments by the standard deviation of the statistical sample to the power of 3 and 4, respectively.
After we have determined the required level of reliability for building structures, we will evaluate their probability of failure-free operation.
Currently, a large number of methods for assessing the reliability of building structures are known.
In our opinion, the most universal is the method of statistical tests [7]. This method can be used to assess the reliability of both complex and simple building systems. Below is the algorithm for this method.
According to the accepted values of the parameters of known distributions, we assign t sets of realizations of random variables by the methods of statistical modeling: load F̃ and resistances of materials R∼. In this case, we use the Pearson distribution curves, which include, as mentioned above, the normal distribution law.
For each set of implementations, we perform calculations according to the formulas of current building rules. In this case, we determine the strength of the structural section H∼0. After t calculations, we get t values of H∼0.
We shall normalize the obtained calculation values of load-bearing capability H˜i=F˜/H˜0. Normalized values are approximated to 1. As result, the laboriousness of calculation is decreased.
We shall define density for distribution of random variables with assistance of smoothing the combination H˜ii=12…t of one of Pirson’s curves family, including also a normal curve.
We integrate the normalized curve up to the value of the given security (up to the values indicated in Table 3). We get the calculated parameter of the given security.
We assign the number of statistical tests from the condition of the minimum fluctuations of four statistical moments: 100,000.
2. Linearization method for assessing the reliability of reinforced concrete structures
This method is simpler, it assumes a formula dependence of the function of random arguments, and this dependence must be differentiable [7].
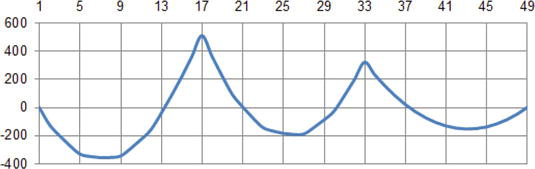
Let us evaluate the reliability of Section 17 (Figure 3) of a three-span I1=6.178mI2=I3=5.300m continuous reinforced concrete beam with a section of 300 × 600 mm constant along its length.
Figure 3.
Bending moment diagram, kN×m.
The beam is made of B40 class concrete. Beam reinforcement made of A500 class reinforcement. Tensile reinforcement resistance: Rs = 435,000 kN/m2. The modulus of elasticity of concrete in the calculations was taken taking into account its creep: 11994000 kN/m2; rebar elasticity modulus – 2Е8 kN/m2. Section number 17 (Figure 3) is reinforced from above and below symmetrically: according to 5d25. The beam is subjected to static permanent and temporary loads, as well as a movable wheel axial load of 98 kN. The diagram of the moments for the considered beam is shown in Figure 3.
Let us determine the utilization factor of the section:
φk=Mq/M0≤1E5
where Mq is the moment in the section from the design load, taken from Figure 3, Mq=510.43kN×m;M0 is the moment of internal forces, M0 is determined by (6).
M0=Rbbh02αm+RscAs/h0−a/,E6
where Rb, Rsc are respectively the resistance of concrete and compressed reinforcement Rb=22400kN/m2,Rsc=400000kN/m2;b,h0 are, respectively, the width and working height of the beam section b=0.30m,h0=0.55m;a/ – structural size – distance from the center of gravity of the compressed reinforcement to the most compressed (least stretched) edge of the beam section, a/=0.05m;As/ – cross-sectional area of compressed reinforcement, As/5∅25=0.0024544m2;αm – relative moment of internal forces, αm=x1−0.5ξ,ΓДeξ=Rsμ−Rscμ//Rb−, where ξ = (Rsμ – Rscμ/)/Rb – relative height of concrete compression zone; μ=As/bh0;μ/=As//bh0.
For the convenience of differentiation, we multiply and divide the right side of expression (6) by bh02, while assigning k02=bh02:
M0=Rb2αm+Rscμ/⋅kh×k02,E7
where kh=h0−a//h0.
The initial data for probabilistic calculations are summarized in Table 4.
Further calculations are performed according to the following algorithm.
Let us take the partial derivatives in (5) with respect to Rb, Rs, Rsc, and q, and substitute the average values of the calculated parameters into the resulting expressions. When determining q, we take into account the correlation of the moment, the structural system and the nature of the loads:
mq=qn/qc.⋅M17,E8
where qn, qc are respectively, the normative (we take the average value) and the design load; M17=Mq=510.43kN×m.
In the general case, according to formula (8), with average values of the calculated parameters, we determine the standard deviation σY, in our case, the function φk.
where rij, σxi, σxj are the correlation coefficient and standard deviations of random variables Xi, Xj; Kij is the correlation moment of random variables Xi, Xj; for independent random variables rij = 0.
For the section under consideration, we determine the coefficient k with a given probability:
kt=1−t×σY,E11
where t is taken from Table 2 depending on the responsibility of the building or structure.
In (5) we take partial derivatives with respect to Rb,Rs,Rsc and mq:
The reliability of section number 17 (Figure 3) in the considered beam is excessive. In this case, it is possible to reduce the reinforcement or increase, for example, the technological load. But here it is important to understand that the coefficient k must always be less than 1, while the building rules allow k = 1. Particularly sensitive to the randomness of the design parameters are metal structures. As shown by special calculations and the experience of investigating construction accidents, in such structures the coefficient k with a probability of 3σ (0.99865) in many cases has values less than 0.9. This fact can be explained in the following way. Reinforced concrete is a composite material. When in the section we have conditionally “bad” concrete, then the section is helped by a “good” material – reinforcement, and vice versa. The probability that there will be “bad” concrete and reinforcement in the section at the same time is much lower than if it were one material. Therefore, initially reinforced concrete structures are more reliable than, for example, metal ones.
Let us reduce the reinforcement: let us take 4d25 + 2d16, As = As/ = 0.0023656 m2 (savings in the area of reinforcement 6.9% in one section of the beam) (savings in the reinforcement area of 6.9% in one section of the beam). Then the calculated indicators change (see Table 6).
σY,kN×m
k17
tk
P(tk)
k0.95
k0,99,865
qn / qc
k02, m3
0.01509536
0.977
1.52
0.93513
0.975
0.955
0.844
0.091
Table 6.
Results of reinforcement optimization of a reinforced concrete beam.
Next, we will try to take into account the effect of static indeterminacy on the reliability of structures.
3. Structural reliability analysis of a three-span beam
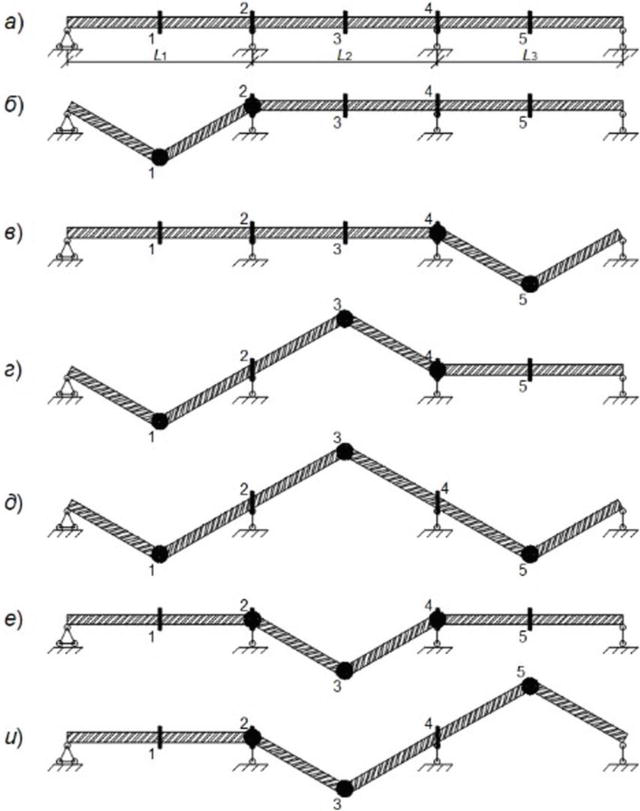
The destruction of the technical system occurs under the condition of the formation of a set of a certain number of plastic hinges, highlighted in Figure 4 shaded circles [7]. Let us compose the reliability structure of a three-span continuous beam. To do this, we determine the “weight,” “significance,” and “contribution” of the design sections in the reliability structure of the considered technical system.
Figure 4.
Schemes of destruction of a three-span continuous beam.
Let us consider all possible schemes of destruction of the beam (Figure 4). Thus, the beam will collapse according to the first scheme if plastic hinges are formed in sections 1 and 2 (Figure 4b). The beam will fail according to the second scheme if plastic hinges are formed in sections 4 and 5 (Figure 4c). And so on.
Schemes of destruction of a technical system are disjoint events. Let us pass from an arbitrary function of the algebra of logic to an orthogonal disjunctive-normal matrix form:
From (20) we determine the probability of failure or the reliability of the functioning of the kinematic mechanisms) of the considered beam. In this case, the reliability of sections 1, …, 5 (Figure 4) is assumed to be the same, indicated in Table 6, x1/=x2/=x3/=x4/=x5/=0.93513.
Then the probability of formation of a plastic hinge in the calculated section will also be the same: x1=x2=x3=x4=x5=1−0.93513=0.06487.
Substituting the known design parameters in (20) we obtain.
Rsys=1−fx1…x5=1−0.00935=0.99065or2,35σ.E21
Thus, the reliability of the considered beam is 1.55 times greater than the reliability of its design sections: 2.35σ/1.52σ=1.55.
Let us change the reliability of the sections so that the reliability of the beam as a technical system is equal to the value indicated in Table 2 (0.9986). To do this, we use special quantitative parameters that characterize the structure of the system reliability: “weight,” “significance,” and “contribution.”
The formulas for determining the indicated reliability parameters are given in their final form without conclusions.
Let us determine the “weight” of the element xi in a system consisting of n elements or the ratio of the “weight” of the Boolean difference in the argument xi to the number of all sets of the n-dimensional logical space:
gx1=GΔxiyx1…xn2n.=∑j2−rj−1+∑f2−rf−1,E22
where f=1,…,k;j=1,…,l;q=1,…,p;k+l+p=m;rf,rj,rq are the ranks of elementary conjunctions; k, l, p – is number of conjunctions containing xi/,xi and not containing the i-th argument; m is the total number of conjunctions in the original logic algebra function represented in orthogonal disjunctive-normal form; n is the number of independent variables of the original function.
The “weight” of the Boolean difference (22) characterizes the importance of the element xi for the reliability of the system. The values of the normalized or relative “weight” for each section of the considered system are given in Table 6.
The rate of change in reliability in the design sections of the technical system will be determined using the concept of “significance.” The significance of the element xi in the system yx1…xn is a partial derivative of the probability of failure-free operation of the system Rc by the probability of failure-free operation of the element Ri, i.e.,
ζxi=∂Pyx1…xn=1∂Pxi=1=∂yc∂xiE23
The criterion “significance” of the element allows you to determine the elements that provide the maximum increase in the reliability of the entire system. The significance of the design cross sections of the system under consideration is also given in Table 6.
The product of the probability of non-failure operation Ri of the element xi and its “significance” in the system yx1…xnis called the “contribution”
Bxi=Ri∂Rc∂RiE24
or “specific contribution”
bxi=Bxi/∑i=1nBxiE25
The criterion “contribution” of the element Bxi characterizes the location of the element xi in the structure of the system yx1…xn, the conditions of its operation and the connection with the probability of failure-free operation of all n elements of this system, including the i-th element. In addition, the “contribution” criterion makes it possible to rationally determine the order of restoring elements in a technical system.
The values of “specific contributions” of the calculated cross sections of the system under consideration are also given in Table 7.
Reliability parameter
Estimated cross section i
1
2
3
4
5
gi
0.375
0.375
0.250
0.375
0.375
gi/gmax
1.00
1.00
0.67
1.00
1.00
ξi
0.07145
0.07145
0.01472
0.07145
0.07145
ξi/ξmax
1.00
1.00
0.21
1.00
1.00
bi
0.238
0.238
0.049
0.238
0.238
bi/bmax
1.00
1.00
0.21
1.00
1.00
Table 7.
Analysis of the reliability structure of a continuous beam.
The introduced differential characteristics of the elements gxi,ξxi,bxi make it possible to visually see the distribution of the role of all elements on a given reliability structure in solving a specific problem.
For example, by adjusting the reliability of sections 1, 2, 4, 5 (Figure 4), we will achieve that the reliability of the system becomes 0.9986. Given the equal importance, significance and contribution of sections 1, 2, 4, 5 to the reliability structure, we will increase the reliability of these sections by 0.975. The probability of failure-free operation of Section 3 is not changed and remains the same 0.93513. Substituting the known parameters into (21), we obtain the reliability of the system equal to 0.9986.
3.1 Conclusion
The concepts of “weight,” “significance,” and “contribution” of elements to the reliability structure of a technical system, introduced into the design practice, will allow optimizing the design, linking operating costs with the costs associated with reconstruction, with overhaul of the most important elements.
Thus, the design of building systems, taking into account their reliability, can reduce the risk of construction accidents in some cases, and reduce the cost of the facility in other cases.
4. Accounting for parallel operation of reinforcement in sections of reinforced concrete structures
Below we will consider the possibility of saving reinforcement in reinforced concrete structures with a number of reinforcing bars of at least 5. The idea is simple: in building codes and rules, the resistance of reinforcement depends on the class of reinforcement and does not depend on the number of reinforcing bars in the section of the structure. At the same time, it is clear that with an increase in the number of reinforcement bars in the structure section, the probability of simultaneous failure of all bars decreases.
The resistances of materials are random variables. The design of structures is carried out according to an initially unfavorable scenario from the point of view of strength. Therefore, if we use the main provisions from probability theory and mathematical statistics in the calculation prerequisites, then the so-called effect of taking into account the parallel operation of the reinforcement in the section of the reinforced concrete structure is obtained.
The following conditions are fundamental when constructing a mathematical model for carrying out probabilistic calculations: The provision of resistances is 0.95; the calculated resistances are obtained by dividing the regulatory values by the reliability coefficient of the reinforcement. The calculated resistances obtained as a result of statistical tests are compared with the value specified in the building design standards for the considered class of reinforcement.
This chapter does not raise the issues of the required security of design resistances. Also, the problem of quantifying the reliability of structures of buildings and structures of different levels of responsibility is not considered. However, taking into account the effect of parallel operation of the valve in the design will allow for a more qualitative design of the design of a given reliability.
So, with an increase in the number of rebars, the probability of simultaneous failure of all the rebars decreases. This factor is not taken into account in the building rules. For example, for A500 reinforcement, the standard resistance is 500 MPa, and the calculated resistance is 435 MPa and does not depend on the number of rods.
At the same time, for each shipment of reinforcement, a quality certificate is attached, which indicates the melting number of reinforcing steel, the standard deviation and the average strength of the reinforcement in the batch. Therefore, for several batches, we can independently determine the inter-batching variation in the strength of reinforcement.
Let us simulate the process described above. In this case, the number of statistical tests will be set to 100,000 (with an infinite number of statistical tests, any distribution tends to normal). In the section of the structure, the reinforcement of the same diameter will be considered from one melt batch. It is clear that rebar of the same diameter can belong to different heat batches if it was rolled at different times at the same metallurgical plant or rolled at the same time, but at different metallurgical plants. Therefore, we take this decision in reserve.
With the normative design resistances of the reinforcement Rs and the known number and diameters of the reinforcement of each melting batch, we determine the conditional load-bearing capacity of the structure section NС. For a section reinforced with bars, for example, two types of diameters (k = 2), but one class of reinforcement, the value of NС will be equal to:
NС=Rs×π×n1d12+n2d22/4,E26
where n1, n2, d1 and d2 is respectively, the number and diameter of the first and second batches of melts.
With the known inter-batch variation coefficient VMP for the reinforcement of each batch-melting, we set the realizations of the reinforcement resistances, which will be the average values of R˜sm for statistical tests of the resistances of each batch-cast.
Let us carry out statistical tests for the reinforcement of each batch-cast: we will obtain the realizations R˜si.
Let us determine the conditional load-bearing capacity of the section for random realizations of reinforcement resistances.
N˜=R˜si×π×n1d12+n2d22/4E27
Let us calculate the statistical characteristics of the conditional bearing capacity of the section (average value N¯ and standard deviation σN).
Let us determine the conditional bearing capacity of the section with a security of 0.95 N˜0.95 and divide it by the known reinforcement safety factor γs. Get Ncal:
Ncal=N¯‐1.64σN/γsE28
Let us determine the coefficient of parallel operation of the steel reinforcing kps through the ratio of Ncal to NСNcaltoNСkps=Ncal/NС. The coefficient kps means a safety margin and depends on the batch and inter-batch coefficients of variation in the strength of the reinforcement, as well as on the number of reinforcing bars in the section of the reinforced concrete structure of different batches-melts.
Example. Consider reinforced concrete columns during the reconstruction of the Olympic sports complex in Moscow. According to the album 821–2.3-18-КР2, columns with a section of 500 × 500 are reinforced with 12∅25А500;800×800−16∅25А500;1000×1000−24∅25А500;1200×1200−32∅25А500.
Let us perform statistical modeling of resistances according to the algorithm of paragraphs 1–7. The results of statistical modeling calculations for the above, as well as some other columns of the sports complex “Olympic” are summarized in Table 8 and shown in Figure 5.
Reinforcement type
ks
n1
d1, mm
n2
d2, mm
V1
V2
Vmp1
Vmp2
Rsm1, MPa
Rsm2, MPa
1
2
3
4
5
6
7
8
9
10
11
12
1
1.123
12
40
0
0
0.027
0.000
0.009
0.000
573
0
2
1.117
12
32
0
0
0.018
0.000
0.015
0.000
574
0
3
1.134
12
25
0
0
0.023
0.000
0.026
0.000
593
0
4
1.148
12
20
0
0
0.020
0.000
0.015
0.000
590
0
5
1.073
12
16
0
0
0.021
0.023
0.047
0.000
582
0
6
1.153
12
12
0
0
0.018
0.023
0.015
0.000
592
0
7
1.145
18
25
16
20
0.023
0.023
0.009
0.009
580
580
8
1.145
16
25
16
20
0.023
0.023
0.009
0.009
580
580
9
1.145
16
25
16
22
0.023
0.023
0.009
0.009
580
580
10
1.145
16
25
14
22
0.023
0.023
0.009
0.009
580
580
11
1.117
5
40
0
0
0.027
0.000
0.009
0.000
573
0
12
1.114
5
32
0
0
0.018
0.000
0.015
0.000
574
0
13
1.132
5
25
0
0
0.023
0.000
0.026
0.000
593
0
14
1.146
5
20
0
0
0.020
0.000
0.015
0.000
590
0
15
1.072
5
16
0
0
0.021
0.023
0.047
0.000
582
0
16
1.150
5
12
0
0
0.018
0.023
0.015
0.000
592
0
17
1.141
5
25
5
20
0.023
0.023
0.009
0.009
580
580
18
1.143
8
25
8
20
0.023
0.023
0.009
0.009
580
580
19
1.141
5
25
5
22
0.023
0.023
0.009
0.009
580
580
20
1.143
8
25
8
22
0.023
0.023
0.009
0.009
580
580
21
1.134
12
25
0
0
0.023
0.000
0.026
0.000
593
0
22
1.135
16
25
0
0
0.023
0.000
0.026
0.000
593
0
23
1.135
24
25
0
0
0.023
0.000
0.026
0.000
593
0
24
1.135
32
25
0
0
0.023
0.000
0.026
0.000
593
0
Table 8.
Accounting for parallel operation of reinforcement in a section of a reinforced concrete structure.
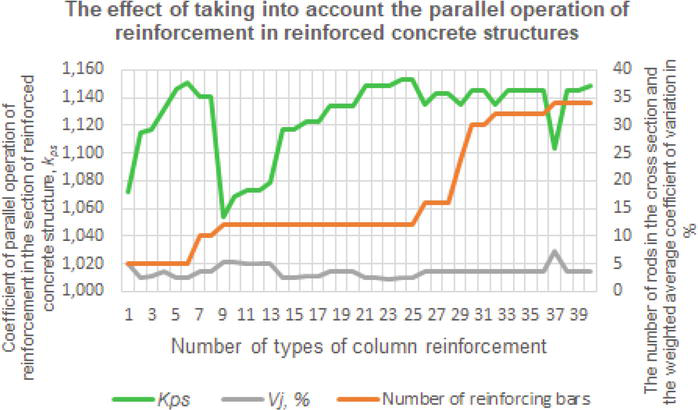
Figure 5.
The effect of the parallel operation of the armature depending on various factors.
As can be seen in Figure 5, the coefficient kps is significantly affected by the batch and inter-batch variation coefficients V1,V2,Vmp1,Vmp2, the number of reinforcing bars n1, n2, is somewhat less influenced, and the diameters of the reinforcing bars d1, d2 have no effect.
On Figure 5Vj is the geometric mean coefficient of variation:
Vi=V12+V1m2+V22+V2m21/2,E29
where V1,V2,V1m,V2m are respectively, the coefficients of variation of batches of melts 1 and 2, inter-batch coefficients of variation of batches of melts 1 and 2.
4.1 Conclusions
When taking into account the effect of parallel operation of reinforcement in the section of a reinforced concrete structure, we obtain the following advantages.
It is possible to reduce the cross-sectional area of the longitudinal reinforcement by a factor of kps. Given the known statistical parameters (mean values and standard deviations of the reinforcement strength in heat batches, which we accept from quality certificates accompanying deliveries) and the number of reinforcing bars in the section of the elements, we multiply the design resistance of the reinforcement by the kps coefficient. Further, according to Table 7, we correct the value of the reinforcement area required for strength.
The use of the kps coefficient makes it possible to obtain a more accurate assessment of the probability of failure-free operation of the structure (the value of its reliability) and the building as a whole. With excessive reliability, we save resources or increase the allowable load on the structure. In case of insufficient reliability of the structure, we can take timely measures to prevent the structure from going beyond the limits of the limit state.
Since the size of the overlap in the construction rules depends on the ratio of the calculated and actual areas of the reinforcement, we can reduce the length of the overlap by kps times. If we take into account that the reinforcement joints at the facility make up 15% of the total amount of reinforcement, then the metal savings will be 15% × 0.13 = 1.95% per one lap joint.
Thus, as shown by special calculations, within the framework of the construction of only one object, the use of probabilistic methods in the design can reduce the consumption of reinforcement by about 10%.
5. Benefits of using reinforced concrete beams in design
Consider an example. Welded beams made of C345 steel are connected to the reinforced concrete deck using stud bolts. The flooring concrete corresponds to class B30. The deck plate has a thickness of 130 mm. Profiled flooring H57–750-0.8 is used as fixed formwork.
The initial data for special calculations were also the results of surveys and tests of steel beams performed by TsNIISK them. V.A. Kucherenko, structural sections of the architectural and construction project 738.16.1-KR1.4 and 738.16.2-KR2.4. Calculations were performed for cases without and taking into account the operation of a monolithic reinforced concrete floor slab.
When taking into account the contribution of reinforced concrete flooring to the bearing capacity and rigidity of the floor, the concepts of reduced thickness and reduced modulus of elasticity (deformation) were used. Thus, the reduced thickness of the reinforced concrete slab was 10.9 cm.
The reduced modulus of elasticity of the reinforced concrete beam was determined by the formula (30):
Ered=E1J1+E2J2/J1+J2,E30
where E1 and E2, J1 and J2 there are, respectively, the moduli of elasticity of the steel beam and the floor concrete, the moments of inertia of the steel beam and the reinforced concrete floor slab.
When determining J2, the effective width of the reinforced concrete deck was taken into account in accordance with the building codes:
bf/=2×6hf/+b≤BE31
where bf/there is an estimated width of reinforced concrete flooring; hf/is the reduced thickness of the reinforced concrete flooring; b is the width of the steel beam flange; B is the step of the beams.
In the calculation model, in order to save metal, the reinforcement plates were not brought to the beam support by 10Lk, where Lk is the length of one finite element. Loads were set according to the project with the codes indicated above. The normative and design loads are respectively equal to 8.08 and 9.08 kN/m2.
Design load parameters for probabilistic calculations were determined: qm=8.08кН/м2,σq=9.08−8.08/3=0.33кН/м2,Vq=0.33/8.08=0.041. The design parameters of the mechanical characteristics of materials were determined at the coefficients of variation for steel – 0.04 and for concrete – 0.135. Average resistance of steel Rуm=345000/1−1.64×0.04=369221kN/m2. The standard deviation of steel resistance is equal, kN/m2:σs=267550×0.04=10702.
For a uniformly distributed load, the function of the section utilization factor has the form.
φk=ql2/8/Ryγcw,E32
where q is the value of linear load, kN/m; l is the design span of the beam; Ry is the resistance of steel; γc is coefficient of working conditions of the structure, γc=0.9; w is modulus of section, m3.
The standard deviation of the function φk is determined by (9). In the partial derivatives with respect to Ry and q in (9), instead of Ry and q, we substitute their average values Rym and qm. When calculating according to formulas (33)–(34), the coefficient γc is taken equal to 1; we reduce the load distributed over 1 m2 to the linear load, multiplying it by the step of the beams B.
∂φk/∂Ry=−qml2/8Rym2γcw,E33
∂φk/∂qm=l2/8Rymγcw;E34
∂φf/∂qm=5/384×l4×B/EJ;E35
∂φf/∂E=−5/384×q×l4×B/E2J.E36
For loads distributed unevenly, differentiation was carried out numerically.
To compare the test results with probabilistic calculations, four types of beams were selected: B-12, B-45, B-49 and B-61. Selected calculation results are presented in Tables 9 and 10. For normal operation of structures, it is required that, with a design live load of 2.4 kN/m2, the deflection with a probability of 0.9973 does not exceed 8 mm.
Beam brand
B, m
l, m
h, mm
b, mm
s, mm
t, mm
Jtot, m4
w, m3
kmax
qv2mm, kN/m2
qv8mm, kN/m2
f, mm
B-12
0.90
10.40
350.0
300.0
10.0
16.0
0.0003
0.0039
0.215
0.88
3.44
21.1
B-45
5.40
14.71
700.0
300.0
14.0
30.0
0.0023
0.0118
0.320
0.54
2.17
30.7
B-49
5.40
14.71
700.0
300.0
14.0
24.0
0.0020
0.0102
0.375
0.46
1.84
36.0
B-61
5.40
10.40
630.0
300.0
12.0
14.0
0.0010
0.0064
0.605
0.49
1.98
33.0
Table 9.
Geometric parameters of composite steel and reinforced concrete beams.
Beam brand
noverhang, pieces
Jtot,cb,m4
Ered,kN/m2
kmaxc
qv2mm,kN/m2
qv8mm,kN/m2
qv3σ,kN/m2
f3σ,mm
fq,mm
B-12
1
0.0014
1.4E+08
0.009
2.45
9.82
7.75
6.3
7.4
B-45
1
0.0079
1.6E+08
0.180
1.29
5.16
5.32
3.4
12.9
B-49
1
0.0069
1.1E+08
0.207
1.13
4.52
3.02
5.3
14.6
B-61
1
0.0041
1.1E+08
0.305
1.36
5.44
4.30
6.3
12.0
Table 10.
Bearing capacity and stiffness of composite steel and reinforced concrete beams.
In Table 9, kmax is the utilization factor of the steel beam section; qv2mm,qv8mm – respectively, the load at which the deflection of the beam is 2 and 8 mm; f is the deflection of the steel beam under the design load.
In Table 10, nсвес is the number of eaves included in the calculation (nсвес=1 because the reinforced concrete deck rests on the beam on one side); Jtot,cb is the moment of inertia of the reinforced concrete beam; Ered is the reduced modulus of elasticity (deformation) of the reinforced concrete beam, determined by (30); kmaxc is the utilization factor of the steel concrete beam section; f3σ – design deflection with security 3σ under live load qv3σ;fq is the deflection of the reinforced concrete beam under the total design load.
Comparison of theoretical design parameters with experimental values of composite steel and reinforced concrete beams.
In Table 11q is the test load; qс – design load; fTsNIISK – deflections recorded during the test; fSteel and fCB are design deflections of steel and reinforced concrete beams, respectively. During testing, the screed made of fine-grained concrete of class B20 with a thickness of 60 to 80 mm was not removed. In the calculations, the effect of the screed was not taken into account. This explains the somewhat overestimated calculated deflections in comparison with the experimental ones.
5.1 Conclusions
Taking into account the joint work of steel beams with reinforced concrete flooring allows to increase the bearing capacity and rigidity of structures by 1.4 and 3.3 times, respectively, while meeting the requirements for two groups of limit states with a given probability.
The use of probabilistic methods in the design of building structures, in particular, the linearization method, makes it possible to reduce their cost and shows the unequal reliability of structures designed according to current building regulations.
The proposed parameters for regulating the structure of the reliability of any technical system make it possible to design a building object, in particular, a three-span continuous beam with a given reliability. This will thus reduce the cost of the construction project.
The use of the coefficient of parallel operation of the reinforcement makes it possible to obtain a more accurate assessment of the probability of failure-free operation of the structure (the value of its reliability) and the building as a whole.
With excessive reliability, we save resources or increase the allowable load on the structure.
In case of insufficient reliability of the structure, we can take timely measures to prevent the structure from going beyond the limits of the limit state.
The joint work of steel beams with a reinforced concrete slab allows to increase the bearing capacity and rigidity of structures, which significantly reduces the cost of a construction project.
References
1.Dolganov AI, Sakharov AV. On the assignment of dependability level. Dependability, 201818(3). (in Russ.); DOI: 10.21683/1729-2646-2018-18-3-18-21
2.Dolganov AI. On the security of the ice load in the Gulf of Finland. In: Materials of the 9th International Scientific and Practical Conference / Scientific Council of the Russian Academy of Sciences, Federal Agency of Scientific Organizations, EMERCOM of Russia, Russian Foundation for Basic Research. Vol. 2. Moscow: Peoples Friendship University of Russia; 2015. pp. 100-106. (in Russ)
3.Dolganov AI, Danielov ER. Problems of optimal design of structures. Sat. reports of the III-th All-Russia. seminar: In 2 volumes. - Novosibirsk: NGASU; 2000. p. 1. (in Russ.)
4.Dolganov AI. Optimization of reinforced concrete bridge beams by the criterion of reliability. In: Problems of optimal design of structures: Sat. reports of the II All-Russian seminar: Novosibirsk: NGASU; 1998. (in Russ.)
5.Dolganov AI. Assessment of reliability of monolithic multi-storey buildings. Industrial and civil con-struction. 2010;850-51. (in Russ.). DOI: 10.33622/0869-7019; ISSN 0869-7019.
6.Probabilistic Methods in Structural Engineering (G. Augusti, A. Baratta and F. Casciati). London New York: Chapman and Hall; 1984. p. 584. ISBN 5-274-00212-9
7.Dolganov AI. Reliability of core reinforced concrete structures. Magadan: MAOBTI; 2001. p. 209. (in Russ.)
Written By
Andrey Dolganov
Submitted: 20 February 2023Reviewed: 24 February 2023Published: 26 June 2023
 Open access peer-reviewed chapter