Open Access is an initiative that aims to make scientific research freely available to all. To date our community has made over 100 million downloads. It’s based on principles of collaboration, unobstructed discovery, and, most importantly, scientific progression. As PhD students, we found it difficult to access the research we needed, so we decided to create a new Open Access publisher that levels the playing field for scientists across the world. How? By making research easy to access, and puts the academic needs of the researchers before the business interests of publishers.
We are a community of more than 103,000 authors and editors from 3,291 institutions spanning 160 countries, including Nobel Prize winners and some of the world’s most-cited researchers. Publishing on IntechOpen allows authors to earn citations and find new collaborators, meaning more people see your work not only from your own field of study, but from other related fields too.
To purchase hard copies of this book, please contact the representative in India:
CBS Publishers & Distributors Pvt. Ltd.
www.cbspd.com
|
customercare@cbspd.com
The study was carried out under the possibility of transforming conventional petrochemical processes, such as ammonia production plant, into carbon dioxide capture systems by means of replacing fossil natural gas with biogas, generated by manure during an anaerobic digestion. Three partial substitution scenarios were proposed: 30, 40 and 50% in order to analyse the behaviour of CO2 in the syngas unit process, applying an equivalent CO2 balance to evaluate if it is possible to capture this GHG within the same process, thus achieving negative emissions. The simulation of heterogeneous catalytic model of the methane reforming reactions, allowed us to assess the kinetic behaviour of all reactions involved and modify operating conditions in order to increase the production of CO2 and maintain its required flow as a secondary product, and at the same time to decrease CO2 emissions. The result shows that a 30% substitution is possible in order to achieve a −1.48e6 lb/h of equivalent CO2.
Universidad Privada del Valle, Cochabamba, Bolivia
Valeria Sandoval Cossío
Universidad Privada del Valle, Cochabamba, Bolivia
*Address all correspondence to: msilesc@univalle.edu
1. Introduction
Methane was the major component of the early atmosphere of the planet and a basic raw material for the petrochemical industry, but its global warming potential GWP is 27–30 over 100 years more than that of carbon dioxide CO2, which is why it constitutes a GHG thus contributing the greatest to global warming [1].
This chapter aims to assess the process production of syngas for an ammonia plant, with the application of a simulation model to the kinetic water steam reforming of natural gas, based on the heterogeneous catalyst of the chemical reactions involved, which are developed by [2], but also using a partial substitution of raw material studying scenarios with a mixture of biogas produced from animal manure to the process. This study could also consider CO2 capture due to the decrease of fossil feedstock and the substitution for biogas to assess CO2 eq emissions generated in the process to the atmosphere.
The operative conditions with influence on the reaction rates of the process will be adjusted to maintain the original balance of CO2 that is required by the urea plant and analyse the presence of higher concentrations of CO2 in the process (CO2 capture) and about the overall kinetics reactions.
The concepts of “carbon capture” and “global carbon capture” refer to the efficiency of conversion of a carbon source, such as a raw material, into products. For example, the amount of carbon in a wood biomass feedstock that is converted into useful products, such as alcohol [3]. For this case study, the partial substitution of fossil natural gas with biogas can convert the syngas unit process into a carbon capture process.
The application of the one-dimensional heterogeneous mathematical models developed by Sandoval [2] is the tool to study the heterogeneous catalyst behaviour within the water steam reformers (SMR) inside an ammonia plant. The calculations and analysis integrate the reaction mechanism, reaction rates, complex stoichiometry as a function of partial pressures, catalyst data, reactor geometry, packed bed reactor design equations, Ergun equation for the pressure drop, and the set of equations that integrate the energy balance [2].
The analysis should focus on the influence of increased CO2 concentration on feed streams, how reaction balances can be changed within SMR reactors, and the molar ratio of reactants and products by manipulating operating conditions and process severity. Finally, the analysis of the avoided trillions of standard cubic feet fossil methane decrease and its CO2 equivalence in emissions.
2. Characterisation of the raw material and scenarios definition for partial substitution with biogas
2.1 Natural gas
Conventional production of syngas comes from a variety of raw materials ranging from natural gas to coal. The choice for a particular raw material depends on the cost and availability of the feedstock, and on the downstream use of syngas. Syngas is generally produced by one of three processes, which are distinguished based on the feedstock used [4]:
Steam reforming of natural gas or light hydrocarbons, optionally in the presence of oxygen or carbon dioxide.
Partial oxidation of (heavy) hydrocarbons with steam and oxygen.
Partial oxidation of coal (gasification) with steam and oxygen.
For this study, we will use a Bolivian natural gas composition that is considered a dry gas due to its methane concentration being greater than 88% by weight. One of its main benefits is that it has no hydrogen sulphide (H2S) and other contaminants. Table 1 indicates the natural gas chromatography at the exit of four primary processing plants existing in Bolivia. The composition of Carrasco will be the feedstock of natural gas for the study.
Component
Rio Grande
Yapacani
Carrasco
Vuelta Grande
N2
1.85
1.7
0.33
1.79
CO2
0.94
1.87
1.94
0.06
C1
92.32
91.9
91.06
88.01
C2
4.5
2.55
6.45
9.14
C3
0.35
0.99
0.21
0.93
iC4
0
0.17
0
0.03
nC4
0.01
0.34
0
0.03
iC5
0.01
0.12
0
0.01
nC5
0.01
0.12
0
0
C6
0
0.12
0
0
C7+
0.02
0.13
0.01
0
Table 1.
Natural gas chromatography of selected plants [2].
2.2 Substitute raw material (biogas)
Technological advances and growing concern about global warming due to greenhouse gas emissions (GHG) have led to finding new raw materials that replace fossil resources to generate energy and reduce emissions in industrial processes.
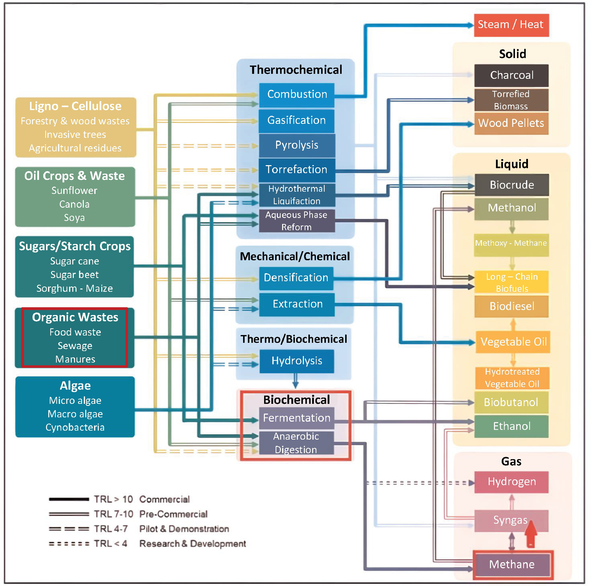
Biomass is an alternative that is taking its place in technological processes and, at the same time, to use organic waste. Figure 1 provides a detailed illustration of the many potential biomass-to-energy technologies and industrial feedstocks, which are at varying technology readiness levels (TRLs). Our route is highlighted in red [6].
Figure 1.
Biomass conversion pathways and technology readiness levels (TRLs). Adapted from [5].
Biochemical pathways take advantage of anaerobic digestion and fermentation to produce fuels, ex. biomethane [6].
Biogas or biomethane is a biofuel produced by means of (i) organism anaerobic digestion, which digests material inside a closed system or (ii) fermentation of biodegradable organic matter including manure, sewage sludge, municipal solid waste, biodegradable waste, or any other biodegradable feedstock under anaerobic conditions. The typically anaerobic process of biogas production is a multistep biological process where the originally complex and big-sized organic solid wastes are progressively transformed into simpler and smaller-sized organic compounds by different bacterial strains to have a final energetically worthwhile gaseous product and a semisolid material (digestate), rich in nutrients and thus suitable for use in farming [7].
While natural gas is classified as a fossil fuel, biomethane is defined as a non-fossil fuel [8], and it is further characterised or described as a green energy source. It is noteworthy that methane anyway, whatever the source (fossil fuel or non-fossil fuel), when released into the atmosphere, has 20 more GWP as a greenhouse gas than that of CO2. Organic matter from which biomethane is produced would release the CO2 into the atmosphere if simply left to decompose naturally, while other gases that are produced during the decomposition process, for example, nitrogen oxide(s), would make an additional contribution to the greenhouse effect [7].
Biological biomethane, as well as other biofuels, can be used to generate heat and energy or also used as raw material in petrochemical transformation processes such as the production of ammonia. We will use it as a secondary raw material (partial substitute). Biomethane is also called biogas. The data came from a production cycle by anaerobic digestion with manure of animal origin.
Intensive pig production generates considerable quantities of manure, and its final disposal represents a major environmental problem. Uncontrolled applications of pig manure over oil can cause an excess of nitrates, salts, heavy metals (copper and zinc), pathogens, xenobiotic compounds, and emissions of GHG [9].
Pigs produce 4 kg of fresh manure per day per head, so each pig can produce 0.33 m3 of useful biogas per day [9].
In this case, a composition of biogas produced from pig manure will be used. The data were acquired from the biogas experimental unit at the Universidad Privada del Valle (Bolivia). Table 2 shows the concentration measured after the contaminant’s removal process in batch production:
Batch
L-1803
Compound
Methane (CH4) %
60.66
Carbon dioxide (CO2) %
39.3
Oxygen (O2) %
0.0003
Hydrogen sulphide (H2S) ppm
0
Carbon monoxide (CO) ppm
15
Table 2.
Results of the biogas analysis, adapted from [10].
At this point, it is important to note that the contaminants of the biogas, mainly hydrogen sulphide, are fully removed after the digestion process. Therefore, the secondary feedstock that will serve as a substitute for fossil natural gas is free of this significant contaminant for the process.
2.3 Process flow analysis for the study
The natural gas is mixed with steam and enters the tubes of the radiant zone of the primary reformer (PR), where both the steam reforming reactions and the water gas shift (WGS) reactions take place [2].
The process gas enters the secondary reformer (SR), where the amount of air is not controlled in order to produce a molar ratio of 3:1 hydrogen/nitrogen. As a matter of fact, extra air is used to provide additional heat to the SR, and there is a leak of 1.75% methane on a dry basis. During secondary reforming, the oxygen produces the combustion of the partial flow of methane, and then in the catalytic zone the reforming reactions will occur without heat transfer [2].
The WGS reaction occurs for the CO to CO2 conversion. This conversion occurs in two stages: in the high-temperature converter (HTS) and the low-temperature converter (LTS). The effluent gas is directed towards the CO2 absorption unit [2].
Within the industrial process of ammonia, there are several products and services that are part of its life cycle assessment (LCA), which are both directly and indirectly connected. The complete plant can be considered as a system whose boundaries are many interrelated processes that constitute the basic components of the system or “unitary processes”.
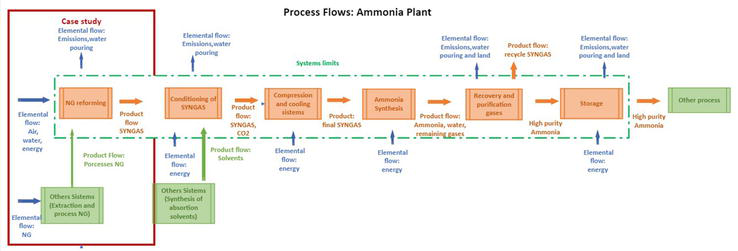
The reforming unit represents the main unitary process of the system for the study (Figure 2), from which we will calculate the input and output flows. In addition, our objective is to analyse the system as a potential CO2 capture process within the life cycle of ammonia production.
Figure 2.
Process flow inside the ammonia plant. Own elaboration.
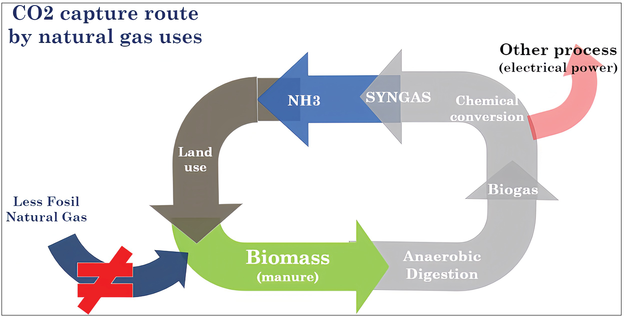
The following diagram indicates the proposed CO2 elimination route, in which we can observe that the secondary source reduces the flow of fossil natural gas feed to the process (Figure 3).
Figure 3.
Proposed CO2 removal route. Own elaboration.
2.4 Fossil natural gas substitution scenarios
To determine the scenarios of replacing natural gas with biogas, we will use set points to monitor the variation of the feed flow, the conversion and the final balance regarding the CO2 in the syngas unit.
The percentage of substituted natural gas and the global composition in the feed will be the basis for defining the scenarios in this study. By manipulating the operating conditions in the reactors without exceeding the severity of the process, we will start from the hypothesis that the kinetics of the reforming reactions can be controlled to accomplish the balance towards the formation of syngas with a 3:1 hydrogen-nitrogen ratio and to maintain the balance of CO2 used as a secondary product (urea). The avoided CO2 indicator is considered from two points of view:
The decrease of fossil natural as a raw material.
Biogas feeding from organic matter residue whose emissions would be avoided.
Table 3 shows the substitution scenarios proposed with the secondary raw material.
The study considers the substitution by biogas only for the natural gas in the proce but not the fuel for the furnace or other facilities.
A small fraction of hydrogen injection is considered due to the indeterminacies caused by its absence in the reaction rates [11].
The total mass flow of feedstock to the process remains constant.
Table 3 shows the substitution scenarios of natural gas by biogas for the study, considering three mixes in percentage: S1 (70% GN 30% BG), S2 (60% GN 40% BG) and S3 (50% GN 50% BG). We can notice that the composition of CO2 is increasing from 1.89% in the basic design to 16.13% in the S3 scenario.
3. Heterogeneous catalytic model of natural gas reforming reactions in the syngas process
Reactions 1 and 3 are the steam reforming reactions for methane and Reaction 2 is the water gas shift reaction,which takes place simultaneously. The water gas shift reaction is fast and is generally considered in equilibrium [12]
CH4+H2O↔3H2+COE1
CO+H2O↔CO2+H2E2
CH4+2H2O↔CO2+4H2E3
“Hinshelwood” mechanism for the three steam reforming reactions is:
Sc is the catalyst surface; Sa is the adsorbed catalyst.
The reaction rates, Eqs (17)–(20), are a function of the partial pressures per component and the constants of reaction rate, reaction equilibrium and adsorption per component. They cannot be used when the hydrogen concentration is null because they predict indeterminacies (Table 4) [14].
Preexponential factor: A (ki)
Activation energy and Ei (kJ/mol)
k1 _
4225e15
240.1
k2 _
1995e6
67.13
k3 _
1020e15
243.9
KCH4 bar −1
6.65e−4
−38.28
KH2O_
1.77e5
88.68
KCO bar −1_
8.23e−5
−70.65
KH2 bar−1
6.12e−9
−82.9
K1
1.19136e13
−223.02
K2
1.6e−2
36,565
K3
1.957e11
−186,464
Table 4.
Kinetic constants of steam reforming reactions, adapted from [2, 13, 14].
r1=k1PCH4PH2OPH22.5–PCOPH20.5K1DEN2E17
r2=k2PCOPH2OPH2−PCO2K2DEN2E18
r3=k3PCH4PH2O2PH23.5–PCO2PH20.5K1K2DEN2E19
DEN=1+KCH4PCH4+KH2OPH2OPH2+KH2PH2+KCOPCOE20
The study of the operation of natural gas reforming reactors with steam and air in order to model the catalytic kinetics of a one-dimensional heterogeneous reaction model (with the catalyst assuming state variables as a function of the length of the reactor as axial coordinate) integrates the following considerations:
The system operates in steady state.
Hydrocarbons higher than methane are considered inert since the reaction system inside the reforming tube is described by the three kinetic expressions of Xu and Froment.
Assumes use of fresh and activated Haldor Topsoe catalyst R67-7H.
The stoichiometry will be related to the disappearance of methane and the production of CO2.
3.1 Simultaneous kinetics reactions
In complex reactions, stoichiometry requires the variables of the consumption and production of compounds as stated by each reaction. In this case, they will be a function of the production of CO, CO2 and hydrogen with respect to Reactions 1 and 3 (represented by x and z respectively). Reaction 2 (y) is left out of the total sum of fluxes, but it is intrinsic in equilibrium:
FTFT0=1+εX+Zε=2yCH40E21
Since the three reactions are not independent, it is necessary to combine the three equations into two, one for the conversion of methane, and the other to produce CO2.
XCH4=XA=X+ZE22
XCO2=XE=Y+ZE23
The behaviour of the stoichiometry of the reactions to integrate the kinetics of the reforming reactions with steam is used as a function of the partial pressures:
PCH4=PCH401−XCH41+εXCH4PP0E24
PH2O=PCH40ΘH2O−XCH4−XCO21+εXCH4PP0E25
PCO=PCH40ΘCO+XCH4−XCO21+εXCH4PP0E26
PH2=PCH40ΘH2+3XCH4+XCO21+εXCH4PP0E27
PCO2=PCH40ΘCO2+XCO21+εXCH4PP0E28
PT=PCH40ΘT+2XCH41+εXCH4PP0E29
*Design equations are based on a packed bed reactor as a function of reactor length to evaluate CH4 and CO2 conversion.
For the reaction rates per component, the effectiveness factors are considered, which are polynomial equations as a function of the length of the reactor obtained from a series of tests and calculations considering different steam methane ratios that allow simplifying the design of the reactor.
Conversion for methane
dXA=∫0zρb∗A∗−r′AFA0dzE30
Conversion for CO2
dXE=∫0zρb∗A∗r′EFA0dzE31
Reaction rates per component
r′ACH4=−n1∗r′1−n3∗r′3E32
r′BH2O=−n1∗r′1−n2∗r′2−n3∗2∗r3E33
r′CCO=n1∗r′1−n2∗r′2E34
r′DH2=n1∗3∗r1+n2∗r′2+n3∗4∗r′3E35
r′ECO2=n2∗r′2+n3∗r′3E36
(ni) is the reaction effectiveness factor.
n1 = 0.07 n2 = 0.7 n3 = 0.06
We applied the Ergun equation for pressure drop based on the factor α, which integrates the total mass flow per area of the tube, the porosity, diameter and density of the particle, the length of the tube, the density of the catalytic bed, the viscosity of the mixture, the total sum of flows, initial pressure and temperature ratio.
dydz=−α∗ρb∗A∗1+ε∗XCH42y∗TT0E37
For the energy balance model, the equations of the heat of reaction, pressure differential, reactor area and density of the catalytic bed, as well as the total sum of flows and the sum of partial pressures per heat capacity of each component, were considered.
3.2 Secondary reformer combustion zone kinetics
The complete combustion reaction is the most representative of the model for an adiabatic reactor oriented to the production of ammonia. The reaction speed is found in the same way as a function of the partial pressures, reaction, and adsorption constants per component. The design of the reactor is a function of its length, and the total flow will be equal to the initial flow since the sum of the variables of consumption and production of compounds with respect to the reaction is zero.
CH4+2O2→CO2+2H2OE38
r4=k1∗PCH4∗PO20,51+KCH4∗PCH4+KO2∗PO20,52E39
dfCH4dz=r4rCH4E40
FT=FCH4o∗θT+0E41
Total flowFT=FTO+0then:FT=FTO.
We will consider that there is no pressure drop because the reaction is very fast. The stoichiometry is placed according to the partial pressures with (Ci = Pi/R*T); therefore, we obtain the following expressions:
PCH4RT=PCH4oRT01−x∗PP0∗T0TE42
PCH4=PCH4o1−xE43
PH2O=PCH4oθH2O+2xE44
PCO=PCOoE45
PH2=PH2oE46
PCO2=PCH4oθCO2+xE47
PO2=PCH4oθO2−2xE48
PI1=PI1oE49
PI2=PI2oE50
The energy balance equation integrates the same parameters as the SMR reforming equation. An important aspect that is considered in the combustion stage is that the reaction is carried out until the oxygen concentration is zero.
3.3 Criticality conditions in syngas process
3.3.1 Operating temperature in the reformers
The higher outlet temperature in the primary reformer implies a higher conversion of methane to syngas (Reaction 1) and therefore a higher heat flow, that is, more fuel gas and a reduction in the airflow in the furnace, if reforming is carried out in two steps.
The operating temperature of the secondary reformer depends on two factors: the amount of air entering the process and the severity of the conditions in the primary reformer. When excess air enters the secondary reformer, the complete combustion Reaction 38 generates enough energy for the SMR reactions to take place in the catalytic zone (CZ).
The highest CO2 production occurs in the primary reformer and the combustion zone (HZ) of the secondary reformer (if it is the complete combustion reaction, as in our case study). The WGS reactors are necessary to modify the balance of Reaction 2 and increase the production of CO2 and H2.
3.3.2 Adiabatic condition in the secondary reformer
Adiabatic secondary reformers help to consume the methane. When the reformer is not adiabatic, the temperature is controlled with enveloping cooling systems in order to quantify and regulate the remaining methane flow. This is the case for the basic design of the study, which will be subject to modifications to achieve the highest possible methane consumption.
3.3.3 Excess air
If excess air enters the secondary reforming process, there will be a large amount of inert nitrogen at the outlet of the syngas unit, which can be removed by cryogenic purification.
4. Effect of the increase CO2 flux in the SMR reforming reactions
The study model designed in Aspen HYSYS V.14, adapted from [2], considers the kinetic rate equations for Reactions (1–3) and (38), where the simulation of the reactors is defined from
Operating conditions and feedstock flow to the process.
Simultaneous reactions that take place in each reactor and kinetic parameters.
Catalyst properties: equivalent diameter and sphericity of the catalyst particles, catalyst density, and heat capacity of the catalyst solid.
Reactor size and design parameters: volume, length, diameter, and number of tubes.
Reactor outlet conditions.
4.1 Reaction kinetics assessment for base design and substitution scenarios
4.1.1 Primary reformer assessment
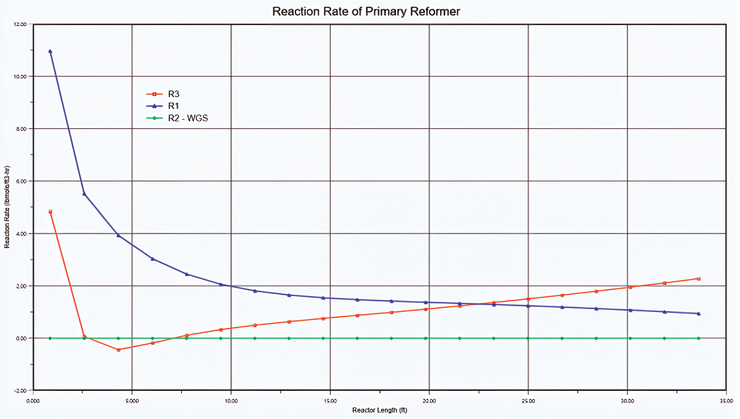
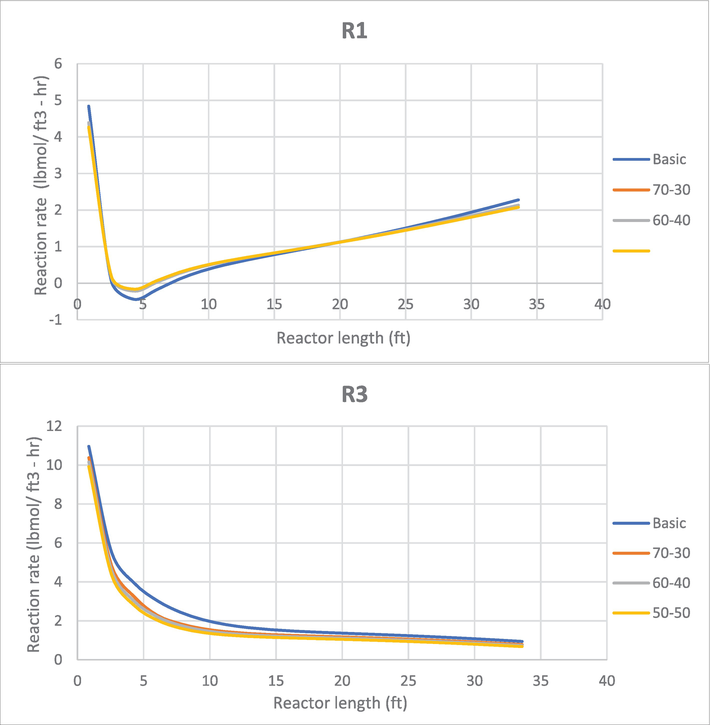
In Figure 4, we can see the reaction rate in the primary reactor for a basic design. Reaction 1 shows a decreasing trend of conversion, while Reaction 3 increases its conversion rate beginning at a 5 ft length of the reactor. We can also observe that the Reaction 2 remains constant, which means that there is no conversion in any direction of the equilibrium reaction.
Figure 4.
Reaction rate in the primary reactor on basic scenario.
The behaviour of the reaction rate in scenarios S1, S2 and S3 has the same trend as the basic design, but small increases in the conversion degree are observed in Figure 5. The global conversions of all reactors will be analysed later.
Figure 5.
Reaction rate for basic design and scenarios S1, S2 and S3. *Reaction 2 is not included in the graph because its molar equilibrium is linear, with no apparent conversion.
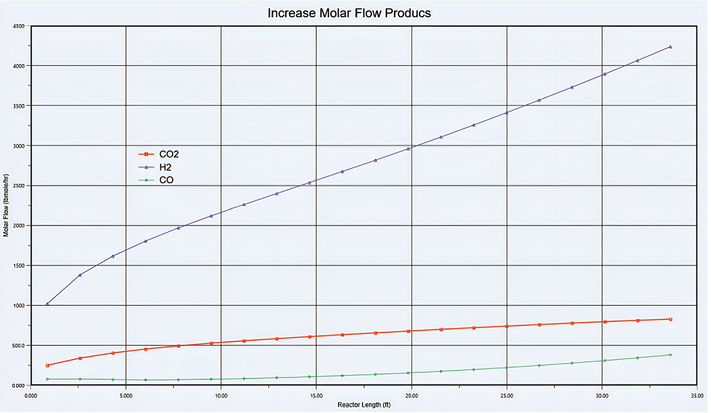
Figure 6 indicates the increased flow in the products of Reactions 1 and 3, where hydrogen has the greatest formation in quantity because it is produced in both reactions. The rising lines of hydrogen, CO, and CO2 throughout the entire reactor indicate that Reactions 1 and 3 shift their equilibrium to the right and no reversibility occurs.
Figure 6.
Products flow increased for Reactions 1 and 3.
The positive conversions of methane in primary reformer let the production of both CO and CO2 increase in the basic design and all scenarios, where CO2 has a greater flow compared to that of CO. We will see this behaviour on CO2 balance later.
4.1.2 Secondary reformer assessment
The designed model is a 2-step autothermal reformer (ATR), where the complete oxidation reaction takes place; this reaction is strongly exothermic, so it does not require external heat for the catalytic zone (CZ), where the SMR reactions occur again. The conversion begins with homogeneous reactions in a burner and is completed by heterogeneous catalysts [2].
The kinetics of the reactions in the ATR were designed in two steps: the complete combustion zone (HZ) and then the catalytic zone CZ, where the reforming reactions interact again. The combustion of natural gas is immediate and increases the reactor temperature enough to guarantee subsequent reformation in the CZ. The outlet temperature is adjusted based on a 1.72% methane remaining (dry basis) for the basic design and all scenarios.
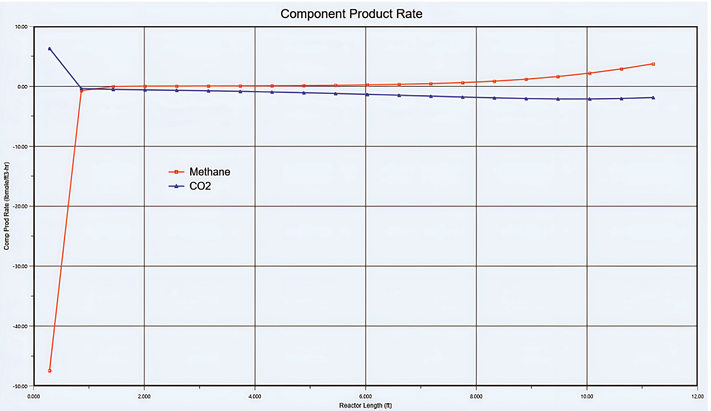
Figure 7 shows the component product rates in the CZ of the ATR reactor for the basic design of methane and CO2. It should be noted that, in the beginning, the methane is consumed almost in its entirety, but throughout the reactor, it is formed again. In a similar manner, we can observe that the CO2 production rate decreases, mainly due to the reversible behaviour of the Reaction 3, which means the reaction equilibrium shifts to the left, and CO2 is consumed, thus forming methane and steam later, we will analyse this with the reaction conversions. Therefore, if the methane generated is available, Reaction 1 exceeds its 100% conversion from the original stream.
Figure 7.
Component product rate in the CZ of the ATR reactor. Basic design to methane and carbon dioxide.
The kinetics of study scenarios S1, S2 and S3 present a similar behaviour, with the difference that the conversion decreases slightly as the CO2 flux increases at each substitution percentage.
4.1.3 HTS and LTS reactors
In HTS and LTS reactors, the water gas shift reaction (WGS) takes place [15], and it is a reversible exothermic reaction between CO and steam that produces hydrogen and CO2 (Reaction (2)).
The WGS reaction is (ΔH = −41.16 kJ/mol, gas phase) and is a typical example of an equilibrium-controlled reaction, especially at higher temperatures. The reaction proceeds with no change in the number of moles, and consequently, pressure has no significant effect on equilibrium [2, 15].
In both cases, the basic design and all the scenarios, the WGS reaction moves to the right towards CO2 and steam formation. The HTS and LTS reactors are considered the last stage to adjust the flow of CO2 produced as a secondary product for the urea plant.
4.2 Comparative analysis of the results by scenarios
4.2.1 Steam methane reformers (SMR)
In point three, we describe the behaviour of the reforming reactions in the reactors of the syngas unit, and we also observed that the scenarios have a similar behaviour regarding the increase in CO2. Table 5 shows the comparative results.
The order of the colors is decreasing, where the darker shade indicates the higher result.
The natural gas feed flow to the entire operating unit is constant, but the natural gas feed to the process decreases in proportion to the biogas substitution percentage. This is because the study considers a natural gas substitution volume only to the process; it does not consider the flows required for fuel gas from the furnace and other energy requirements in other facilities.
The primary reformer shows an increase in the conversion of Reactions 1 and 3 as the volume of substitution increases. Reaction 1 increases conversion by 17% in scenario S1 vs. the basic design and for subsequent scenarios by 7% in both cases. Reaction 3 increases 4% and 2%, respectively, in the same comparative relationship as Reaction 1. This behaviour is explained by the kinetics of methane disappearance and the amount of CO2 present, which influences the molar balance of Reaction 3, so in the case of Reaction 1, the increased conversion of the scenarios is greater because there is no original CO in the feedstock and the molar equilibrium displacement is in greater proportion to the right compared with Reaction 3.
For the secondary reformer, a similar behaviour occurs, the combustion zone presents increasing outlet temperatures ranging from 2313°F in the basic design to 2388°F in the S3 scenario. For the case study, only the total combustion of methane (Reaction 38) was considered, where the increase of conversion goes from 34.53% in the basic design to 54.5% in the S3 scenario.
For the CZ, where the reforming reactions take place again, we can see an important variation with both Reactions 1 and 3 showing decreasing conversions, but additionally, we can observe that Reaction 1 has conversions greater than 100%, from 118.3% in the basic design, down to 97.72% in scenario S3; this behaviour is due to the reversibility of Reaction 3. As we can see in Table 5, its reaction equilibrium shifts to the left, which means that the CO2 present in the mixture is consumed on average of −37% for all scenarios in conversion; therefore, additional methane is generated, and simultaneously it is also consumed by the Reaction 1 reaction, exceeding a 100% conversion; however, its output mass flow decreases as the substitution scenarios increase, which is due to (i) the increase of conversion in the PR, (ii) the reversibility of Reaction 3 in the CZ, and (iii) higher conversion of original methane and that formed in the SR. These conclusive points will be the basis for modifying the operating conditions of the process with the aim of reaching the final balance of CO2.
4.2.2 HTS and LTS reactors
The WGS (2) reaction is the only one that takes place in the HTS and LTS reactors; the equilibrium of the reaction displaces to the right, forming CO2 and steam with a high conversion percentage, for HTS 74.28% and LTS 91.6% on average for all scenarios. The conversion of Reaction 2 also increases as the percentage of replacement of natural gas by biogas grows.
The reversibility of Reaction 3 in the secondary reformer accelerates the conversion of Reaction 1, exceeding 100% due to the additional methane that is formed. This favours the formation of more CO that will enter HTS and LTS reactors and become CO2 with highly efficient conversions. Therefore, the HTS and LTS reactors are also considered as control elements to reach the final balance of CO2. Also note, that the CO flow production decreases as we raise the substitution scenarios.
4.3 Carbon dioxide CO2 balance
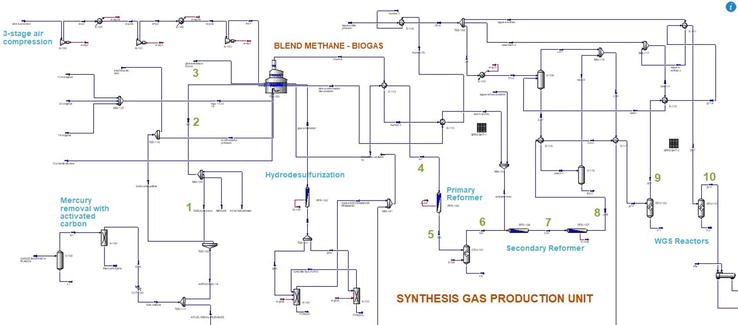
Until now, we have described the kinetics behaviour of the reforming reactions as a function of the increase in CO2 flow, due to the substitution with biogas in the feedstock, we must analyse how the total flow of this gas behaves from the feed point, its generation, up until the output of the syngas unit. Figure 8 shows the simulated flowchart in Aspen Hysys V.14 with the set points defined to perform the CO2 balance throughout the process unit.
Figure 8.
Flow diagram of the syngas unit in Aspen Hysys V14.0. Where: (1) gas to process; (2) first feed to fire heater; (3) second feed to fire heater; (4) primary reformer inlet; (5) primary reformer outlet; (6) combustion zone, heavier hydrocarbons; (7) combustion zone, second reformer outlet; (8) catalytic zone, second reformer outlet; (9) HTS outlet; (10) LTS outlet.
Point 2 shows the total feed stream to the process including the mixture of natural gas and biogas in the different substitution scenarios. Table 6 indicates the CO2 mass flows defined according to Figure 8.
Streaming yam
Basic design
S1 (70-30)
S2 (60-40)
S3 (50-50)
lb/h
lb/h
lb/h
lb/h
(1) Gas to process
2928.48
2049.93
1757.09
1464.24
(2) First feed to fire heater
2928.48
13632.97
17201.13
20769.30
(3) 2nd feed to fire heater
3222.57
13961.67
17529.83
21098.00
(4) PR inlet
3222.57
13961.67
17529.83
21097.99
(5) PR outlet
36455.92
42591.27
44686.73
46804.32
(6) HZ, heavier hydrocarbons
56978.22
56956.86
57000.11
57065.47
(7) HZSR outlet
86921.55
86904.72
86949.44
87016.30
(8) CZSR outlet
63382.74
72676.62
75258.37
77530.06
(9) HTS outlet
122942.12
115981.20
113383.82
110364.44
(10) LTS outlet
145717.52
130070.69
124677.01
119222.85
Table 6.
Carbon dioxide CO2 mass flow by scenario.
First, we will analyse the behaviour of the CO2 mass flow for the basic design and each one of the scenarios. In all cases, CO2 increases up to the outlet in LTS, just at point (8, CZSR outlet), the CO2 flow decreases because, in the catalytic zone of the secondary reformer, Reaction 3 is produced in the opposite direction, both consuming CO2 and generating more amount of methane.
Now, if we compare the mass flow of CO2 formed in the base design and the scenarios, we observe that the flow declines as the percentage substitution with biogas increases from 145717.52 lb/h in the base design to 119222.85 lb/h [10]. So, what is the reason for the decrease in CO2 in the substitution scenarios? It would be expected that by increasing the supply of biogas, the net flux of CO2 should be greater, but it is not.
The decrease in methane in the feed is due to the biogas composition, which is approximately 55% methane and 45% CO2, and substituting natural gas that is 90% pure with the biogas composition. This influences a lower flow and production of CO2 despite the fact that there is no major incidence in the conversion of the reaction as such. Later on, we will analyse the methane feed flow in the different scenarios in order to fully understand the decrease in CO2.
Finally, the produced syngas must go through a series of absorption stages to remove the greatest possible amount of CO2 that must be used as a secondary product.
Table 7 shows the missing difference of CO2 in each study scenario compared to the basic design, based on the flow required at the outlet of the absorption process, so that it can be used as a secondary product (mass flow of CO2 calculated in the basic design according to the nominal capacity of the plant); in the case of ammonia plants, CO2 is used for the production of urea. The difference in flow becomes greater than the required specification (146,557 lb/h) as the percentage substitution of the scenarios increases, with a shortage of 26757.56 lb/h for the last S3 scenario. In Section 5, the operating conditions will be adjusted to compensate for the missing CO2 flow, increasing the production of CO to use the WGS in the HTS and LTS reactors and produce a greater amount of CO2.
Stream name
Basic design
S1 (70–30)
S2 (60–40)
S3 (50–50)
lb/h
lb/h
lb/h
lb/h
SYNGAS to absorption inlet
145437.33
129750.44
124274.34
118785.25
CO2 absorption outlet
146097.71
130647.77
125154.10
119638.21
CO2 to urea plant
145252.84
129758.42
124316.75
118854.62
CO2 sub-product requirement
145252.84
Difference
0
15494.42
20936.09
26398.22
Table 7.
Flow difference at the outlet of the CO2 removal unit.
The order of the colors is decreasing, where the darker shade indicates the higher result.
4.4 Selectivity and molar equilibrium of the reforming reactions assessment
The final conversions of Reactions 1 and 3 in both reformers are mainly dependent on temperature. The growth in temperature increases the conversion in the reactors, particularly that of Reaction 1, but the molar equilibrium of the reaction interferes in the displacement from right to left, as in any equilibrium reaction. The global selectivity represents the produced amount of the desired product, in this case CO2 regarding the reacted amount of methane. Table 8 shows the CO2 selectivity in the primary reformer and the catalytic zone of the secondary reformer.
Basic
S1 (70–30)
S2 (60–40)
S3 (50–50)
PR
0.66
0.63
0.62
0.61
CZSR
0.53
0.52
0.54
0.59
Table 8.
Selectivity of CO2 with respect to methane in syngas reformers.
The global selectivity of CO2 considers that Reactions 1 and 3 occur in syngas reformers. The basic design presents a selectivity of 66% in PR and 53% in the CZSR, and the selectivity of CO2 decreases as the percentage of substitution increases, although it does not represent a significant decrease.
The molar equilibrium of the reforming reactions is observed in Table 9, this is oriented both in all scenarios and both reactors to the right, which means that the formation of CO2 is permanent in all cases, but when we analyse the conversion percentages, we note that in the CZSR, reversibility of Reaction 3 occurs, and methane is formed; additionally the molar flows on the left and right do not exhibit a very large molar difference compared to RP, therefore, we can conclude that the total conversion in the ZCSR is mainly controlled by the temperature of the reactor. Finally, we will analyse the differential flow of methane that is in the feed to the process because the composition of biogas with 61% is less than that of the content in natural gas with 91%.
Molar equilibrium of the Reactions 1 and 3 in the PR and the CZSR.
PR = primary reformer.
CZSR = catalytic zone, second reformer.
As previously described, the composition of methane in the feed to the process is 92% for natural gas and 61% for biogas. This variation affects the amount of total methane that enters the syngas reactors, which is lower as the substitution scenario increases. For the basic design, the flow of methane feed is 50114.6 lb/h, and for the study scenarios is as follows:
S1. Total methane mass flow feed: 41597.6 lb/h
S2. Total methane mass flow feed: 38758.6 lb/h
S3. Total methane mass flow feed: 35919.6 lb/h
The decrease in methane available to react in each scenario does not affect the conversion of chemical reactions, but it does have a negative effect on the CO2 balance, since the flow decreases with the increase in percentage replaced. For example, the shortage in S3 is 26757.56 lb/h. This amount of missing CO2 leads us to conclude that in S3, even modifying the operating conditions by applying severity factors, it will not be possible to reach the required flow specification as a secondary product; therefore, S3 will not be considered for the subsequent study of the modification of operational variables.
Simulations were developed with modification of variables in scenarios S1 and S2 with the objective of increasing the conversion of Reaction 1 to obtain more CO and, in consequence, greater flow of CO2 in the HTS and LTS reactors. Considering the following:
The first change of variable focused on the severity of the temperature, increasing to 1400°F, 1454°F and 1508°F, respectively, at the exit of the primary reformer and maintaining the original exit temperature of the secondary reformer.
For the second part, it was considered to simulate the adiabatic secondary reformers; therefore, the secondary reformer outlet temperature is determined by the severity of the primary reformer and the amount of air entering the process.
5.1 Scenario S1: 70-30
Table 10 shows the results obtained with the increase in temperature at the outlet of the primary reformer without exceeding the severity parameters of the equipment.
Temperature increase in the primary reformer for S1.
The order of the colors is decreasing, where the darker shade indicates the higher result.
Reaction 1 shows conversion increase with respect to the original S1. At 1400°F the conversion increase is 58.06% higher, 102.9% at 1454°F and 150.44% at 1508°F.
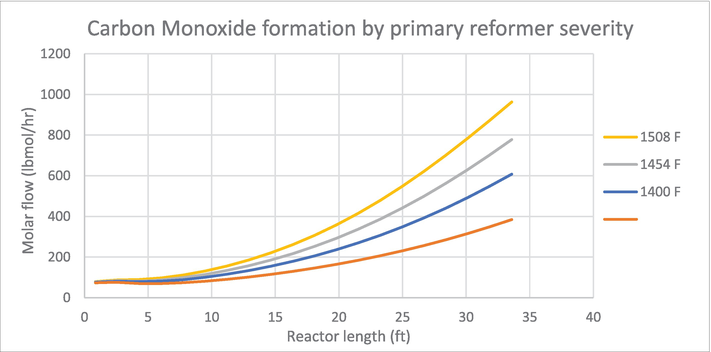
Reaction 3 also presents an increase in conversion, although the proportion is lower compared to that of Reaction 1, reaching a maximum increase of 2.33% at a temperature of 1508°F, so we can conclude that the increase in temperature in the primary reformer has a greater incidence in Reaction 1. The case study is a positive factor since we seek to increase the production of the WGS reaction in the HTS and LTS reactors. Figure 9 shows the increase in CO production with the increase in temperature compared to S1.
Figure 9.
Carbon monoxide formation by primary reformer severity.
In original S1, the produced CO flux is 10768.47 lb/h at the outlet of the primary reformer. For the temperature of 1400°F, the flow of CO increases by 6258.37 lb/h, 11,024 .34 lb/h for 1454°F and 16206.39 for 1508°F. With an increase in temperature in the primary reformer, higher conversions of Reaction 1 are reached, which significantly favours the production of CO.
If we look at the consequences of the first change on the secondary reformer, the Reaction 38 conversion increases with temperature, reaching a maximum value of 73.76% at a temperature of 1508°F, although from the CO2 production approach, high conversion is favourable, the methane remainder will have an impact on the reactions of the ZCSR, this presents the same behaviour as the original S1, but the conversions are large, considering that the remaining methane flow that enters to react is 9804.4 lb/h; clearly these results indicate that the conversion does not necessarily reflect a high production, on the contrary, the increase in temperature promotes the formation of coke.
For example, at a temperature of 1508°F, Reaction 1 reaches 158% and −164.1% in reversibility to Reaction 3 for a methane inflow of 3868.43 lb/h, considering that the remaining methane at the CZSR outlet is adjusted to 1.72%, then a representative contribution in the conversion change is not observed. Therefore, in order to consider the second modification variable (SR adiabatic condition), only the temperatures of 1400°F and 1454°F will be taken into account.
Table 11 shows the results of the modification of the two conditions: (i) increase in the severity of the primary reformer, and (ii) adiabatic secondary reformer; at the temperatures selected based on the above analysis.
The order of the colors is decreasing, where the darker shade indicates the higher result.
The conversion of Reaction 1 increases by 9.7% with respect to the result of Table 11 up to 127.7%. On the contrary, the inverse conversion of Reaction 3 decreases down to −28.58%, which means that less accumulated CO2 is consumed. One of the most important effects of the adiabatic change of the secondary reformer is the almost total consumption of methane. The mole fraction at the CZSR outlet is 0.0002 for 1400°F and 0.0001 for 1454°F, with the average outlet flow being 82.82 lb/h.
The final flow of CO obtained at 1400°F is 38911.47 lb/h, and at 1454°F 37681.56 lb/h enters the HTS reactor. With these results, the conversion of the Reaction 2 reaction remains the same, but having a greater flow of CO fed, the production of CO2 increases in 10522.05 lb/h more than the original S1, up to 140642.16 lb/h. For the temperature of 1454°F the conversions in CZSR are higher; however, the final flow of CO2 obtained at the exit of the LTS is 140742.32 lb/h, only 100 lb/h more than the result obtained at 1400°F. In conclusion, temperatures above 1400°F are not justified to achieve higher CO2 production.
5.2 Scenario S2: 60-40
We apply the same procedure used in S1, considering the modification of the variables in two steps. Table 12 shows the results of the temperature increase for S2.
Temperature increases in the primary reformer for S2.
The order of the colors is decreasing, where the darker shade indicates the higher result.
The behaviour is the same as in S1. Reaction 1 increases its conversion to a maximum of 38.79% at the temperature of 1508°F. For Reaction 3, no relevant increase in conversion is observed with increasing temperature, and the conversion reaches its equilibrium limit at 27.8%. The CO flux at the RP outlet increases by 6080.58 lb/h, 10652.33 lb/h, and 15532.84 lb/h, respectively, for each temperature, compared to the original S2.
The conversion of Reaction 38 in HZSR increases with the temperature up to a maximum of 83.95% at a temperature of 1508°F; as we know, the CZSR presents the same behaviour and the remaining methane that enters is 7698.08 lb/h for 1400°F, 4893.49 lb/h for 1454°F and 2078.18 lb/h for 1508°F; therefore, no net syngas production is observed differing significantly from the original S2. With the increase in severity, only the risk of coke production is valued without a significant benefit in the production of syngas.
To consider the second modification variable (SR adiabatic condition) in S2, only the temperature of 1400°F is considered.
The conversion of Reaction 1 increases 3% with respect to the result of Table 13, up to 116.4%. On the contrary, the inverse conversion of Reaction 3 decreases by 47.17%. The high decrease in the inverse conversion of Reaction 3 indicates that the formation of methane drops considerably in the CZSR. For the operation of Table 14 in the configuration of the adiabatic secondary reformer, it was observed that the methane consumption limit is 0.0001 in mole fraction; thus, the methane conversion reaches 99%.
Flow difference at the outlet of the CO2 removal unit with improved scenarios.
Improved scenarios represent increased severity in PR and change to an adiabatic SR.*
The order of the colors is decreasing, where the darker shade indicates the higher result.
With these results, the flow of CO formed is 32449.94 lb/h. If we compare it with the flow of CO in the original S2, the difference is 402.78 lb/h more. At the exit of LTS, carbon dioxide production is 134916.80 lb/h, that is, the production increase is 10239.77 lb/h, compared to the original S2.
From the scenarios where natural gas is replaced with biogas, we can confirm that the presence of greater amounts of CO2 in the feedstock to the processing unit directly affects the increase in the conversion of Reaction 3 in the reformers; however, by having a lower flow of methane fed, the total net produced CO2 balance decreases as the replacement percentage increases.
The formation of methane is undoubtedly a key element for the selectivity towards CO to be favoured in Reaction 1 due to the reversibility of Reaction 3 in the CZSR.
From the results obtained, we can say that the S3 scenario declined for the adjustment of operational variables because despite the increase in severity and the adiabatic SR, the production of enhanced CO would not be sufficient to reach the CO2 demand required to produce urea.
The S1 and S2 scenarios were the basis for the change of operating variables to increase the production of CO2 in the syngas unit. An increase in temperature in PR and the change to an adiabatic SR, directly promote the formation of CO (Reaction 1), therefore, increasing the production of CO2 in the HTS and LTS reactors. In Table 15, we can see how the CO2 deficit decreases, and therefore, the gap that was found in Table 14 for each substitution scenario.
CO2 equivalent balance
Scenario
IPCC 2021 (lb/h)
Total, from inlets
Total, from outlets
(13) CO2 to urea plant
CO2 eq Scope 1
Basic design
2358085.76
793208.61
145252.84
−1710129.99
S1 (70-30)
2130325.44
777626.33
129758.42
−1482457.54
S1 (70-30) T = 1400°F
2130325.44
786944.11
140254.24
−1483635.58
S1 (70-30) T = 1454°F
2130325.44
787014.45
140334.47
−1483645.46
S2 (60-40)
2054393.80
772198.81
124316.75
−1406511.74
S2 (60-40) T = 1400°F
2054393.80
781233.42
134559.33
−1407719.71
Table 15.
Balance of CO2 eq for original scenarios and with modification of variables.
So, we can see that for S2 at 1400°F, the CO2 deficit decreases by 15,705 lb/h, and although the production is positive, the missing flux is considerable; therefore, it is not considered a favourable scenario for the technical and potential economic requirements of the plant.
In the case of S1, at both temperatures, the CO2 deficit does not exceed 5000 lb/h reaching the required net balance is feasible only by slightly decreasing the flow of biogas in the feed, and since there is no significant variation between the flow of CO2 produced at 1400°F vs. 1454°F, the most recommended scenario is S1 at 1400°F. It should not be forgotten that the increase in temperature has an impact on an increase in fuel gas required for the plant.
It is important to remember that the study considers the substitution of fossil natural gas, only for the feed to the syngas process (not the natural gas required as fuel). Therefore, the CO2 equivalent balance will show that, with the adjustments made to the process, the most significant contribution to GHG emissions is due to the unit’s fuel.
The CO2 eq balance considers the input and output flows to the processing unit to calculate the net value of emissions in scope 1. Table 15 shows the balance made based on the original scenarios and the variation of the selected operating conditions. The CO2 eq balance was calculated in Aspen Hysys V.14 according to the IPCC 2021.
It is important to mention that for the balance developed, the flow of CO2 eq from the biogas (CO2 capture process) was not discounted from the feed. By considering his case in the balance, the input flows would be even lower, mainly due to fuel gas feeds to the process.
The total input flow of CO2 eq decreases as the percentage of substitution with biogas increases. This is mainly due to the decrease in the flow of fossil natural gas that, as we know, has components with a much higher GPW.
All the output flows in Scope 1 are lower than those of the original design, and we also observe that the modification of the operating variables slightly increases the output flow for each scenario. This result is to be expected due to the increase in CO2 production.
Finally, the balance of Scope 1 is negative for all cases, and this means that CO2 is captured. For example, for an ideal case (S1 at 1400°F), we have 1483635.58 lb/h of CO2 eq avoided. All the scenarios, both studied and modified, show good negative figures, but in considering a balance between the best Scope 1 achieved and the efficiency of the process itself, such as the case of S2 at 1400° F, which has a lower flow of CO2 avoided (for the decrease in fossil fuel), the CO2 deficit in the process is very high and cannot be covered. In addition to this, the required fuel and the probability of forming coke with the increase in temperature must be considered. Therefore, S1 at 1400°F is the most favourable outcome in this study.
2.Sandoval Cossio VE. Modelo de estudio del proceso cinético de reformación de gas natural a syngas basado en distintos escenarios operativos para la producción de amoniaco con tecnología Kellog Brown & Root en Bolivia. Cochabamba, 2023
3.Oficina Española de Patentes y Marcas. Patente Europea 2 547 428 [Online]. 2015. Disponible en: https://patentimages.storage.googleapis.com/2f/9b/4e/0b76cf9b88daf0/ES2547428T3.pdf
4.Moulijn JA, Van Diepen AE. Chemical Process Technology. Germany: John Wiley & Sons, Inc.; 2013
5.Stafford W, Lotter A, Brent A, von Maltitz G. Biofuels Technology. The United Nations University World Institute for Development Economics Research (UNU-WIDER); 2017
6.National Academies of Sciences, Engineering, and Medicine. Negative Emissions Technologies and Reliable Sequestration. The National Academies Press; 2019
7.Speight JG. Handbook of Petrochemical Processes. Estados Unidos: CRC Press; 2019
8.Speight J. Handbook of Industrial Hydrocarbon Processes. 2nd ed. Cambridge, MA: Gulf Professional Publishing is an imprint of Elsevier; 2020
9.Osejos Merino M, Jaramillo Véliz J, Merino M, Quimis Gómez A, Alcívar CJ. Producción de biogás con estiércol de cerdo a partir de un biodigestor en la. Dominio de las ciencias. 2018;4(1):709-733
10.Salazar Del Pozo Luis Fernando. Estudio comparativo de métodos de remoción de dióxido de carbono y sulfuro de hidrógeno en el biogas producido en la unidad experimental de producción de biogas de univalle para potenciar sus aplicaciones. Cochabamba; 2022
11.Piña. Simulación y Optimización de Reactores de Reformado de Metano con Vapor. Obtenido de Tesis Doctoral en Ingeniería Química. 2003. Available from: https://repositoriodigital.uns.edu.ar/bitstream/handle/123456789/2187/Pi%C3%B1aJuliana-Tesis.pdf?sequence=1&isAllowed=y
12.Aasberg-Petersen K, Dybkjær I, Ovesen CV, Schjødt NC, Sehested J, Thomsen SG. Natural gas to synthesis gas – Catalysts and catalytic processes. Journal of Natural Gas Science and Engineering. 2011;3(2):423-459. DOI: 10.1016/j.jngse.2011.03.004
13.Nielsen R, Christiansen L. Concepts in Syngas Manufacture. London: Imperial College Press; 2011
14.Xu J, Froment GF. Methane steam reforming, methanation and water-gas shift: I. Intrinsic kinetics. AIChE Journal. 1989;35(1):88-96. DOI: 10.1002/aic.690350109
15.Liu K, Song C, Subramani V. Hydrogen and Syngas Production and Purification Technologies. New Jersey, Hoboken: John Wiley & Sons, Inc.; 2010
Written By
Martha Siles Camacho and Valeria Sandoval Cossío
Submitted: 21 July 2023Reviewed: 23 August 2023Published: 18 December 2023
 Open access peer-reviewed chapter