 Open access peer-reviewed chapter
Abstract
While various open-source and commercial image-processing software exist, and they have high-level image-processing skills, there is no flexibility to assemble custom workflows where the experience of the evaluator can be built into the system. Therefore we have developed the Giwer (acronym for GeoImage Workflow Editing Resources, pronounce gaiver) open-source software package for handling, processing and analyzing drone images with the possibility of flexible workflow creation. Giwer has many image-processing functions that can handle traditional RGB, greyscale and hyperspectral images and apply them for their interpretation for any number of images. Giwer has further useful capabilities to organize images and their metadata (EXIF) into a database to navigate thousands of images. Users can compile their own workflows based on the available image-processing functions. Thus the created workflow involves users’ knowledge and experiences. The workflows process any number of images at once. This approach can accelerate the performance if you have a working algorithm group.
Keywords
- remote sensing
- drone image processing
- open-source
- workflow editing
- hyperspectral images
- GIS
1. Introduction
Nowadays, drone technology is already present in almost all areas of life. This is especially true for precision agriculture, environmental protection, nature conservation, the police and the military. There are world-famous programmes in this field that are capable of processing drone images. Among the commercial software, ENVI [1] and ArcGIS [2] stand out, but there are also notable products among the open-source software packages, such as SAGA [3] or QGIS [4]. Although the mentioned programmes have outstanding functions, creating your own processing procedures with them is difficult or impossible.
That is why we decided to create a programme system that supports the creation of almost any processing process from among the functions available. Ultimately, we can create arbitrary workflows [5, 6] incorporating the own knowledge and experience of the image interpretation expert into the process. Since we have complete control over the source code, any procedures can be implemented. It is the Giwer [7] system.
Furthermore, we developed to run these workflows for an arbitrary number of images, so that a procedure worked out for an area can be applied to all available images. This can significantly reduce the processing time of images of the area.
2. The Giwer system
Our objective was to develop a programme package that can process mainly drone images, but of course, it can also handle satellite images. The other goal was to serve workflow editing capabilities, where users can create their own workflows. This workflow can be applied to a single image and to any number of images. This is the project concept where you can create an image group including any number of images.
The further aim was to implement an image catalog (its name is Catalogue) where the images are stored in a database with many metadata of the images. If you have hundreds of images, it is not easy to navigate among images and find the right one if you are not able to create useful queries.
Giwer uses its own data structure to be the fastest performance. All original image formats (tif, geotif, jpg, bil, ENVI bil and cub) should be converted to Giwer format (gwr) before using the whole functionality of Giwer (Figure 1).

Figure 1.
Source data should be converted to format gwr, which is a byte array from band to band.
The heart of Giwer is a framework which organizes the different subsystems. You can run any subsystem in parallel. Let us see the subsystems.
2.1 Catalog
It organizes a large number of images into a database. The Catalog stores raw images in a database (Sqlite). Catalog reads and stores many images and image parameters from their exif data coming directly from the media of drone. Additionally, it also provides storage options in some interactive fields (Figure 2).

Figure 2.
A screenshot of the Catalog can be seen in this figure. Tabular data are in the background, and the flight trajectory is in the foreground.
Some camera, such as Micasense, produces as many image files as many bands as it has. Unfortunately, there is a little shift between the different images. It has to be corrected for the proper interpretation (Figure 3). Only after this correction should image files be converted to gwr format.
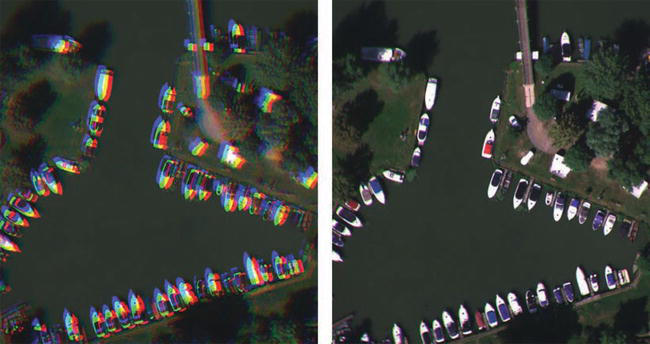
Figure 3.
An RGB image before (left side) and after (right side) alignment correction. The alignment correction is based on the affine transformation since we must eliminate shifts and rotations.
2.1.1 Experiences with MicaSense camera
Multispectral cameras with multiple lenses contain aligning mistakes in the images for the following reasons [8, 9]:
The Micasense cameras produce as many files as many bands as they have. We have installed RGB and multispectral cameras on the drone. There was no problem with RGB, but the images of the multispectral camera have some discrepancies.
Based on the construction of the multispectral camera, it has as many bands as many lenses. Thus the image files have a little shift related to each other, making the interpretation of images impossible. In addition, the individual camera positions have very little rotation, and lenses have different distortion characteristics, which also should be corrected [9, 10, 11].
Unfortunately, the built-in camera-GPSs are not accurate enough, i.e. the central image coordinates are proper for outlining the flight path but not for making mosaic from images. We attempted to resolve this problem with cross-correlation between images, but the result was not accomplished. Therefore we applied affine transformation to resolve this problem, and the result was excellent [7]. In Figure 8, we can see the original image and the result after affine transformation.
2.2 DataStock
It is an interactive image-processing system. We have implemented large number of image-processing functions that can be accessed via the menu system. Its main functions are the following

Figure 4.
Greyscale and RGB display and its histogram can be seen in this figure.
Loads images in different formats: gwr, bil, ENVI Bil, tif, geotif, jpg, cub.
Loads 8, 16, 24 and 48 bits images, from 3 banded RGB to 250 banded hyperspectral images.
Creates an RGB image from any of three tracks (Figure 4).
Histogram equalization and drawing (Figure 4).
Cross-plot drawing from any of two bands, such as red and green (Figure 5).
Handling file header (display/edit).
Apply available functions to process images.
Display 3D data with greyscale, hypsometric or user-defined lookup table (Figure 8).
Raster calculator: querying according to arbitrary, user-defined conditions, and a special graphic selection based on cross-plot technique (Figure 9).
The combination of images (add, average, exclusive, subtract, etc.) can be seen in Figure 10. Any image-processing result can be combined with other images or results if they are overlapped. Disjunct images cannot be combined.
Conversion between data formats
Filter bank (e.g. smoothing, edge detection, median filtering, etc.). Figure 11 is an illustration of edge detection
Classification (Figure 12). Many clustering methods are included in Giwer, such as K-means, K-means (Multi threaded), K-means (Manual), and Random forest.
Editing spectrum banks (Figure 13). The local and global spectrum banks support the interpretation of images, especially in agriculture [12].
Classification by spectrums

Figure 5.
A cross-plot display where the X axis is the intensity of band#1, and the Y axis is the intensity of band#2.

Figure 6.
This is the result of the NDVI calculation. On the left side, an RGB image can be seen, and on the right side, the NDVI.

Figure 7.
This is the result of the first principal component computation. You can also see the correlation matrix of images.

Figure 8.
A greyscale image (left) and a hypsometric version of it (right) can be seen here. The location is the Danube bend.

Figure 9.
Graphic selection with intensity cross-plot. If you select the pixels above the red lines, you can see them in white color on the right side.

Figure 10.
This is a composite image where the point clouds and their automatically detected boundaries were combined.

Figure 11.
A result of edge detection on a satellite image.

Figure 12.
A result of isodata clustering.

Figure 13.
An image and its spectrum in the selected point (red cross) can be seen in this figure if you select a pixel with the mouse click. The spectrum immediate quick look is also possible if you are moving the cursor on the image.
2.3 WorkflowBuilder
This is a workflow editor. From the available functions, the arbitrary workflow can be compiled, so the user can create their own processing procedure based on their individual knowledge, experience and creativity (Figure 14). Sometimes it can be useful if we combine images with Lidar data. This part of Giwer has not been completed, but it will in the future [13, 14, 15].

Figure 14.
This figure illustrates the WorkflowBuilder. On gray background, you can see a subset of the available functions (left list) and the selected functions to put them into the new workflow (right list). Further, you can see the edited workflow as a text file with function names and the required parameters (upper right part). On the lower right part of this figure, the project file can be seen, which contains the image files which are the target of the workflow.
3. Summary, future
The implementation of Giwer proved that this software package for organizing, categorizing and batch processing drone images is useful for university labs and projects for different experimental work in the field such agriculture, nature conservation and environment protection. Giwer is also a good tool to analyze images from satellites and planes.
The recent stable version of Giwer is 1.1. We continue the development focused on the hyperspectral and making mosaics. In addition, we plan to add further cameras with special preprocessing functions.
4. Other information
Giwer was written in C# at ELTE Eotvos Lorand University, Faculty of Informatics. Every subsystem, such as DataStock, Catalog, WorkflowBuilder runs alone in parallel as well without a frame programme.
Giwer is an open-source programme package with GN3 license. It can be found in GitHub, where you can download the source code (https://github.com/istvan-elek/Giwer). Executables are downloadable from http://mapw.elte.hu/giwer. A detailed user’s guide is available for help to install and use the system.
Acknowledgments
Project no. ED_18-1-2019-0030 (application-specific, highly reliable IT solutions) has been implemented with support from the National Research, Development and Innovation Fund of Hungary, financed under the Thematic Excellence Programme funding scheme.
References
- 1.
Image Analysis with ENVI. http://gmtgis.com/products/image-analysis-envi/ - 2.
ArcGIS Documentation. https://desktop.arcgis.com/en/arcmap/ - 3.
System for Automated Geoscientific Analyses. http://www.saga-gis.org/ - 4.
QGIS Documentation. https://docs.qgis.org/3.16/en/docs/ - 5.
Microsoft Dynamic Programming. https://learn.microsoft.com/en-us/dotnet/framework/reflection-and-codedom/emitting-dynamic-methods-and-assemblies - 6.
Microsoft Documentation on Reflection. https://learn.microsoft.com/en-us/dotnet/framework/reflection-and-codedom/reflection - 7.
Elek I, Cserep M. Processing drone images with the open source Giwer software package, lecture notes in networks and systems 359. In: Proceedings of the Future Technologies Conference (FTC). Vancouver; 2021. Available from: https://link.springer.com/chapter/10.1007/978-3-030-89880-9_15 - 8.
Bay H, Ess A, Tuytelaars T, Van Gool L. Speeded-up robust features (SURF). Computer Vision and Image Understanding. 2008; 110 :346-359 - 9.
Jhan J-P, Rau J-Y, Haala N. Robust and adaptive band-to-band image transform of UAS miniature multi-lens multispectral camera. ISPRS Journal of Photogrammetry and Remote Sensing. 2018; 137 :47-60 - 10.
Jhan JP, Rau JY. A normalized surf for multispectral image matching and band co-registration. In: The International Archives of the Photogrammetry, Remote Sensing and Spatial Information Sciences. Vol. XLII-2/W13. Enschede, The Netherlands: ISPRS Geospatial Week 2019; 2019 - 11.
Ye Y, Shan J. A local descriptor based registration method for multispectral remote sensing images with non-linear intensity differences. ISPRS Journal of Photogrammetry and Remote Sensing. 2014; 90 :83-95 - 12.
Alexy M, Jung A, Molnar B. Information technology drivers in smart farming management systems. In: Subhan D, Hakoomat A, Rahul D, editors. Smart Farming [Working Title]. London, United Kingdom/England: IntechOpen; 2022 - 13.
Cserep M, Lindenbergh R. Distributed processing of Dutch AHN laser altimetry changes of the built-up area. International Journal of Applied Earth Observation and Geoinformation. 2023; 116 , art. 103174:12 - 14.
Cserep M, Demjan A, Mayer F, Tabori B, Hudoba P. Effective railroad fragmentation and infrastructure recognition based on dense LIDAR point clouds. ISPRS annals of the photogrammetry. Remote Sensing and Spatial Information Sciences. 2022; 2 :103-109 - 15.
Fekete A, Cserep M. Tree segmentation and change detection of large urban areas based on airborne LiDAR. Computers & Geosciences. 2021; 156 :art. 104900