
Abstract
The chapter explores the revolutionary application of laser-induced spectroscopy in the field of gemstone analysis. It highlights the use of advanced techniques such as Raman spectroscopy, photoluminescence, and photoluminescence lifetime analysis, which have proven instrumental in identifying a variety of gemstones such as corundum, spinel, emerald, alexandrite, etc. This state-of-the-art technology stands at the forefront of differentiating natural from lab-grown materials, discerning treatment methods, and determining the origins of significant colored gemstones. This chapter provides an in-depth view of the practical implementation of emission spectroscopy in the analysis of colored gemstones, shedding light on its integral role in the rapidly evolving gemological testing systems. The goal is to furnish readers with a thorough understanding of how these advanced methods are transforming gemstone analysis, contributing significantly to the industry’s quest for enhanced precision and accuracy.
Keywords
- gemological testing
- non-distractive testing
- characterization of gemstones
- Raman spectroscopy
- photoluminescence
- PL lifetime analysis
1. Introduction
In the realm of gemological science, the quest for methodologies that are precise, non-destructive, efficient, and straightforward for the identification of gemstone materials presents a significant and ongoing challenge. This challenge is particularly pronounced in the context of the rapidly advancing technologies in gemstone synthesis and treatment. Recent decades have underscored the need for reliable identification tools within the gemstone industry. This need is primarily driven by the prevalence of melee diamonds in the jewelry market. Despite their relatively low individual value, these diamonds carry substantial implications for brand reputation, especially in cases where the presence of laboratory-grown or treated diamonds is not transparently disclosed [1, 2, 3, 4]. Additionally, the surge in popularity of colored diamonds, notably pink diamonds, which are often the product of complex multi-treatment processes, adds another layer of intricacy to the task of gemstone identification [5, 6, 7, 8, 9, 10, 11, 12].
In light of these challenges, there has been a notable acceleration in the development of advanced spectroscopic methods, such as photoluminescence [13, 14, 15, 16, 17] and photoluminescence lifetime analysis (PLLA) [18, 19, 20]. These methodologies are complemented by the advent of new, portable gemstone testing devices, including Raman spectrometers (e.g., [21, 22]) and long-wave ultraviolet (LWUV) fluorescence spectrometers (e.g., [23]), which have rapidly evolved in the realm of diamond testing. Of particular note, the applicability of these methods extends beyond diamonds and is increasingly being recognized in the broader field of colored gemstone testing.
In the controlled settings of gemstone laboratories, a suite of established gemological testing methods is employed to rigorously identify and characterize gemstones. The use of microscopy allows for the detailed examination of both internal and external features of gemstones, utilizing binocular microscopes. Refractometry, a technique that measures the refractive index of gemstones, plays a critical role in their identification. Likewise, specific gravity testing, which assesses the density of a gemstone relative to an equal volume of water, is a key determinant in identification processes. Beyond that, ultraviolet testing, examining gemstones’ responses to ultraviolet light, forms another crucial component of their identification, belonging to the classic testing methods in gemology. Additionally, spectroscopic methods, encompassing fourier-transform infrared spectroscopy (FTIR), UV-VIS, and Raman spectroscopy, probe the interaction between different types of light and the gemstones, yielding insights into their complex physical and chemical compositions, which are mainly useful for solving questions concerning the identification of varieties and for treatment examination. Furthermore, while sparingly used, destructive testing methods, such as acid testing, can be crucial in the identification of certain challenging gemstones [24]. In modern gemological laboratories, LA-ICP-MS plays a crucial role, enabling precise analysis of trace elements in gemstones. This aids in their identification and authentication. By detecting elements at very low concentrations, LA-ICP-MS assists gemologists in assessing the origins and authenticity of gemstones, thereby contributing significantly to the quality control process in the industry [25].
This chapter delves into the pivotal role of gemological laboratories in maintaining transparency within the industry, focusing on the application of spectroscopic techniques, including Raman spectroscopy, photoluminescence (PL), and photoluminescence lifetime analysis (PLLA). These advanced methods have proven highly effective in differentiating between natural and lab-grown gemstones, identifying various treatment methods, and potentially ascertaining the origins of significant colored gemstones. Furthermore, the discussion included herein aims to provide a comprehensive and detailed overview of the state-of-the-art methodologies used in gemological testing, highlighting their significance in an industry where precision, innovation, and transparency are paramount.
2. Portable Raman spectroscopy
In the field of gemology, the ability to accurately classify mineral types is the cornerstone of gemstone identification and valuation. Traditional methods of gemstone assessment, reliant on visual inspection and basic physical properties, often fall short in the face of diverse and overlapping features of minerals [26, 27, 28, 29]. Sophisticated systems, such as micro-Raman systems, offer more definitive identification but come with high costs and complexities, limiting their use to well-equipped laboratories.
Against the backdrop, portable Raman spectroscopy emerged as a game-changer in the gemstone industry. Unlike the traditional, more complex micro-Raman systems, portable Raman devices offer a balance of cost-effectiveness, ease of use, and speed, without compromising the accuracy of mineral identification [22, 30, 31, 32, 33]. These devices leverage the unique Raman scattering features of gemstones and are complemented by automatic spectral analysis algorithms, enabling rapid, accurate, and simple mineral-type classification. This advancement not only democratizes the use of advanced technology in smaller-scale gemological labs and retail settings but also enhances the ability to test a wide variety of gemstone samples quickly and efficiently in standard office conditions.
Take the portable Raman spectroscopy device described by Tsai & Xu [22] as an example, which is equipped with fiber-based 405 nm laser spectroscopy. The device’s design simplifies sample alignment, meets safety standards, and enables it to be operated effectively in routine office environments, making it an ideal tool for identifying a broad range of gemstones. The device has been proven to have a broad mineral testing capability, and it is effective in differentiating between natural and synthetic gemstones, isolating mineral subcategories, and identifying rare gemstones. In the subsequent section, a selection of case studies is presented that effectively highlight the remarkable accuracy, efficiency, and clarity of the portable 405 nm laser Raman equipment, underscoring its utility and effectiveness in routine gemological practices.
2.1 Distinguishing between gemstones and their simulants
For the gemologist, distinguishing gemstones from their imitations is a crucial task. Common imitations of diamonds in the gem market include colorless corundum, topaz, cubic zirconia (CZ), gadolinium gallium garnet (GGG), and yttrium aluminum garnet (YAG). Each of these materials has characteristic Raman scattering spectra, which are key to their identification. Diamonds are identified by a single peak at 1337.5 cm−1, indicative of the sp3 diamond lattice [34]. Corundum displays intense peaks at 424 and 758 cm−1, and topaz is characterized by a distinct peak at 937 cm−1, primarily due to Si∙O vibration [35]. Cubic zirconia shows a strong, broad band at 622 cm−1. GGG and YAG, both synthetic materials with high refractive indices and that are used as diamond simulants, have distinct peaks at 746, 598, and 361 cm−1 (for GGG) and 787, 727, and 269 cm−1 (for YAG), enabling their differentiation from diamonds. These Raman spectral features are essential for accurately separating these gemstones from their imitations.
However, both diamonds and their simulants typically exhibit a high refractive index, often surpassing the upper limit of traditional refractometers. Consequently, differentiating between them necessitates the use of multiple gemological testing techniques, including specific gravity testing and the use of handheld spectroscopes, among others. In this context, Raman spectroscopy stands out for its remarkable efficiency, offering a clear advantage in rapidly and accurately distinguishing between diamonds and their various imitations (Figure 1).
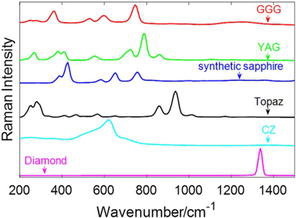
Figure 1.
Typical Raman scattering spectra for diamond and commonly encountered diamond simulants, including GGG, YAG, colorless sapphire, topaz, CZ, and diamond; source [
2.2 Distinguishing between varieties in the same mineral group
Mineral groups such as garnet, tourmaline, and feldspars have distinct varieties impacting gemstone quality, identifiable by their Raman spectra when using a 405 nm laser based on chemical composition. For instance, the 405 nm Raman spectra of various garnet species (pyrope-almandine-spessartine, grossularite, hessonite, tsavorite, and andradite) show unique patterns. The pyrope-almandine-spessartine series displays similar spectra with intense Si∙O vibrations, while the grossularite group and andradite garnet each have distinct spectral characteristics. This allows for differentiation between key garnet varieties without needing further chemical analysis (Figure 2).
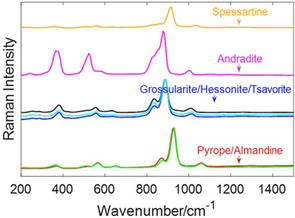
Figure 2.
Raman scattering spectra for garnet varieties, source [
2.3 Distinguishing between natural and lab-grown gemstones
When it comes to distinguishing between natural and lab-grown gemstones, the portable Raman spectroscope distinctly identifies variations in the Raman spectra of synthetic spinel compared to natural spinel. Natural and flux spinels exhibit characteristic peaks at 322, 412, 671, and 772 cm−1. However, flux spinels show broader peaks, signaling their disordered structure owing to higher manufacturing temperatures (900–1200°C) than the temperatures that produce spinel in nature [36]. In contrast, Verneuil synthetic spinels, which are formed at higher temperatures (2150–2250°C), present a unique spectrum with significantly broader peaks at 343, 426, 527, 697, 792, and 872 cm−1, indicative of an even more disordered structure (Figure 3).
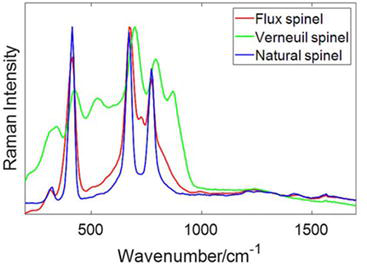
Figure 3.
Raman scattering spectra for natural spinel, source [
These distinctions are consistently observed in over 80 Gemological Institute of America (GIA)’s collections. Verneuil spinel features a higher refractive index (RI) of 1.728 compared to the natural spinel’s RI of 1.718. Meanwhile, flux spinels have the same RI as natural spinels, meaning additional tests such as photoluminescence and LA-ICPMS are commonly needed for differentiation. Raman spectroscopy simplifies the process by providing a clear and singular method for distinguishing these variants, thus significantly enhancing efficiency in gemological testing.
The 405 nm laser Raman spectroscopy setup, covering a range of 150–4500 cm−1, also effectively characterizes natural and synthetic emeralds, differentiating them based on the presence of hydroxyl vibrations at around 3500 cm−1. Furthermore, flux synthetic emeralds lack the water-related peaks present in natural and hydrothermal synthetic emeralds, while Biron hydrothermal synthetics are uniquely identifiable by a peak at 2822 cm−1 [22]. These factors are relevant when it comes to differentiating between low-iron emeralds, such as those from Colombia, and high-iron emeralds from Russia and Zambia, which 405 nm Raman spectroscopy can facilitate. Colombian emeralds show only type 1 water peaks at 3615 cm−1, whereas Russian and Zambian emeralds exhibit both type 1 and type 2 water-related peaks at 3605 and 3666 cm−1 [37]. Thus, the 405 nm Raman spectroscope can effectively identify various types of synthetic and natural emeralds, including high-iron natural emeralds and different hydrothermal synthetics (Figure 4).
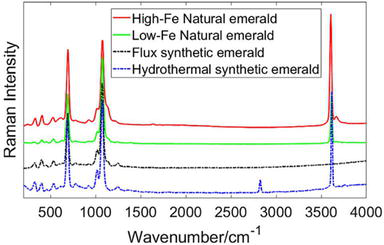
Figure 4.
Raman scattering spectra for high-Fe natural, low-Fe natural, flux synthetic, and hydrothermal synthetic emerald; source [
2.4 Discussion
The common laser wavelengths used in portable Raman systems are 405, 532, 785, and 1064 nm [22, 38, 39, 40]. While a confocal Raman system, for example, Renishaw products such as the inVia Reflex and Virsa Raman analyzer, commonly uses a 532 nm and also includes 660 and 786 nm lasers for excitation [41, 42]. These wavelengths are widely utilized for their efficiency in Raman spectroscopy applications. The 405 and 532 nm laser are known for its high Raman signal efficiency, ideal for inorganic materials and mostly used in gemstone analysis; the 785 nm laser is popular due to its effectiveness for over 90% of Raman active materials with limited interference from fluorescence; and the 1064 nm laser is better suited to colored and darker materials such as natural products, dyes, oils, and colored polymers [39].
The use of a 405 nm laser, for example, as the excitation source in portable Raman spectroscopy, offers several distinct advantages over other excitation light sources in Raman analysis. Firstly, it provides a flat background baseline from wavenumbers 100 to 4000 cm−1, minimizing the need for background correction. This feature simplifies the analysis process significantly. Secondly, it delivers a strong and clear signal at around 3500 cm−1 area, making it highly effective for studying crystal water in gemstones. The presence of hydroxyl groups in crystal water, commonly found in gemstones such as the beryl group, tourmaline, and topaz, provides valuable information for their identification. Traditionally, hydroxyl groups are analyzed using FTIR in gemological labs, particularly for emeralds, where FTIR testing is essential to distinguish natural from flux synthetic and Biron hydrothermal synthetic varieties [43, 44, 45]. However, with the pronounced hydroxyl signal offered by the 405 nm portable Raman system, the FTIR test may be reduced, thereby streamlining the identification process in gemological practices. In contrast, the Raman spectrum collected using a 532 nm laser as the excitation source has its hydroxyl signal obscured by the photoluminescence spectrum between 600 and 800 nm, leading to a loss of completeness in the information.
The effectiveness of the 405 nm laser in Raman spectroscopy largely stems from its optimal choice of excitation wavelength, which significantly influences the interplay between Raman and photoluminescence spectra. Raman spectroscopy, which measures changes in energy due to light interacting with molecular vibrations, reports values relative to the excitation source as a Raman shift in cm−1 [46]. In contrast, photoluminescence sheds light on the composition and structure of materials, with a spectral range extending from 400 to 1000 nm when using a Raman spectrometer with a charge coupled device (CCD) detector [47]. Selecting an excitation wavelength that minimizes photoluminescence is key to reducing noise and enhancing the signal-to-noise ratio in Raman spectra [48]. Furthermore, this careful selection helps avoid overwhelming fluorescence backgrounds, which can hinder accurate Raman measurements. Therefore, the relationship between Raman spectroscopy and photoluminescence underscores the critical role of excitation wavelength choice in achieving precise and reliable results in both techniques [46].
Nonetheless, the Raman spectroscopy probe system, while effective in many scenarios, does have certain limitations in its sensing capabilities. For instance, its spectral resolution restricts its ability to differentiate fine variations in the Raman spectra of certain subcategories. Additionally, samples with strong blue background fluorescence, such as some natural diamonds, and translucent minerals, such as turquoise and lapis lazuli, may encounter interference from background fluorescence. Moreover, in the case of rubies with high chromium content, the Raman scattering can be absorbed by the chromium, leading to a reduction in signal strength. Additionally, Raman spectroscopy is not always sufficient for distinguishing between gemstones of the same mineral type that differ in trace element concentrations, as seen in ruby and sapphire, both corundum varieties or in emerald and alexandrite, where chromatic element impurities influence their color. These subtle variations typically do not result in notable changes in the Raman spectra captured by this device [22].
3. Innovative photoluminescence analysis
Photoluminescence analysis is a non-destructive analytical technique used in gemology to identify treated and synthetic gemstones. It involves illuminating a material, often with a laser, and recording the resulting luminescence as a plot of emitted light intensity versus wavelength. This technique is essential for identifying optically active defects in diamonds, which can indicate treatments or synthetic origins. It is particularly important for type II diamonds (both colorless and fancy-color) and colorless type IaB diamonds [15]. The technique is also used to study the spatial distributions of luminescent properties in gem materials, providing valuable insights for gemologists and scientists. Photoluminescence spectroscopy is, therefore, a vital tool for major gemological laboratories in differentiating between natural and treated gemstones [16] and various mineral materials [49].
3.1 Identification of varieties
In the world of color gemstones, especially among the top five gemstones, namely ruby, sapphire, emerald, spinel, and alexandrite, chromium plays a pivotal role in the coloration of various gemstones, imparting distinctive and vibrant hues. In emeralds, chromium is the key element responsible for their rich green color, creating an intense and vivid hue that is characteristic of this gemstone. Similarly, in rubies, chromium acts as the chromophore, and its incorporation into the aluminum oxide crystal structure produces the gem deep red color. Furthermore, in the realm of sapphires, particularly pink and red varieties, chromium is the color-influencing factor. Likewise, alexandrite, a unique color-changing variety of chrysoberyl, is also colored by chromium. This element is critical for the remarkable phenomenon where alexandrite displays different colors under different lighting conditions—green in daylight and red under incandescent light [27, 50, 51]. Additionally, chromium is responsible for the coloration of certain semi-gemstones, such as the vivid green tsavorite garnet or chromium-colored green tourmaline, which derives its striking color from chromium and is sought after in the gemstone market. This illustrates the significant role played by chromium in defining various gemstone varieties.
Figure 5 presents a comprehensive view of the typical chromium photoluminescence (PL) spectra observed in several significant colored gemstones. These include corundum, spinel, emerald, alexandrite, and zoisite, each demonstrating a distinct chromium PL spectrum signature. Furthermore, gemstones such as corundum, spinel, and chrysoberyl often incorporate chromium into their solid solution matrix [43], generally resulting in a distinct chromium luminescence spectrum. Additionally, red beryl is highlighted, showcasing its characteristic manganese (Mn) PL spectrum, unique to its crystal structure. The comparison between the emerald and red beryl is particularly noteworthy, as they exhibit markedly different PL spectra. This contrast exemplifies how PL spectroscopy can be utilized to differentiate between various varieties within the same species.
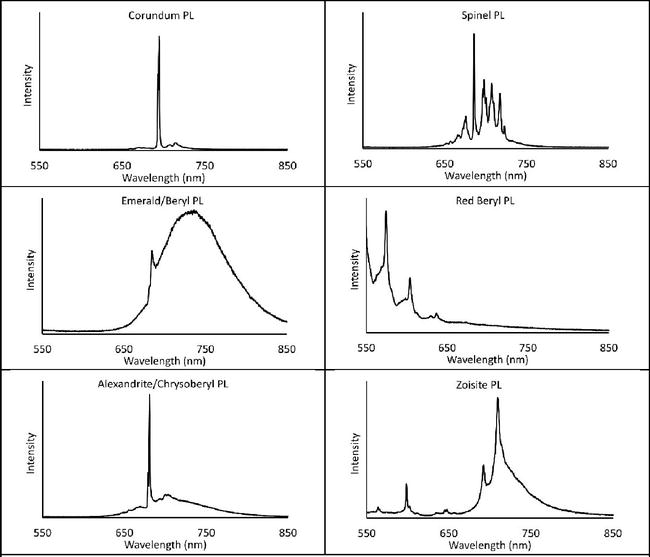
Figure 5.
Typical photoluminescence (PL) spectra of corundum, spinel, emerald, red beryl, alexandrite, and zoisite.
To further delve into photoluminescence analysis, we explore its critical role in identifying the presence of chromium in gemstones, thereby aiding in the classification of their varieties. When applied to green beryl minerals, Raman spectroscopy can detect chromium in the fluorescence spectrum, categorizing the mineral as an emerald. Conversely, the absence of chromium-induced fluorescence in beryl indicates that it is not an emerald but rather green beryl or aquamarine, with its coloration attributed to iron impurities. The same principle applies to green tourmaline; the presence of chromium in its fluorescence spectrum identifies it as chromium-tourmaline, whereas the absence of chromium suggests it is an iron-colored tourmaline. This approach underscores the significance of PL spectroscopy in the precise identification and categorization of gemstones based on their compositional and structural characteristics.
In summary, photoluminescence analysis serves as a complementary spectroscopic method to Raman spectroscopy, offering additional insights crucial for gemstone identification. While Raman spectroscopy excels in determining the mineral species, photoluminescence analysis goes a step further. It not only characterizes the mineral based on, for example, chromium luminescence spectra but also sheds light on other chromophoric elements and emission-capable trace elements within the gemstones [49]. This dual capability is invaluable for accurately identifying gemstone varieties and effectively compensates for any limitations in Raman spectroscopy.
Additionally, in professional gemological laboratories, the use of UV-visible spectroscopy (UV-VIS) is a standard practice in the study of the coloration origin. The integration of photoluminescence analysis into this process introduces an additional, robust technique. This advancement in gemological tools enhances the precision and depth of analysis, allowing for a more comprehensive understanding of a gemstone’s composition and characteristics.
3.2 Identification of treatment
3.2.1 Heat treatment
Photoluminescence (PL) analysis has been instrumental in studying the heat treatment of natural spinel. The results of photoluminescence spectroscopy have shown that heat-treated spinel exhibits distinct changes in its luminescent properties, which can be used to differentiate heated from unheated spinel. Additionally, PL spectroscopy has been used to analyze the effects of low-temperature heat treatment on blue to violet spinel, revealing broader absorption bands and changes in chromium emission peaks. These findings demonstrate the utility of photoluminescence analysis in identifying heat-treated spinel and understanding the impact of heat treatment on its optical properties [36, 52].
To investigate the effects of heat treatment on natural spinel, a series of controlled thermal experiments were conducted, primarily within the lower temperature range of 600 to 800°C. The objective was to meticulously observe the characteristic photoluminescence (PL) at each temperature level, with a keen focus on discerning any subtle changes. As demonstrated in Figure 6 of the experiment results, minimal color enhancement was detected at these lower temperatures. However, a slight modification became perceptible when the temperature reached the thresholds of 750 to 800°C, indicating the beginning of the so-called order–disorder behavior in the crystal structure, when an Mg cation exchanges its site with an Al cation [53, 54, 55, 56, 57, 58]. As such, this careful application of photoluminescence analysis provided valuable insights into the thermal behavior of natural spinel and its potential for color alteration through heat treatment.Furthermore, in several recent investigations, photoluminescence (PL) analysis has been utilized to detect heat and beryllium treatments in natural sapphires—treatments that are commonly applied to enhance the gemstones’ color and clarity. The PL spectra of sapphires subjected to heat treatment reveal significant alterations, notably the emergence of new Cr3+ luminescent peaks that signify modifications within the corundum structure (Figure 7). More precisely, sapphires treated with beryllium exhibit luminescent peaks that are distinct and characteristic of the chrysoberyl structure, differing markedly from the emission spectrum of unaltered corundum [13, 14]. This research underscores the critical nature of these spectral changes as a diagnostic tool for the detection of beryllium, offering a non-destructive and reliable method for tracing the treatment history of gemstones. While the LA-ICP-MS technique has long been the standard for identifying beryllium, PL analysis provides a sophisticated and less invasive alternative.
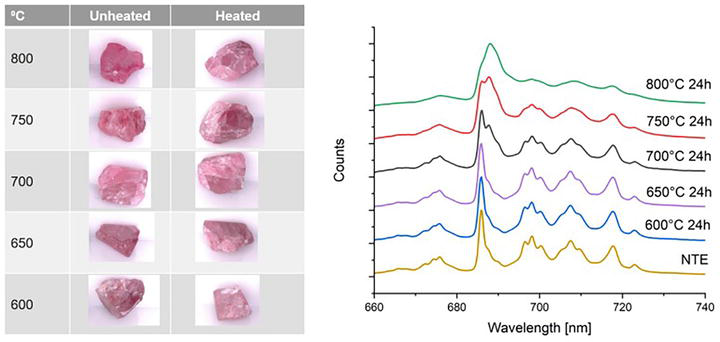
Figure 6.
The outcomes of heat treatment experiments on natural spinel over 24 hours, conducted at temperatures of 600°C, 650°C, 700°C, 750°C, and 800°C (left). And the corresponding changes observed in the photoluminescence (PL) spectrum of the spinel due to these varying temperatures (right).
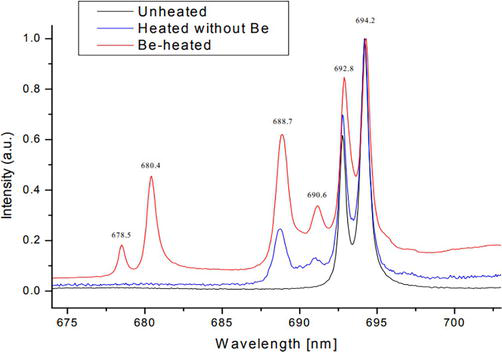
Figure 7.
Luminescence spectra of unheated sapphire (black; showing only the emission of Cr3+ in the corundum structure), heated at 1650°C (blue; Cr3+ also in the boehmite structure), and Be-treated sapphire (red; Cr3+ also in the chrysoberyl structure) (source [
3.2.2 Clarity enhancement
Photoluminescence analysis has emerged as a technique also applied to assess clarity treatments in gemstones. This method uses multi-excitation fluorescence imaging to detect treatment materials. By employing specific excitation wavelengths, this technique can highlight the fillers used in treatments, such as oils or resins in emeralds, while minimizing interference from the gemstone’s inherent fluorescence. The innovative approach employs a combination of LED light sources and a color camera with filters to capture detailed fluorescence images of the treated gemstones. This research showcases the potential for rapid and accurate identification of clarity enhancements, particularly demonstrated through the detection of common emerald fillers, thereby streamlining the gemological evaluation process [59].
3.3 Application of PL in origin determination
Photoluminescence (PL) analysis is a valuable tool in the pre-selection and origin determination of gemstone, for example, corundum. The influence of chromium on luminescence is significant, but it is not the only factor; iron also plays a crucial role in modulating fluorescence intensity. The presence of iron is known to quench fluorescence in many minerals. This suggests that the levels of iron can significantly influence the luminescent properties of gemstones. This phenomenon is particularly important in gemstone identification, where the presence or absence of luminescence can provide insights into a gem’s composition and inherent characteristics. Notably, higher concentrations of iron in gemstones are often associated with reduced luminescence. Understanding this relationship is crucial for interpreting their luminescent behavior [16, 17, 60].
In the specific context of rubies and sapphires, there is a notable contrast in their iron (Fe) and chromium (Cr) contents. Rubies are characterized by a high chromium concentration (at least 2000 ppm, reaching up to 10,000 ppm) and variable iron levels (ranging from undetectable to several thousand ppm), as noted in various studies (see [61]). Conversely, sapphires are predominantly composed of high iron levels (a few hundred ppm to tens of thousands of ppm) and low chromium contents (ranging from undetectable to around 1000 ppm) (see [62]). Consequently, the fluorescence intensity in rubies is typically much more pronounced than that in sapphires. This variation in intensity can be semi-quantitatively analyzed either through spectrum intensity or by measuring integration time at a fixed luminescence level, which is especially useful given that a ruby’s luminescence often surpasses the spectrometer’s upper limit. Figure 8 illustrates the correlation between the Cr/Fe ratio’s chemical characteristics and the integration time needed for a fixed luminescence intensity. The scale for integration time spans from microseconds (μs) to seconds (s), offering a comprehensive spectrum to distinguish between rubies and sapphires. For instance, a marble-type ruby, known for its low iron content, requires only a few hundred microseconds of integration time. In contrast, a basaltic sapphire, with its high iron content, necessitates up to several seconds to achieve a luminescence intensity comparable to that of the ruby.
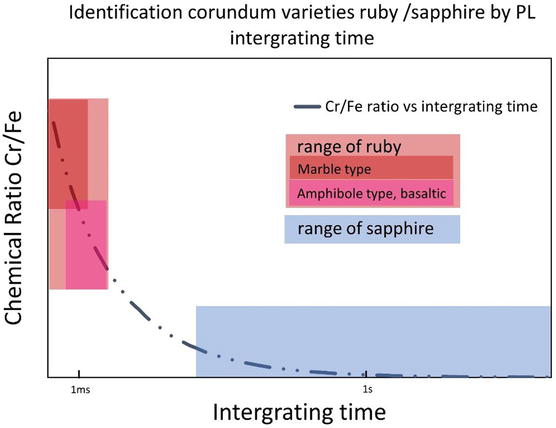
Figure 8.
Correlation between the Cr/Fe ratio’s chemical characteristics and the PL integration time.
Moreover, natural rubies can be differentiated based on their iron contents. Marble-type rubies, typically containing less than 1000 ppm of iron and originally from countries such as Myanmar, Vietnam, and Tajikistan, exhibit significantly stronger PL compared to high-iron amphibole type and basaltic rubies (iron contents over 2000 ppm) from locations such as Mozambique and Thailand [61]. This distinction in PL intensity between marble- and high-iron-type rubies further underscores the utility of PL analysis in not only identifying gemstone varieties but also in tracing their geographical origins.
3.4 Discussion
Photoluminescence analysis represents a significant advancement in gemological diagnostics, potentially revolutionizing traditional ultraviolet testing methods. Ultraviolet testing, while a subjective observational technique, is prevalent in daily gemological practice. For instance, assessing the fluorescence strength under long-wave and short-wave UV light is a key method for distinguishing between marble and amphibole-type rubies. Additionally, the detection of chalky fluorescence under short-wave UV light serves as a critical indicator of heat treatment. Moreover, long-wave UV handheld lights are commonly utilized to evaluate the presence of clarity enhancement fillers within gemstone fissures. Now, the introduction of portable photoluminescence spectrometers transforms these subjective assessments into quantifiable visual spectra. This shift not only dramatically increases the sensitivity of detection but also aids in drawing more objective conclusions. Moreover, it contributes significantly to the digitization of gemological testing processes, heralding a new era of precision and standardization in the field.
However, there are several important limitations to note: First, a significant number of gemstone varieties do not exhibit luminescence phenomena. Second, in certain cases, fluorescence spectra can appear similar. For example, the fluorescence spectra of chromium in silicate minerals often show a high degree of similarity, leading to only minimal differences in the fluorescence spectra between emeralds and chromium-bearing tourmaline. In such situations, the assistance of Raman spectroscopy is necessary to accurately identify the specific species or varieties of these materials.
4. Photoluminescence lifetime analysis
Photoluminescence lifetime analysis (PLLA) has become an increasingly valuable tool in the field of gemological studies. This advanced form of spectroscopy detects the temporal events in the environment of a fluorophore, particularly focusing on the decay types signified by a reduction in photoluminescence following excitation (Figure 8). Such techniques have found success in the analysis of biomolecular structures [18], nitrogen-vacancy defects in diamonds [19], and rapid testing of diamond melee sorting [63], evidencing their versatility (Figure 9).
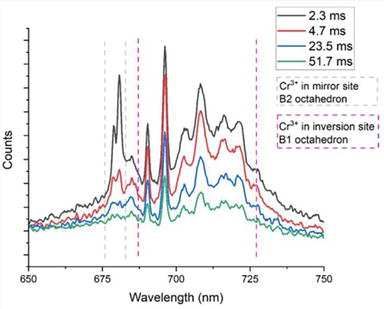
Figure 9.
Time-resolved fluorescence decay spectra of alexandrite, source [
The application of PLLA in studying Cr-doped gem materials, specifically using 405 nm photoluminescence spectroscopy, has yielded impressive results in identifying and distinguishing between natural, heated, and lab-grown spinel and alexandrite based on luminescence decay profiles [20]. These gemstones demonstrate long photoluminescence lifetimes, with that for spinel ranging from 9 to 23 microseconds and that for alexandrite ranging from 25 to 53 microseconds, which can be quantitatively measured and differentiated (Figure 10). Furthermore, studying the fluorescence decay of ruby, another Cr-doped gemstone, revealed a notably shorter lifetime compared to spinel and alexandrite, suggesting a clear distinction based on crystallographic properties. These findings highlight the importance of structural complexity in governing electron decay paths and the duration of excited states, which can be altered through treatments such as heating, thus affecting the decay profiles.
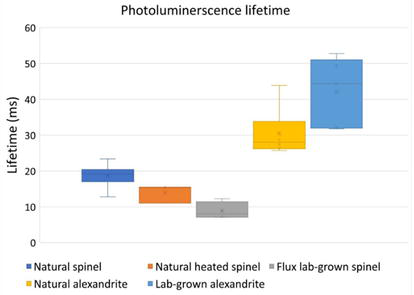
Figure 10.
PL lifetime of spinel and alexandrite varieties, source [
As an additional non-destructive technique alongside Raman and photoluminescence spectroscopic analyses, photoluminescence lifetime analysis (PLLA) provides deeper insights into the crystal structure. For instance, the study of time-resolved photoluminescence spectroscopy on spinel and alexandrite revealed the Mg-Al order–disorder behavior of spinel post-heating through semi-quantitative fitting analysis of the exponential decay curves. It also successfully laid out the contributions of Cr in alexandrite in two types of slightly distorted interstitial octahedral sites: octahedra with Ci symmetry and octahedra with Cs symmetry [20]. Such intricate studies are typically the domain of those applying more complex analytical techniques, such as X-ray diffraction (XRD) or single-crystal X-ray analysis. From a gemological standpoint, distinguishing heated natural spinel from flux-grown synthetic spinel, or natural alexandrite from synthetic alexandrite, often requires the assistance of advanced trace element analysis techniques such as LA-ICPMS or FTIR. Both Raman and singular photoluminescence spectroscopic analyses reach their limits and are unable to differentiate between them. However, PLLA alters this predicament by offering new avenues from the insight of crystal structure to address these challenges, all while maintaining the non-destructive approach that is paramount in gemological analysis.
LA-ICPMS represents the pinnacle of contemporary gemological testing methodologies, distinguishing itself as an indispensable tool in technologically advanced gemological laboratories. This sophisticated technique primarily focuses on the precise quantitative analysis of trace elements, a critical aspect for determining the provenance of prestigious gemstones such as rubies, sapphires, emeralds, alexandrites, and red spinels. Furthermore, LA-ICPMS excels in identifying complex treatments in gemstones, such as beryllium diffusion in sapphires, and discerning between naturally heated spinels and flux synthetic spinels, as highlighted in this discussed section.
Nonetheless, while LA-ICPMS is renowned for its remarkable precision and comprehensive analytical capabilities, it is important to recognize its limitations. One of the primary challenges lies in its high operational and maintenance costs, alongside its restricted portability, which can be a significant barrier, especially for smaller-scale laboratories. In light of these constraints, the advent of the PLLA method represents a promising shift in the field. PLLA offers a more cost effective and expedient solution, making it an accessible alternative for gemological laboratories that may not have the extensive resources required for LA-ICPMS.
It is crucial to acknowledge, however, that PLLA is still in its nascent stages. The consistency and reliability of results obtained from PLLA as compared to LA-ICPMS necessitate further empirical investigation. This involves the analysis of a larger pool of comparative samples and extensive data to affirm the precision and reliability of PLLA. Investing in such studies is of paramount importance. The primary advantage of Photoluminescence and PLLA lies in their non-destructive nature and rapid analysis capabilities, coupled with significantly lower operational costs. These attributes not only enhance the efficiency of gemological testing but also broaden the scope of their application, making spectroscopical analysis more accessible and sustainable in the long run.
The initial research with the 405 nm PL device offers promising insights into the capabilities of time-resolved photoluminescence in gemstone identification and treatment detection. As we look toward future studies, the use of more refined measurements and sophisticated instrumentation is anticipated to refine the methods for distinguishing between various groups of gemstones.
Unlike traditional testing methods, time-resolved photoluminescence provides quantitative assessments, processing large data sets which, when combined with automated data acquisition and analysis software, can meet the rigorous demands of gemstone testing analysis. The outlook for PLLA in gemstone testing is promising, with potential applications in determining gemstone treatments, identifying species, and possibly tracing origins, thereby advancing both the precision and efficiency of gemological studies.
5. Integration with automation of big data analysis
In this chapter, we have explored laser-induced spectroscopic methods, specifically Raman spectroscopy, photoluminescence analysis, and photoluminescence lifetime analysis (PLLA), and showcase their practical applications in addressing routine challenges faced in gemological laboratories. Many of these techniques and their corresponding equipment are still in the early stages of development, yet they hold the potential to revolutionize the capabilities of non-destructive analytical processes.
A shared characteristic of these methods is the standardized collection of spectral data, which can be automatically processed using sophisticated algorithms. The instruments developed to date, for instance, are equipped with automated spectrum decoding programs [22, 23, 59]. This feature is a significant advancement compared to many traditional gemological testing methods that rely on subjective interpretation. Laser excitation spectroscopy methods allow for objective and independent analysis based on an established database, greatly enhancing the reliability and efficiency of gemological assessments.
As previously discussed, relying on a single method for gemstone testing can lead to deviations in results due to the limitations of the material being tested, the testing method, or the instrumentation itself. In an improvement on that scenario, since Raman spectroscopy, photoluminescence, and PLLA each have their unique strengths, they can complement each other, make up for one another’s shortcomings, and cross-verify conclusions. Consider an example with emerald, where a low-quality emerald with excessive fillers causing excessive fluorescence may disrupt the Raman spectrum test. In such instances, the characteristic fluorescence spectrum of chromium in a beryl crystal environment can be used to confirm that it is an emerald as a conclusive result. Conversely, for iron-colored green tourmaline, which may not exhibit any fluorescence spectrum, a clear Raman spectrum of tourmaline can be obtained without interference from fluorescence. In the case of spinel, the overlapping Raman and photoluminescence (PL) spectra between heated natural spinel and flux lab-grown spinel pose a challenge for spectroscopic testing. PLLA becomes crucial in solving this problem. Similarly, the issue of overlapping Raman and PL spectra between natural and lab-grown alexandrite can be effectively addressed using PLLA. When feasible, employing multiple methods simultaneously and compiling an extensive reference database can significantly enhance the accuracy of test results and the determination of mineral subspecies, reducing the need for subjective judgments from gemologists.
The implementation of laser-induced spectroscopic testing systems is notably advantageous due to their compatibility with big data analysis, which centers on a thorough understanding of various data types, the application of flexible data analysis tools, and a focused approach to defining and predicting expected outcomes. These principles are supported by the four critical dimensions of big data, commonly referred to as the four V’s [64]: volume, which pertains to the quantity of data; variety, relating to the different types of data; velocity, which addresses the speed of data processing and analysis; and veracity, concerning the accuracy and reliability of the data. This alignment with big data principles enhances the efficacy and precision of these spectroscopic testing systems.
Laser-induced spectroscopic testing systems exemplify these principles in action. These methods are adept at handling the “volume” of data generated from singular or multiple excitation sources, such as a 405 nm laser, as described in the text. This allows for the categorization and sub-categorization of materials, satisfying the “variety” aspect based on a consistent set of analytical conclusions. Meanwhile, the “velocity” of data analysis is unprecedented, with the capability to complete testing across all three methods in a timeframe ranging from a mere 1 to 10 seconds. Finally, the “veracity” of the testing outcomes is ensured through mutual verification across the methods, reinforcing the reliability and accuracy of the conclusions drawn.
This comprehensive approach to data analysis in gemological testing through laser-induced spectroscopy not only streamlines the process but also enhances the precision and trustworthiness of the results. As such, this integration of modern techniques represents a significant leap forward in the field, offering a more nuanced and rapid understanding of gemological properties.
6. Conclusion
This chapter delved into the transformative impact of laser-induced spectroscopy in the realm of gemology. The deployment of Raman spectroscopy, photoluminescence (PL), and photoluminescence lifetime analysis (PLLA) represents a paradigm shift in the way gemstones are analyzed and characterized. To date, these techniques have proven invaluable in distinguishing natural gems from lab-grown counterparts, identifying treatment methods, and tracing the origins of significant colored gemstones.
The integration of these advanced spectroscopic methods in gemological testing has not only enhanced the precision and accuracy of gemstone identification but also streamlined the analysis process. The ability to conduct non-destructive, rapid, and reliable tests on gemstones using these technologies is a significant advancement over traditional methods. This progression aligns seamlessly with the growing need for more sophisticated and efficient testing procedures in the face of the increasing complexity of gemstone treatments and the proliferation of synthetic varieties.
Photoluminescence, in particular, has emerged as a crucial tool for understanding the chemical and structural properties of gemstones. Its application in determining the chromium contents in various stones and its role in identifying heat treatments in minerals such as spinel and sapphire exemplify its versatility and effectiveness. Similarly, Raman spectroscopy’s capacity to classify minerals accurately and its application in distinguishing natural from synthetic gemstones underscore its significance in modern gemology. Meanwhile, photoluminescence lifetime analysis (PLLA) provides deeper insights into the crystal structure of gemstones. This method opens up a new avenue for investigating intricate details of alterations in the crystal lattice in a non-destructive manner.
Furthermore, the adoption of these techniques in gemological laboratories has facilitated greater transparency and accountability within the industry. In this sense, by providing more detailed and accurate information about gemstones, these methods assist in maintaining the integrity of the market and the trust of consumers.
As we look to the future, the ongoing development and integration of these advanced spectroscopic techniques with automation and big data analysis promise to further revolutionize gemological testing. This evolution will likely lead to even more sophisticated, efficient, and comprehensive analysis methods, ensuring that the gemology field remains at the forefront of scientific innovation and continues to meet the challenges posed by an ever-changing market.
The advancements discussed in this chapter not only highlight the current state of gemological testing but also pave the way for future innovations that will continue to enhance the field’s ability to discern, categorize, and appreciate the intricate beauty and complexity of gemstones.
Acknowledgments
I would like to extend my heartfelt thanks to my former colleagues at the GIA’s research department: Dr. T.H. Tsai, Dr. A. Palke, and Dr. W. Wang. Their willingness to involve me in groundbreaking research and innovation projects, coupled with enriching professional knowledge exchanges.
References
- 1.
Willems B, Tallaire A, Barjon J. Exploring the origin and nature of luminescent regions in CVD synthetic diamond. Gems & Gemology. 2011; 47 (3):202-207 - 2.
Eaton-Magaña S, Shigley JE. Observations on CVD-grown. Gems & Gemology. 2016; 52 (3):222-245 - 3.
Eaton-Magaña S, Shigley JE, Breeding CM. Observations on HPHT-grown synthetic diamonds: A review. Gems & Gemology. 2017; 53 :262-284 - 4.
Lu Q , Gong H, Guo Q , Huang X, Cai J. Gemological characteristic difference between colorless CVD synthetic diamonds and natural diamonds. Materials. 2021; 14 (20):6225. DOI: 10.3390/ma14206225 - 5.
Moses TM, Reinitz I, Fritsch E, Shigley JE. Two treated-color synthetic red diamonds seen in the trade. Gems & Gemology. 1993; 29 :182-190 - 6.
Fisher D, Spits RA. Spectroscopic evidence of GE POL HPHT-treated natural type IIA diamonds. Gems & Gemology. 2000; 36 :42-49 - 7.
Collins AT. The colour of diamond and how it may be changed. The Journal of Gemmology. 2001; 27 :341-359 - 8.
Martineau PM, Lawson SC, Taylor AJ, Quinn SJ, Evans DJF, Crowder MJ. Identification of synthetic diamond grown using chemical vapor deposition (CVD). Gems & Gemology. 2004; 40 :2-25 - 9.
Shigley JE, McClure SF, Breeding CM, Shen AH-T, Muhlmeister SM. Lab-grown colored diamonds from Chatham created gems. Gems & Gemology. 2004; 40 :128-145 - 10.
Shigley JE, Breeding CM, Shen AH-T. An updated chart on the characteristics of HPHT-grown synthetic diamonds. Gems & Gemology. 2004; 40 :303-313 - 11.
Wang W, Doering P, Tower J, Lu R, Eaton-Magaña S, Johnson P, et al. Strongly colored pink CVD lab-grown diamonds. Gems & Gemology. 2010; 46 :4-17 - 12.
Wang W, D’Haenens-Johansson UFS, Johnson P, Soe Moe K, Emerson E, Newton ME, et al. CVD synthetic diamonds from Gemesis Corp. Gems & Gemology. 2012; 48 :80-97 - 13.
Wanthanachaisaeng B, Bunnag N, Sutthirat C, Atichat W, Ounorn P, Sripoonjan T. Luminescence of beryllium heat treated corundum. In: Burapha University International Conference. Thailand: Burapha University; 2012 - 14.
Wanthanachaisaeng B, Bunnag N, Sutthirat C, Atichat W, Ounorn P, Sripoonjan T, et al. Investigation of Be-treated sapphire by luminescence spectroscopy. In: in Conference on Raman and Luminescence Spectroscopy CORALS–2013. Austria: University of Vienna; 2013 - 15.
Eaton-Magaña S, Breeding CM. An introduction to photoluminescence spectroscopy for diamond and its applications in gemology. Gems & Gemology. 2016; 52 :2-17 - 16.
IGR. Basic Elements of Photoluminescence Spectroscopy in Gemology [Online]. IGR; 2018. Available from: https://www.rivistaitalianadigemmologia.com/en/2018/02/23/basic-elements-of-photoluminescence-spectroscopy-in-gemology/ - 17.
Eaton-Magaña S, Breeding CM, Palke AC, Homkrajae A, Sun A, McElhenny G. Raman and photoluminescence mapping of gem materials. Minerals. 2021; 1 (2):177. DOI: 10.3390/min11020177 - 18.
Gupta A, Hacquebard L, Childress L. “Efficient signal processing for time-resolved fluorescence detection of nitrogen-vacancy spins in diamond”. Journal of the Optical Society. 2016; 33 : 28-34 - 19.
Jones D, Alexandrov Y, Curry N, Kumar S, Lanigan P, McGuiness C, et al. Multidimensional spectroscopy and imaging of defects in synthetic diamond: Excitation-emission-lifetime luminescence measurements with multiexponential fitting and phasor analysis. Journal of Physics D: Applied Physics. 2021:5303 - 20.
Xu W, Tsai T-H, Palke A. Study of 405 nm laser-induced time-resolved photoluminescence spectroscopy on spinel and alexandrite. Minerals. 2023; 13 (3):419 - 21.
Scarani A, Åström M. Raman spectroscopy: Technique. Rivista Italiana Di Gemmologia. 2017; 2 :42-45 - 22.
Tsai T, Xu W. Rapid gemstone mineral identification using portable Raman spectroscopy. Journal of Raman Spectroscopy. 2023; 54 :640-650 - 23.
Tsai T-H, D’Haenens-Johansson UFS. Rapid gemstone screening and identification using fluorescence spectroscopy. Applied Optics. 2021; 60 :3412-3421 - 24.
GIA. Gem Identification Lab Manual. Carlsbad, California: Gemological Institute of America; 2005 - 25.
Groat L, Giuliani G, Stone-Sundberg J, Renfro ND, Sun Z. A review of analytical methods used in geographic origin determination of gemstones. Gem & Gemology. 2019; 55 :512-535 - 26.
Liddicoat R. Developing the powers of observation. Gems & Gemology. 1962; 10 :291 - 27.
Fritsch E, Rossman GR. An update on color in gems. Part 1: Introduction and colors caused by dispersed metal ions. Gems & Gemology. 1987; 23 :126-139 - 28.
Chow BHY, Reyes-Aldasoro CC. Automatic gemstone classification using computer vision. Minerals. 2022; 12 (1):60 - 29.
Breeding C. Developments in gemstone analysis techniques and instrumentation during the 2000s. Gems & Gemology. 2010; 24 :241 - 30.
Anton-paar. Handheld Raman Spectrometer: Cora 100 [Online]. Austria: Anton-paar; 2024. Available from: https://www.anton-paar.com/ca-en/products/details/handheld-raman-spectrometer-cora-100/ - 31.
StellarNet, Inc. StellarRAM Handheld Raman Spectrometer [Online]. Florida: StellarNet, Inc.; 2024. Available from: https://www.shopstellarnet.com/stellarram-handheld-raman-spectrometer/ - 32.
StellarNet Inc. 785nm Preconfigured Raman Spectrometer System [Online]. Florida: StellarNet Inc.; 2024. Available from: https://www.shopstellarnet.com/785nm-preconfigured-raman-spectrometer-system/ - 33.
Magilabs Ltd. gemmoraman. Magilabs Ltd.; 2024 [Online]. Available from: https://www.gemmoraman.com/products/gemmoraman-532/ - 34.
Krishnan R. Raman Spectrum of diamond. Nature. 1945; 155 :216 - 35.
Beny JM, Piriou B. Vibrational spectra of single-crystal topaz. Physics and Chemistry of Minerals. 1987; 15 :148-159 - 36.
Saeseaw S, Wang W, Scarratt K, Emmett JL, Douthit TR. Distinguishing Heated Spinels from Unheated Natural Spinels and from Synthetic Spinels. 2009. [Online]. Available from: https://www.gia.edu/doc/distinguishing-heated-spinels-from-unheated-natural-spinels.pdf - 37.
Huong LT-T, Häger T, Hofmeister W. Confocal micro-Raman spectroscopy: A powerful tool to identify natural and synthetic emeralds. Gems & Gemology. 2010; 46 :36-41 - 38.
Illy E, Karlsson H. How to Choose a Laser: How to Choose a Laser for Raman Spectroscopy. Oklahoma: Laser Focus World; 2018. [Online]. Available from: https://www.laserfocusworld.com/lasers-sources/article/16555207/how-to-choose-a-laser-how-to-choose-a-laser-for-raman-spectroscopy - 39.
Metrohm. Auswahl der am besten geeigneten Laser-Wellenlänge für Ihre Raman-Anwendung. 2024. [Online]. Available from: https://www.metrohm.com/de_ch/applications/bw-tek-applikationen/410000001-c.html - 40.
CNI. 405 nm Violet Blue Diode Laser. Changchun, China: CNI; 2024 [Online]. Available from: http://www.cnilaser.com/blue_laser405.htm - 41.
Renishaw. Multi-laser Raman analysis of zirconia. 2017. [Online]. Available from: https://www.renishaw.com/en/multi-laser-raman-analysis-of-zirconia--43004 - 42.
UNSW, "Renishaw. inVia Reflex. Raman Microscope (532, 785, 830 and 1064 nm)," 2024. [Online]. Available from: https://www.analytical.unsw.edu.au/facilities/speclab/instruments/renishaw-invia-reflex-raman-microscope-532-785-830-and-1064-nm - 43.
Stockton CM. The separation of natural from synthetic emeralds by infrared spectroscopy. Gems & Gemology. 1987; 23 :96-99 - 44.
Mashkovtsev RI, Solntsev VP. Channel constituents in synthetic beryl: Ammonium. Physics and Chemistry of Minerals. 2002; 29 (1):65-71 - 45.
Schmetzer K, Kiefert L. Water in beryl—A contribution to the separability of natural and synthetic emeralds by infrared spectroscopy. Journal of Gemmology. 1990; 22 :215-223 - 46.
Renishaw. Photoluminescence spectroscopy and fluorescence explained. renishaw, [Online]. Available from: https://www.renishaw.com/en/photoluminescence-spectroscopy-and-fluorescence-explained--25809 - 47.
Tuschel D. Photoluminescence spectroscopy using a Raman spectrometer. Spectroscopy. 2016; 31 :14-21 - 48.
Tuschel D. Selecting an excitation wavelength for Raman spectroscopy. Spectroscopy. 2016; 31 :14-23 - 49.
Gaft M, Reisfeld R, Panczer G. Modern Luminescence Spectroscopy of Minerals and Materials. Cham, Switzerland: Springer; 2015 - 50.
Sicree A. Chrome, Rubies, Emeralds, and Alexandrite. 2007. [Online]. Available from: http://worcestermineralclub.org/wp-content/uploads/2015/03/PopMin-07a.pdf - 51.
Gemporia. Gemstone Elements: Chromium. United Kingdom: Gemporia; 2017 [Online]. Available from: https://www.gemporia.com/en-gb/gemology-hub/article/644/gemstone-elements-chromium/ - 52.
Peretti A, Günther D, Haris M. New type of treatment of spinel discovered involving heat-treatment and cobalt-diffusion. 2015. [Online]. Available from: https://www.gemresearch.ch/assets/documents/publication-articles/2015-05-spinel-diffusion-treatment-1.pdf - 53.
Yamanaka T, Takéuchi Y. Order-disorder transition in MgAl2O4 spinel at high temperatures up to 1700°C. Zeitschrift fuer Kristallographie. 1983; 165 :65-78 - 54.
Peterson R, Lager G, Hitterman R. A time-of-flight powder diffraction study of MgAl2O4 at temperatures up to 1273 k. American Mineralogist. 1991; 76 :1455-1458 - 55.
Redfern S, Harrison R, O’Neill H, Wood D. Thermodynamics and kinetics of cation ordering in MgAl2O4 spinel up to 1600°C from in situ neutron diffraction. American Mineralogist. 1999;84 :299-310 - 56.
Andreozzi G, Princivalle F. Kinetics of cation ordering in synthetic MgAl2O4 spinel. American Mineralogist. 2002; 87 :838-844 - 57.
Méducin F, Redfern S. Study of cation order-disorder in spinel by in situ neutron diffraction up to 1600 K and 3.2 GPa. American Mineralogist. 2004; 89 :981-986 - 58.
Princivalle F, Martignago F, Dal Negro A. Kinetics of cation ordering in natural Mg(Al, Cr3+)2O4 spinels. American Mineralogist. 2006; 91 :313-318 - 59.
Tsai T-H. Multi-excitation fluorescence imaging for identifying clarity enhancement in gemstones. In: Proc. SPIE 11815, Novel Optical Systems, Methods, and Applications XXIV. Vol. 1181505. Washington, USA: SPIE (The International Society for Optics and Photonics); 2021 - 60.
Arem JE. What Can Gemstone Luminescence Indicate? IGS; 2024. [Online]. Available from: https://www.gemsociety.org/article/understanding-luminescence-gemology/ - 61.
Palke AC, Saeseaw S, Renfro ND, Sun Z, McClure SF. Geographic origin determination of ruby. Gems & Gemology. 2019; 55 :580-612 - 62.
Palke AC, Saeseaw S, Renfro ND, Sun Z, McClure SF. Geographic origin determination of blue sapphire. Gems & Gemology. 2019; 55 :536-579 - 63.
Lanigan PMP, McGuinness CD, Rendle M, Aked PA, Bearcroft CG, Jones DC, et al. Real-time detection of long lived near infrared luminescence from colourless cubic zirconia by time-gated imaging. Minerals. 2020; 10 :891-902 - 64.
Opensistemas. The Four V’s of Big Data. 2023. [Online]. Available from: https://opensistemas.com/en/the-four-vs-of-big-data/