
Abstract
Platelet microvesicles (PMV) carry receptors and contain genetic information. They are delivered from platelets by budding or by exocytosis of α-granules and are able to activate leukocytes and endothelial cells, resulting in inflammatory reactions. Therefore, the ultrastructural investigation and counting of PMV in platelet concentrates (PC) produced by apheresis or pooled buffy coats were investigated. High numbers of PMV in PC can occasionally provoke severe transfusion reactions in recipients suffering from thrombocytopenia caused by different diseases or therapeutic interventions. The ultrastructural investigation of PMV in PC, produced by different manufacturing methods, can significantly contribute to their quality evaluation. PMV was investigated and enumerated using transmission electron microscopy (TEM) on filmed grids by the negative contrasting method and a special photomontage option integrated with TEM. Image aspects of four areas of about 8,500 × 8,500 nm could be sifted through. Using reference gold particles with a known concentration, added to the sample of the PC preparation, and applied to the grid, the number of PMV/μl of the sample could be calculated. Using morphometry, their distribution in terms of area was determined. Visualization of single PMV in ultracentrifuged or alginate-embedded PC samples was enabled by using electron tomography (ET).
Keywords
- number of platelet microvesicles
- platelet concentrates
- apheresis versus pooled PC electron tomography
- negative contrast
- embedding in alginate
1. Introduction
Platelet microvesicles (PMV) or platelet microparticles are able to address signals to leukocytes and endothelial cells. For this purpose, they are equipped with receptors for docking to these target cells but also contain genetic information in the form of small chain RNA, able to change the function of the respective target cells [1]. PMV can provide changes in coagulation and clot formation in platelet concentrates (PC) [2, 3, 4]. High numbers of PMV can induce adverse transfusion reaction by binding to the surface receptor PSGL, present on leucocytes, via the platelet activation molecule CD62P, leading to PLT activation and to a liberation of inflammatory enzymes [5, 6]. A high expression of CD40L by PMV can also be involved in the occurrence of transfusion-related acute lung injury (TRALI) [7]. PMV are also involved in several diseases such as rheumatoid arthritis, systemic lupus erythematosus, cancers, cardiovascular diseases, and infections [4].
Most PMVs exhibit a wide variety of sizes. Depending on the size and subcellular origin, they were characterized by different terms such as platelet microparticles, microvesicles, exosomes, or ectosomes. In general, two kinds of PMV can be distinguished: exosomes, originating from α-granules with a size range of 50–150 nm, and ectosomes, delivered by budding with a size of 100–1000 nm [8]. Routinely, PMV can be enumerated by using flow cytometry [9, 10, 11], but there is a detection limit concerning PMV > 1 μm and those < 0.5 μm [12]. Nevertheless, the use of advanced flow cytometers allows measuring smaller particles under a threshold of 0.2 μm, but a clear discrimination between exosomes and ectosomes is not possible. Stoner et al. [13] recently developed a highly sensitive flow cytometer for the enumeration of PMV, to estimate size, and to demonstrate molecular characteristics of individual extracellular vesicles [14].
Therefore, the aim of our study was to count and discriminate PMV in PC derived from healthy human donors on the ultrastructural level by transmission electron microscopy (TEM) including morphometric methods. The focus of this study was not only the enumeration but also above all, the visualization of PMV at the ultrastructural level. For this purpose, we used the negative staining method on formvar/carbon-coated EM-grids. In addition, we characterized PMV, encapsulated in alginate, by ET. Furthermore, different PC manufacturing methods such as apheresis-derived versus buffy coat-pooled PC were compared.
2. Platelet concentrates
Our investigations are focused on PLT in PC. PC belongs to biogenic drugs, which are administered in order to treat severe bleeding disorders (thrombocytopenia). The presence of thrombocytopenia is, according to the definition, if the PLT number in the blood falls below 150.000/μl. Health problems for a patient occur if the PLT count is lower than 50.000/μl, such as in hemorrhagic diathesis, thrombocytopenic purpura, or petechiae. Dramatic bleeding episodes appear about PLT counts under 10.000/μl. In this situation, a transfusion of a PC is indicated [15, 16].
There are several reasons causing thrombocytopenia:
Failure in the development of PLT in the bone marrow
PLT dysfunction is associated with chronic liver failure [17]
Inherited disorders of PLT production or function such as Glanzmann–Thrombasthenia, Bernard–Soulier Syndrome, Gray Platelet Syndrome, Storage Pool Disease, and Scott Syndrome [18]
Disseminated Intravascular Coagulation [19]
Impaired thrombopoiesis due to tumor genesis but also after antibacterial or antitumor chemotherapy or irradiation [20]
Increased degradation of PLT as a consequence of bacterial and viral infections [21]
For reviews, refer to [22, 23].
Platelet concentrates are produced either by apheresis or by collecting buffy coats from four donors. In this study, only pathogen-inactivated PCs were investigated. This implies that the receptors at the surface of the PMV remain generally intact while the nucleic acids inside of the particles are inactivated. Therefore, the communication of PMV with target cells such as leucocytes and endothelial cells is certainly reduced.
Apheresis requires apheresis machines that work on the principle of zonal centrifugation. In our studies, a Fenwal Baxter Amicus™ (Baxter Healthcare Corporation, Fenwal Division, Round Lake, USA) or a Haemonetics MCS®+ 9000 Mobile Platelet Collection System, Haemonetics Austria GmbH were used. In the Fenwal Baxter Amicus system, plasma containing PLT is continuously separated during centrifugation in a collection chamber while the other blood components are reinfused to the donor. The advantage of this technique is a high yield of PLT and a relatively short apheresis duration, which is less stressful for the donor. The disadvantage of this method is the fact that the PLT remains in the collection chamber during the whole centrifugation time, which implies a higher shear stress. With respect to the Haemonetics MCS device, whole blood is continuously processed, but the system changes in definite time intervals between blood collection and reinfusion of the PLT-extracted blood components. PLT is collected in a storage chamber, which is not subjected to centrifugation. Therefore, this processing method is milder since the PLT are less subjected to centrifugation forces, but the apheresis duration with the Haemonetics MCS system is significantly longer compared with the apheresis time using the Fenwal Baxter machine, which is more stressful for the donor. Buffy coat-derived PC is prepared in a two-step centrifugation process. In the first step, whole blood is collected into triple bags containing a citrate buffer solution (CPD) and centrifuged at 4000 × g for 10 min. Red blood cells and plasma are separated from the buffy coat fraction and transferred into satellite containers. Subsequently, buffy coats from four different donors and one bag containing either 300 ml plasma from one of the four donors or PLT additive solution are connected by using a sterile connection device and are pooled in one container. Subsequently, a 1 l polyolefin bag and a leukocyte reduction filter are connected. This pool is then centrifuged at 500 × g for 8 min at 22°C. The supernatant is squeezed out immediately into the storage bag by means of a plasma extractor.
PC are stored in gas-permeable plastic bags for five to seven days. In our experience, all manufacturing processes induced a slight PLT activation, which was partially reversible. With lasting storage time, dead PLT caused by necrosis and apoptosis occurs. In our experiments, the effect of storage time on the number of PMVs was investigated. Not only PLT but also PMV were damaged, leading to single or aggregated membrane fragments. There is no technique available other than transmission electron microscopy using high magnification in combination with negative contrast staining in order to visualize the real condition of a PC preparation.
All these manufacturing methods also lead to a deliberation of PMV, which is increased at higher shear stress, e.g., due to centrifugation forces. As mentioned above, high numbers of PMV may be harmful for the recipient, who is usually in a bad health condition. Using electron microscopical methods, the goal of our study was to count and visualize PMV in PC, comparing different manufacturing methods.
3. Experimental design
3.1 PLT donors
PC, separated from whole blood, was obtained from healthy volunteer donors. In order to investigate the release of PMV at the Austrian Red Cross Blood Donation Center for Vienna, Lower Austria, and Burgenland according to the Austrian regulations for blood donation and after informed consent, the donors were carefully selected and held under health surveillance. The study comprises 14 apheresis PC and 16 pooled buffy coat PC.
As mentioned above, apheresis samples were obtained using a Fenwal Baxter Amicus cell separator (Baxter Healthcare Corporation, Fenwal Division, Round Lake, USA), as previously described [24] or from a Haemonetics MCS®+ 9000 Mobile Platelet Collection System, Haemonetics Austria GmbH. For a detailed description, see the user manual “Working with the Haemonetics MCS®+ Operation Manual” [25].
Preparation of buffy coat-derived PC was carried out as previously described [26].
Pathogen inactivation was carried out using the InterceptTM blood system (Cerus Europe BV, Amersfoort, The Netherlands). This inactivation system uses the psoralen-compound Amotosalen-HCl (C17 H20 ClNO4) that penetrates cell and nucleus membranes and exhibits a high affinity to nucleic acids. Subsequently, Amotosalen-HCl binds covalently to the pyrimidine bases of nucleic acids, which were crosslinked using UV irradiation. The inactivation capacity concerns viruses, bacteria fungi and protozoa [27].
Samples stored in PAS2 additive solution were prepared for TEM analysis on different days over a period of ten days. The PAS2-PLT storage solution represents a modified Thyrode buffer providing the full functionality of PLT in PC [28].
3.2 Sample preparation
10 ml of a PC were centrifuged at 800 × g for 15 min at 20°C using a centrifuge with a swing bucket support ring rotor (Haereus Varifuge CL, Haereus Christ, Hanau, Germany). The PLT pellet was fixed in 0.2 M cacodylate buffer, pH 7.2, containing 2.5% glutaraldehyde (Fluka, Vienna, Austria) for 90 min at 20° C. After fixation, PLT were washed twice by centrifugation at 800 × g for 10 min at 4°C and transferred to 2 ml Eppendorf vials (Eppendorf AG, Hamburg, Germany) 5 ml of the supernatant, containing the PMV, was discarded and fixed for 5 min by adding of 20 μl glutaraldehyde (2.5%). This solution was transferred to dialysis tubes (Spectrum™ Spectra/Por 6 MWCO 1000kD, Fisher Scientific, Vienna, Austria) and dialyzed for 1 h against distilled water. In this study, 5 μl of the following negative contrast solution mix was applied to hexagonal formvar/carbon filmed grids (Electron Microscopy Sciences, Hatfield, Pennsylvania, USA) according to Hacker et al. [29] using an appropriate modification
100 μl of 15 nm reference gold particles (concentration: 1,5 × 10⁷/μl), (AURION Immuno Gold Reagents & Accessories, Wageningen, The Netherlands)
200 μl 1% thulium acetate in 1mM HEPES buffer, Sigma-Aldrich (Vienna, Austria)
100 μl methyl cellulose (25 centipoises, 2% in distilled water), Sigma-Aldrich
1400 μl ultrapure distilled water
200 μl of the fixed and dialyzed PC
The drop of the applied solution was allowed to dry and provided for the ultrastructural investigation.
3.2.1 Preparation of free-floating or ultracentrifuged PMV, encapsulated in alginate beads
10 ml of free-floating PMV, present in the supernatant after centrifugation at 800 × g for 5 min as described above, were centrifuged again by using an Optima XL-80K ultracentrifuge, Beckman Coulter, Inc. 250 S., Kraemer Blvd Brea, CA, USA, at 120.000 × g for 2 h. Pellets were resuspended in 0.5 ml of 2% alginate (Kelco, Rahway, NJ, USA) in a Ca2+ and Mg2+-free PBS (pH 7.4). Encapsulation was initiated by dropping the PLT-containing alginate suspension in a 0.2 M aqueous CaCl2 solution. After 5 min of gelation, the alginate beads were transferred to 10 mL of 2.5% glutaraldehyde in 0.1 M cacodylate buffer (pH 7.2) and incubated for 90 min at 4°C. Alternatively, 100 μl of the PLT containing pellet were directly mixed with 900 μl alginate solution and jellified as described above. Encapsulation in alginate was performed to minimize PLT damage during preparation after fixation and to handle them like a piece of tissue. After washing with cacodylate buffer for 30 min, the beads were fixed again with an aqueous solution of 1% OsO4 (Fluka) for 90 min. Samples were washed again, dehydrated in ethanol, and embedded in Spurr epoxy resin (Fluka). Semithin sections of 300 nm as well as ultrathin sections of 60 nm thickness were performed on an ultramicrotome (Ultracut E, Reichert-Jung, Vienna, Austria) and transferred to Hexagonal Center-Marked Grids, 90 mesh, copper grids with PELCO, Redding, CA, USA, and contrasted for 20 min with 0.2% OTE (Oolong Tea Extract, Nisshin EM Co. Ltd. Tokyo, Japan) in PBS (pH 7.4) and for 5 min with 8% alkaline lead citrate (Merck).
3.3 Electron microscopy
For this study, a Tecnai-20 transmission electron microscope (FEI Company, Eindhoven, The Netherlands) working at a maximum acceleration voltage of 200 KV and equipped with a Lanthanhexaborid (LaB6) cathode, a eucentric goniometer (Compostage), a panorama software (PhotomontageTM) and an electron tomography acquisition software (Xplore3DTM, all from FEI company). Digital images were acquired by using a bottom-mounted Eagle 4k CCD camera; chip size: 4,096 × 4,096 pixels (FEI Company).
Counting of PMV on filmed grids after negative contrast preparations: using the photomontage software, four different areas on the respective grid were selected for enumeration. Digital photos were taken and computerized at 5,000× magnification. At this low magnification, a raster with nine subareas was preselected, each of which was photographed successively by using an internal beam positioning device at a magnification of 14.500×. After complete acquisition, all images were joined together appropriately by stitching. The composed images comprised an area of approximately 18,000 × 18,000 pixels, corresponding to 8,500 × 8,500 nm. Images were analyzed using the extended version of Adobe Photoshop 56 (Adobe Systems Software, Dublin, Ireland) using the manual point counting facility. In the first step, the 15 nm reference beads were counted, and in the second step, the negatively contrasted PMV (Figure 1). The linearity of gold particle numbers in a twofold dilution series was proofed by a calibration curve (Figure 2). The absolute number of PMV per μl was calculated according to the formula (1):
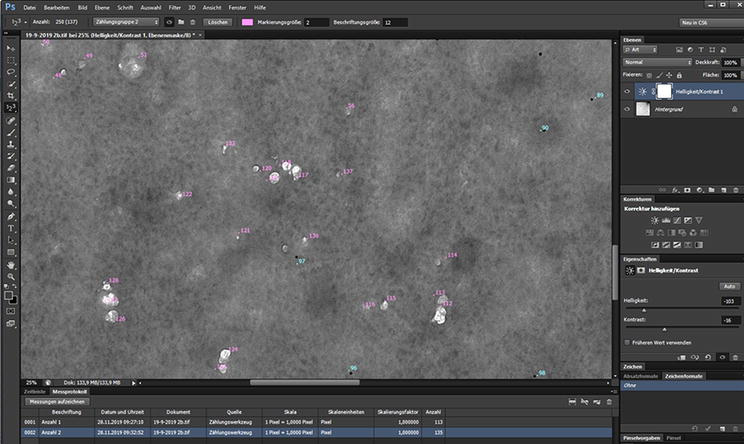
Figure 1.
View of a composed image composed of nine single and stitched images generated by using the photomontage software (11780*11805 Pixel corresponding 8489*8507 nm). Counted PMV are marked in magenta, whereas counted gold reference particles are in blue.
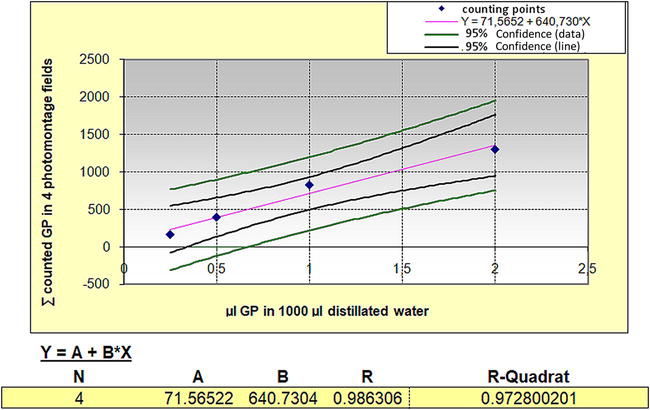
Figure 2.
Graphic of the linear regression analysis of 4 measurement points from a twofold dilution series, performed according to the protocol shown in
Referring to RGP as the reference gold particles, 200 μl as the volume of the added PC sample, and 1,5 × 10¹¹ as the gold particles per μl of the whole sample.
In addition, morphometric analysis was performed using the free available ImageJ software package in randomly selected apheresis versus pooled BC samples by measuring the area of PMV in the images composed by photomontage as described above, by ringing them manually using a sensitive curser.
All data were represented and calculated by Excel worksheets
3.4 Electron tomography (ET)
The 300 nm thick semithin was coated with 10 nm colloidal gold particles on both surfaces, functioning as fiducial markers during subsequent image alignment. Single-axis tomography was carried out by acquisition of a tilt series at a tilt range of −65° to +65° with an increment of 1° using a single tilt holder (FEI Company). The acquisition of the tilt series was performed using an Eagle 4k CCD camera (FEI Company). Tilt series data were digitally recorded automatically with the Xplore3D software (FEI Company), which allows compensating dislocations of the region of interest during tilting. The digital images were stored in stack files (_.mrc). Tilt series were aligned using the 10 nm gold fiducial markers and reconstructed by means of the weighted back projection (WBP) algorithm with the IMOD software (Boulder Laboratory for 3D Electron Microscopy of Cells, University of Colorado, USA). For 3D modeling, the structures of interest in each slice were traced with colored contours that were subsequently merged in the Z-axis with the help of the Amira 5.3 software (Mercury Computer Systems, Merignac, Cedex, France).
4. Results and discussion
The most abundant extracellular vesicles in human blood are derived from PLT or megakaryocytes, accounting for more than half of all EVs in the peripheral blood. As mentioned above, they are able to exert positive and negative effects on human beings [4]. In respect to PC, one can therefore assume that the majority of extracellular vesicles are PMV. As summarized in [30], using cryo-immune electron microscopy, exosomes with a size of 30–100 nm bear the receptor CD63, while ectosomes, sized between 100 and 1000 nm are characterized by the expression of annexin-V at the outer leaflet of the plasma membrane, factor X and prothrombin. The intracellular origin of PMV was shown ultrastructurally by Ponomareva et al. [31]. These authors demonstrated that a fraction of PMV having an intracellular origin contains organelles, such as mitochondria, glycogen granules, and vacuoles. These two types of PMV were also shown by Hermida-Nogueira et al. [32] in Mirasol® pathogen-inactivated PC using TEM.
In randomly selected pellets of PC, different activation stages of PLT as well as apoptotic PLT, can be demonstrated (Figure 3). PMV can also be observed between the PLT, but these are occasionally hard to distinguish from small cross-sectioned filopodia of activated PLT. It is important to note that strongly activated PLTs lose their discoid shape, become amoeboid, and release the contents of their α-granules. Slightly activated PLT remains in a resting stage and can return to its original shape.
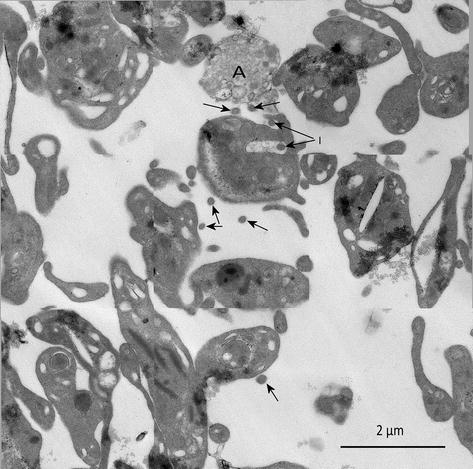
Figure 3.
PLT, collected in a centrifuged PC pellet (800*g for 10 min at 20°C). The image shows that most of the PLTs are slightly activated. One PLT is apoptotic (A). Numerous PMVs are visible (arrows), and one of them (I) sticks already inside of the Open Canalicular System.
Using negative contrast, our study revealed that several types of exosomes could be found in PC. Some of them consist of cohesive aggregates composed of up to 10 single vesicles, as shown in Figure 4. In this respect, we were interested in whether there is a differentiation in the distribution of ectosomes and exosomes in apheresis and BC pooled PC with the help of the morphometric measurement of the area of negatively contrasted PMV. Histograms of the two investigation groups demonstrated a prevalence of larger PMV in apheresis samples.
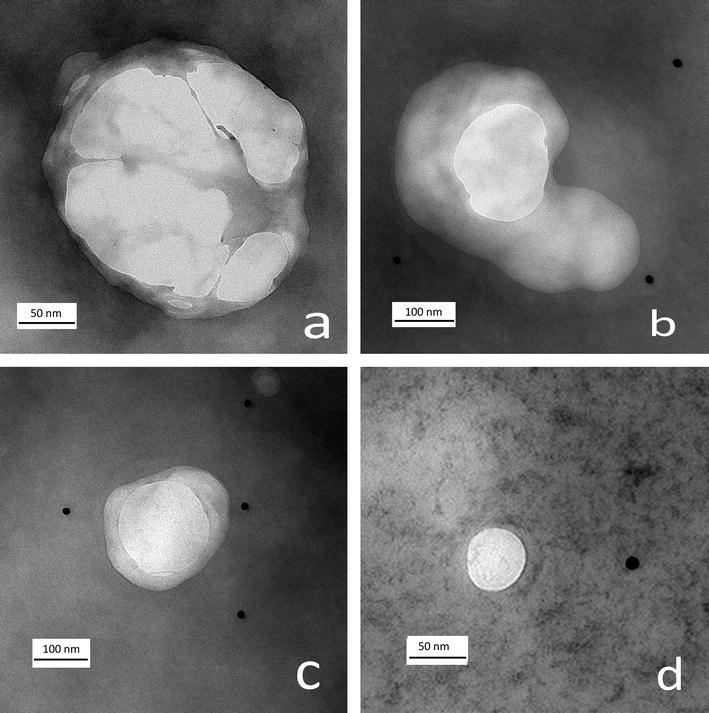
Figure 4.
The image shows different PMVs, regarded as ectosomes (a–c), and one single PMV being an exosome. Images are taken at high magnification (50,000*).
4.1 PMV counting
In contrast to studies using advanced flow cytometers [9, 10, 11, 12, 13, 14], TEM remains the gold standard for detection, characterization, and enumeration of extracellular vesicles [33, 34]. The PMV counting in the negative contrast preparations revealed a conspicuous high concentration between 8.75* 107 and 1.02* 109 per µl. This high concentration certainly implicates significant stress for the recipient of a PC transfusion. As stated by Xie et al. [7], C40L-bearing apheresis-derived PMV, stored for five days, is able to initiate fMLP-activated PMN respiration burst, which might be relative to TRALI. These investigations were carried out with non-pathogen-inactivated PC. Therefore, we do not know what happens with pathogen-inactivated PC after transfusion. Comparing the PMV counts of apheresis and pool PC, no significant difference could be found using the U-test of Mann–Whitney (p = 0.36) as well as with the Wilcoxon test (p = 0.22). These data are of particular interest since a long-lasting discussion of possible quality differences exists between the two production methods. Apheresis PC is always produced from one donor, while pooled PC is derived from different donors, implicating a heterogeneric expression of PLT surface molecules of the human platelet antigens (HPA) and the human leucocyte antigens (HLA). Therefore, only HLA- and HPA-matched apheresis PC can be used for transfusion if histocompatibility is required. Apheresis PCs are thought to be more safe and exhibit fewer adverse reactions than pooled PC [35, 36, 37].
In this study, also the effect of PC storage on PMV counts between 10 days has been investigated. In contrast to pathogen-inactivated PC that can only be stored for a maximum of 5 days, pathogen-inactivated PC allow a prolonged storage time of seven days. Storage must be performed at room temperature in order to avoid cold-induced storage lesions [38]. Regarding the influence of both kinds of PC preparations, there was a significant continuous decrease in PMV with longer storage time (Pearson correlation p= 0.013; Figure 5). This storage effect was more pronounced with respect to the PMV count in apheresis PC (Pearson correlation p<0.01) (Figure 6). We assume that higher stress for the PLT would occur under apheresis conditions, a finding supported by the observation of a higher number of ultrastructurally visible breakdown products in the preparations of prolonged stored PC preparations. This is a new result since not all of the investigations cited above found clear evidence for differences between apheresis and pooled buffy coat PC. In this respect, it is also difficult to interpret this effect concerning the recipient of a PC transfusion.
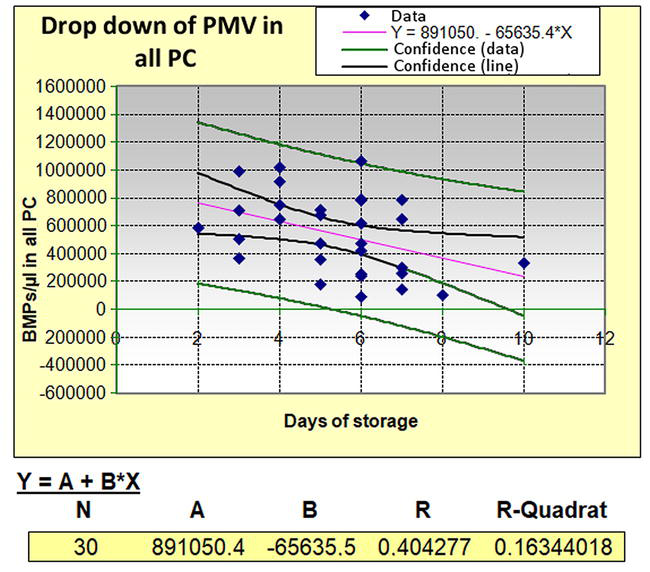
Figure 5.
Graphic of the linear regression analysis showing the drop-down of PMV numbers measured on different days during storage.
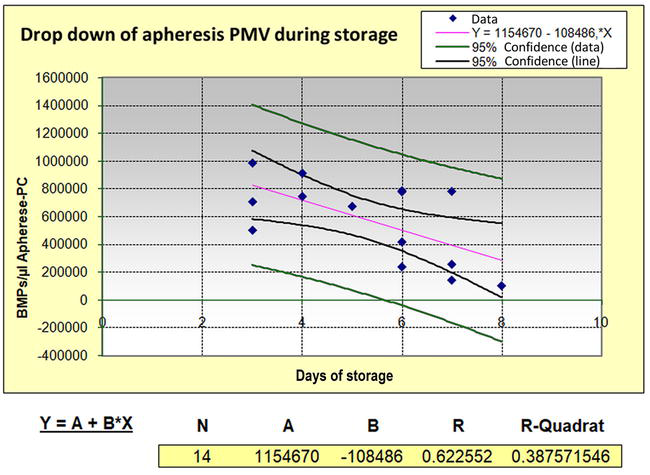
Figure 6.
Graphic of a linear regression analysis showing a more pronounced drop-down of PMV numbers measured on different storage days, respecting only apheresis PC data.
4.2 Transmission electron microscopy of PMV at high magnification and morphometric analysis
At high magnification (50.000×), a majority of PMV was composed of no single particles but was composed of up to eight subunits (Figure 4). Spot-checked morphometric measurements of the area projections of PMV in the negative contrast images showed distribution differences between apheresis and pooled buffy coat PC. Larger PMV were found in apheresis PC (Figure 7). One interpretation for this might be that the composed particles were more disintegrated during the processing of BC pooled PC. In earlier studies, using electron tomography, we could show the liberation of PMV by PLT in the form of sack-like protrusions filled with uniform particles [39]. It is important to note that composed PMV can only be demonstrated by electron microscopy but not flow cytometry, even if highly sensitive apparatuses are applied.
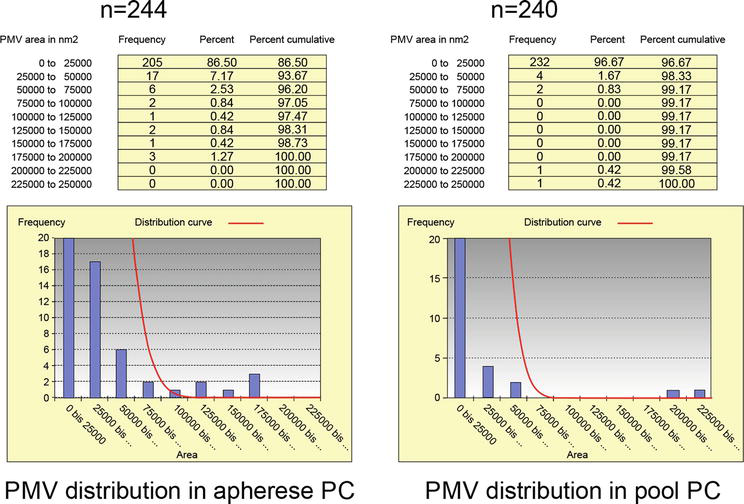
Figure 7.
Morphometric analysis of the projected areas in negatively contrasted samples of apheresis (n = 244) and pooled buffy coat PC (n = 240). The measurement data are histograms showing that larger PMV predominate in apheresis PC.
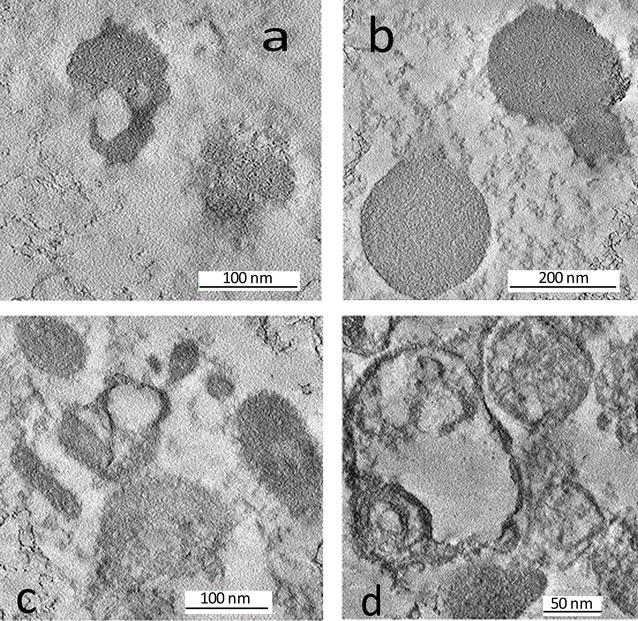
Figure 8.
Preparation of PMV in the supernatant of PC after removal of PLT using centrifugation at 800*g showing exosomes in slices of ET volumes (8a and 8b). The content of the vesicles is uniformly and fine-granulated, corresponding to their origin from PLT α-granules.
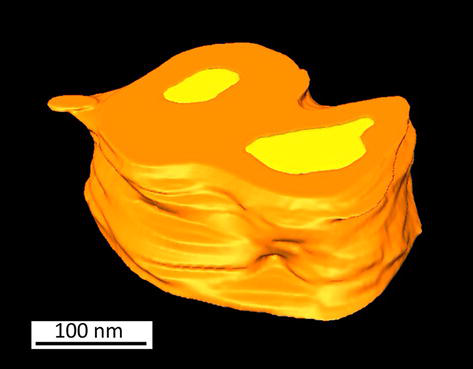
Figure 9.
Displays an ET model from an ectosome that can also watched as a movie. Video related to this figure.
5. Conclusion
Our investigations show that transmission electron microscopy represents a powerful tool for the visualization and enumeration of PMV. Above all, technical electron microscopical devices such as photomontage and ET are very helpful in this respect. The use of negative contrast of PMV preparations on filmed grids is a relatively simple way to have an overlook of the quality of PC processing.
Nevertheless, the analysis of PMV after preparation including enumeration as well as morphometry is very time-consuming, but in contrast to flow cytometric methods, showing dot plots which are to interpret, electron microscopy allows to check “what one sees.”
The visualization of PMV by using ET allows to understand the 3D structure of PMV. In this respect, the encapsulation in alginate beads is an easy nursing preparation method.
As already mentioned in an earlier book chapter [39], TEM and ET are appropriate supplementary methods to evaluate the quality of PLT in PC obtained by different manufacturing processes.
Acknowledgments
The authors gratefully acknowledge the provision of apheresis PCs by Mrs. Renate Renz (Blood Donation Center of the Austrian Red Cross for Vienna, Lower Austria, and Burgenland), the skillful technical assistance of Mr. Ulrich Kaindl and Mr. Thomas Nardelli for their valuable help with the artwork and the 3D modeling (Center for Anatomy and Cell Biology, Department of Cell and Development Biology, Medical University of Vienna).
Abbreviations
buffy coat | |
electron tomography | |
platelet concentrates | |
platelets | |
platelet microvesicles (platelet microparticles) | |
transmission electron microscopy | |
Transfusion-associated Lung Injury | |
Weighted Back Projection |
References
- 1.
Edelstein LC. The role of platelet microvesicles in intercellular communication. Platelets. 2017; 28 :222-227. DOI: 10.1080/09537104.2016.1257114 - 2.
Pasquet JM, Toti F, Nurden AT, Dachary-Prigent J. Procoagulant activity and active calpain in platelet-derived microparticles. Thrombosis Research. 1996; 82 :509-522. DOI: 10.1016/0049-3848(96)00101-6 - 3.
Morel O, Morel N, Freyssinet JM, Toti F. Platelet microparticles and vascular cells interactions: A checkpoint between the haemostatic and thrombotic responses. Platelets. 2008; 19 :9-23. DOI: 10.1080/09537100701817232 - 4.
Melki I, Tessandier N, Zufferey A, Boilard E. Platelet microvesicles in health and disease. Platelets. 2017; 28 :214-221. DOI: 10.1080/09537104.2016.1265924 - 5.
Cognasse F, Hamzeh-Cognasse H, Laradi S, Chou ML, Seghatchian J, Burnouf T, et al. The role of microparticles in inflammation and transfusion: A concise review. Transfusion and Apheresis Science. 2015; 53 (2):159-167. DOI: 10.1016/j.transci.2015.10.013 - 6.
Roka-Moiia Y, Ammann KR, Miller-Gutierrez S, Sheriff J, Bluestein D, Italiano JE, et al. Shear-mediated platelet microparticles demonstrate phenotypic heterogeneity as to morphology, receptor distribution, and hemostatic function. International Journal of Molecular Science. 2023; 24 (8):7386. DOI: 10.1101/2023.02.08.527675 - 7.
Xie RF, Hu P, Li W, Ren YN, Yang J, Yang YM, et al. The effect of platelet-derived microparticles in stored apheresis platelet concentrates on polymorphonuclear leucocyte respiratory burst. Vox Sanguinis. 2014; 106 (3):234-241. DOI: 10.1111/vox.12092 - 8.
Boilard E, Duchez AC, Brisson A. The diversity of platelet microparticles. Current Opinion in Hematology. 2015; 22 :437-444. DOI: 10.1097/MOH.0000000000000166 - 9.
Mobarrez F, Antovic J, Egberg N, Hansson M, Jorneskog G, Hultenby K, et al. A multicolor flow cytometric assay for measurement of platelet-derived microparticles. Thrombosis Research. 2010; 125 :e110-e116. DOI: 10.1016/j.thromres.2009.10.006 - 10.
Nielsen MH, Beck-Nielsen H, Andersen MN, Handberg A. A flow cytometric method for characterization of circulating cell-derived microparticles in plasma. Journal of Extracellular Vesicles. 2014; 3 :1-12. DOI: 10.3402/jev.v3.20795 - 11.
Black A, Pienimaeki-Roemer A, Kenyon O, Orso E, Schmitz G. Platelet-derived extracellular vesicles in plateletpheresis concentrates as a quality control approach. Transfusion. 2015; 55 :2184-2196. DOI: 10.1111/trf.13128 - 12.
Nolan JP, Jones JC. Detection of platelet vesicles by flow cytometry. Platelets. 2017; 28 :256-262. DOI: 10.1080/09537104.2017.1280602 - 13.
Stoner SA, Duggan E, Condello D, Guerrero A, Turk JR, Narayanan PK, et al. High sensitivity flow cytometry of membrane vesicles. Cytometry. Part A. 2016; 89 :196-206. DOI: 10.1002/cyto.a.22787 - 14.
Shao H, Im H, Castro CM, Breakefield X, Weissleder R, Lee H. New technologies for analysis of extracellular vesicles. Chemical Reviews. 2018; 118 (4):1917-1950. DOI: 10.1021/acs.chemrev.7b00534 - 15.
Rebulla P. Trigger for platelet transfusion. Vox Sanguinis. 2000; 78 (Suppl. 2):179-182 - 16.
Rebulla P. Revisitation of the clinical indications for the transfusion of platelet concentrates. Reviews in Clinical and Experimental Hematology. 2001; 5 (3):288-310. DOI: 10.1046/j.1468-0734.2001.00042.x - 17.
Giannini EG, Peck-Radosavljevic M. Platelet dysfunction: Status of thrombopoietin in thrombocytopenia associated with chronic liver failure. Seminars in Thrombosis and Hemostasis. 2015; 41 (5):455-461. DOI: 10.1055/s-0035-1550432 - 18.
Tsai FD, Battinelli EM. Inherited platelet disorders. Hematology/Oncology Clinics of North America. 2021; 35 (6):1069-1084. DOI: 10.1016/j.hoc.2021.07.003 - 19.
Levi M, Sivapalaratnam S. Disseminated intravascular coagulation: an update on pathogenesis and diagnosis. Expert Review of Hematology. 2018; 11 (8):663-672. DOI: 10.1080/17474086.2018.1500173 - 20.
Kvolik S, Jukic M, Matijevic M, Marjanovic K, Glavas-Obrovac L. An overview of coagulation disorders in cancer patients. Surgical Oncology. 2010; 19 (1):33-46. DOI: 10.1016/j.suronc.2009.03.008 - 21.
Franchini M, Veneri D, Lippi G. Thrombocytopenia and infections. Expert Review of Hematology. 2017; 10 (1):99-106. DOI: 10.1080/17474086.2017.1271319 - 22.
Hrachovinová I. Diagnostic strategies in disorders of hemostasis. Vnitr̆ní Lékar̆ství. 2018; 64 (5):537-544 - 23.
Krishnegowda M, Rajashekaraiah V. Platelet disorders: An overview. Blood Coagulation & Fibrinolysis. 2015; 26 (5):479-491. DOI: 10.1097/01.mbc.0000469521.23628.2d - 24.
Laurencet FM, Doucet A, Lydiate V, Jacquier MC, Mermillod B, Andersen S, et al. Quality evaluation of plateletpheresis using the new AMICUS (Baxter) cell separator: Evolution of CD 62 expression. Journal of Clinical Apheresis. 1998; 13 (2):47-55. DOI: 10.1002/(sici)1098-1101(1998)13:2<47::aid-jca1>3.0.co;2-8 - 25.
Working with Haemonetics MCS®+. Operation manual [Internet]. 2006. Available from: http://www.frankshospitalworkshop.com/equipment/documents/automated_analyzer/user_manuals/Haemonetics%20MCS+%20Analyzer%20-%20User%20manual.pdf - 26.
Neumüller J, Meisslitzer-Ruppitsch C, Ellinger A, Pavelka M, Jungbauer C, Renz R, et al. Monitoring of platelet activation in platelet concentrates using transmission electron microscopy. Transfusion Medicine and Hemotherapy. 2013; 40 (2):101-107. DOI: 10.1159/000350034 - 27.
Pelletier JP, Transue S, Snyder EL. Pathogen inactivation techniques. Best Practice & Research. Clinical Haematology. 2006; 19 (1):205-242. DOI: 10.1016/j.beha.2005.04.001 - 28.
Azuma H, Hirayama J, Akino M, Ikeda H. Platelet additive solution – Electrolytes. Transfusion and Apheresis Science. 2011; 44 (3):277-281. DOI: 10.1016/j.transci.2011.03.002 - 29.
Hacker C, Asadi J, Pliotas C, Ferguson S, Sherry L, Marius P, et al. Nanoparticle suspensions enclosed in methylcellulose: A new approach for quantifying nanoparticles in transmission electron microscopy. Scientific Reports. 2016; 4 (6):25275. DOI: 10.1038/srep25275 - 30.
Brisson AR, Tan S, Linares R, Gounou C, Arraud N. Extracellular vesicles from activated platelets: a semiquantitative cryo-electron microscopy and immuno-gold labeling study. Platelets. 2017; 28 (3):263-271. DOI: 10.1080/09537104.2016.1268255 - 31.
Ponomareva AA, Nevzorova TA, Mordakhanova ER, Andrianova IA, Rauova L, Litvinov RI, et al. Intracellular origin and ultrastructure of platelet-derived microparticles. Journal of Thrombosis and Haemostasis. 2017; 15 (8):1655-1667. DOI: 10.1111/jth.13745 - 32.
Hermida-Nogueira L, García Á. Extracellular vesicles in the transfusion medicine field: The potential of proteomics. Proteomics. 2021; 21 (13-14):e2000089. DOI: 10.1002/pmic.202000089 - 33.
Théry C, Amigorena S, Raposo G, Clayton A. Isolation and characterization of exosomes from cell culture supernatants and biological fluids. Current Protocol Cell Biology. 2006; 30 (1), UNIT 3.22: 1-29. DOI: 10.1002/0471143030.cb0322s30 - 34.
Corona ML, Hurbain I, Raposo G, van Niel G. Characterization of extracellular vesicles by transmission electron microscopy and immunolabeling electron microscopy. Methods in Molecular Biology. 2023; 2668 :33-43. DOI: 10.1007/978-1-0716-3203-1_4 - 35.
Schrezenmeier H, Seifried E. Buffy-coat-derived pooled platelet concentrates and apheresis platelet concentrates: which product type should be preferred? Vox Sanguinis. 2010; 99 (1):1-15. DOI: 10.1111/j.1423-0410.2009.01295.x - 36.
van der Meer PF. Platelet concentrates, from whole blood or collected by apheresis? Transfusion and Apheresis Science. 2013; 48 (2):129-131. DOI: 10.1016/j.transci.2013.02.004 - 37.
Fiedler SA, Boller K, Junker AC, Kamp C, Hilger A, Schwarz W, et al. Evaluation of the in vitro function of platelet concentrates from pooled buffy coats or apheresis. Transfusion Medicine and Hemotherapy. 2020; 47 (4):314-324. DOI: 10.1159/000504917 - 38.
Ng MSY, Tung JP, Fraser JF. Platelet storage lesions: What more do we know now? Transfusion Medicine Reviews. 2018; 17 :S0887-7963. DOI: 10.1016/j.tmrv.2018.04.001 - 39.
Neumüller J, Elllinger A, Wagner T. Transmission electron microscopy of platelets from apheresis and buffy-coat-derived platelet concentrates. In: Maaz K, editor. The Transmission Electron Microscope. London, UK, London, UK: IntechOpen Book; 2015. pp. 255-284. DOI: 10.5772/60673 - 40.
Neumüller J. Electron tomography-a tool for ultrastructural 3D visualization in cell biology and histology. Wiener Medizinische Wochenschrift (1946). 2018; 168 (11-12):322-329. DOI: 10.1007/s10354-018-0646-y - 41.
Neumüller J, Wagner T. Electron tomography contributing to ultrastructural research in vascular biology and transfusion medicine. Journal of Cardiology and Cardiovascular Sciences. 2019; 3 (1):4-10. DOI: 10.29245/2578-3025/2019/1.1165