
Abstract
Since its inception, retinal imaging has been vital in documenting and understanding macular diseases. The early thinking was to document retinal pathology as it became possible to visualize the retina using an ophthalmoscope. This reasoning quickly evolved into the need to monitor disease evolution and treatment changes using digital images. With further rapid advancement in imaging technology, it has become possible to visualize and image at a subcellular level, the macula, in health and disease. Technological advances have resulted in the scanning laser ophthalmoscope, optical coherence tomography, and adaptive optics incorporation into imaging. The “dye” and “non-dye” based evaluation of retinal vasculature has improved our understanding of various macula and retinovascular diseases. The fundus photograph and optical coherence tomography are the most utilized technologies for imaging the macula. With an expected increase in diabetic retinopathy and macular degeneration patients, more macular imaging will be done in years to come. Consequently, more macula image data will be available for data analysis using artificial intelligence, improving our predictive ability and personalization. Therefore, macular imaging will assume increasing significance and imaging techniques for the macula should be known and understood. This chapter provides an exhaustive list of common and less-known imaging techniques for macular imaging and an overview of their use in evaluating the macula in clinical practice and research.
Keywords
- macula
- macular imaging
- color fundus photography
- optical coherence tomography
- optical coherence tomography angiography
- scan laser ophthalmoscopy
- adaptive optics
- multimodal imaging
- artificial intelligence
1. Introduction
Retina and macula imaging have come a long way. From the early years after the invention of the ophthalmoscope in 1850, through the introduction of the slit-lamp biomicroscope in 1921, combined with the use of Leonhard Koeppe’s contact lens affording the stereoscopic examination of the vitreous and retina with X40 magnification, several outstanding contributions have been made by clinicians and scientist [1, 2]. This effort is driven by a desire to see more, understand the retina’s anatomy and physiology, and document the disease’s evolution. After ophthalmoscopy, the first photograph of the animal eye was in 1886. The first clinical use of the fundus camera was born by a collaboration between Swedish Dr. Johan Wilhelm Nordenson and the German Zeiss company. This collaboration led to the Zeiss-Nordenson camera, which became the prototype for subsequent retinal cameras [3, 4].
Since the introduction of the early retina camera, digitizing images in the 1980s, and incorporating cutting-edge technologies, including improvements in lighting (such as monochromatic light), vital stains, fluorescent dyes, filters, image resolution, have significantly improved retina and macular imaging [2, 5]. The introduction of these technologies has made retinal imaging invaluable in the clinical assessment of diverse retina and macula pathologies, understanding and documentation of retinal pathoanatomy and physiology, teaching, and research. Advances in macular imaging in the past two decades have been phenomenal. Macular imaging has witnessed the development of high-impact and high-resolution imaging, including optical coherence tomography (OCT). Because of the development of OCT into faster scanning speed equipment, OCT Angiography (OCTA) has become a reality. OCTA will evolve into wide-field imaging with a further increase in scanning speed. More recently, analytics of retinal imaging have become faster and more dynamic, resulting in the ability to prognosticate. Artificial intelligence (AI) incorporation into image analytics means more robust data reviews utilizing large amounts of image data, which can show trends, prognosticate outcomes, and guide management. Personalization of patient care is the ultimate goal of image analytics. This review focuses on macular imaging, intending to provide a comprehensive, updated review of the technology used for imaging macular diseases, including commonly encountered diseases like age-related macular degeneration (AMD), diabetic macular edema (DME), retinal vein occlusion (RVO), central serous chorioretinopathy (CSCR), polypoidal choroidal vasculopathy (PCV), and disorders characterized by macular ischemia and others. OCT and OCTA feature prominently, including their biomarkers, which have become a focus of AI analytics. Functional imaging of the macula and less-known imaging modalities, including macula pigment optical density (MPOD), photoacoustic microscopy (PAM), and fluorescence lifetime imaging ophthalmoscopy (FLIO), are also discussed in this chapter.
2. Color fundus photography
Fundus images obtained by fundus cameras date to the late nineteenth century, and modern fundus photographs were reported by Friedrich Dimmer in the early twentieth century [6]. Dimmer is credited with the first reflex-free photographs of the fundus in 1905. The quality of fundus images and the ease of photography have significantly improved over the years, producing digitized images with computer-based storage. Fundus imaging generates a two-dimensional image of the interior three-dimensional surface of the eye. Fundus imaging uses a specialized low-power microscope and an attached camera [7].
Standard fundus photography provides a 30- to 50-degree image that includes the macula and peripheral retina. Ultrawide field (UWF) imaging can produce a 200-degree retinal view extending beyond the macula to the peripheral retina [8]. In some cases, evaluation of the retina periphery through retina imaging can have significant implications for macular diseases, such as the clinical scenario of persistent or recurrent diabetic macular edema. UWF imaging using fluorescein dye evaluation could reveal peripheral nonperfusion as the cause of lingering macular edema. The retina examination is done in full color with white light illumination. The white light can be filtered, removing the red component, and in this way, a red-free image can be created. This red-free image results in improved contrast of retinal and choroidal blood vessels [9].
Fundus photography helps diagnose and monitor macular diseases, for example, AMD, polypoidal choroidal vasculopathy, and diabetic maculopathy; it is also helpful in educating and counseling patients [10]. There are some disadvantages, including the image created being in 2D, lack of depth, visualizing small details may be problematic, and abnormalities in the refractive media, such as cataracts, resulting in lower image clarity [11]. Figures 1 and 2 illustrate the resolution of subretinal exudates after intravitreal injection of anti-vascular endothelial growth factors in a PCV right eye. The fellow eye (Figure 3) shows a similar reddish-orange subretinal PCV lesion.

Figure 1.
Right eye fundus photograph showing temporal macular subretinal exudates and reddish-orange polypoidal lesion nasal to the fovea in an eye diagnosed with polypoidal choroidal vasculopathy.

Figure 2.
Same eye as in

Figure 3.
The fellow left eye of the image in
Drusen often changes in size and number over time; computer image analysis of fundus photographs is used to measure the drusen area and monitor the changes in drusen pattern over time [12]. The fundus photograph helps monitor changes in the degree of a disease over time or in response to therapy. Progression of clinical retina findings can be easily determined. Figure 4 illustrates the accumulation of drusenoid deposits in the macula of an elderly female. Fundus photographs are used with optical coherence tomography, seen in Figure 5, to assess Drusen.
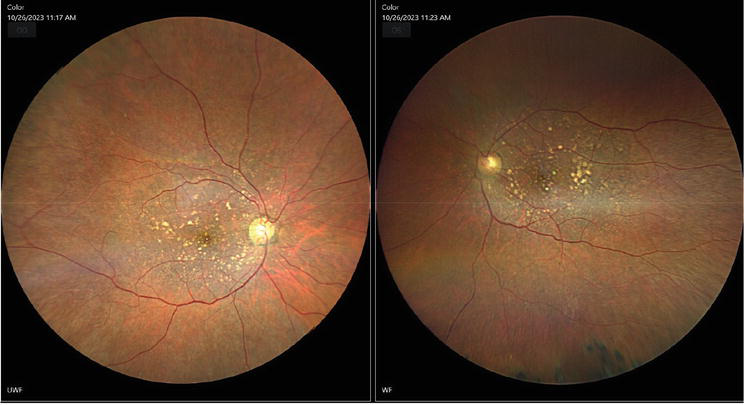
Figure 4.
The right and left fundus images of an 81-year-old female, with characteristic discrete yellowish flecks in the macula, which are macular drusen deposits.

Figure 5.
Optical coherence tomography images of the same patient in
In 2010, the first report on the use of smartphones for retinal imaging was published [13]. The principles of the indirect ophthalmoscope apply to smartphone fundus photography using a 20D condensing lens. Smartphone photography is convenient because of its portability and cost-effectiveness [14]. It is utilized for documentation, screening, and monitoring the progression of macular diseases, for example, diabetic macular edema and age-related macular degeneration [15]. Other portable, handheld photographic devices have been used for imaging the macula and are helpful in remote screening of diabetic retinopathy eyes. The Welch Allyn iExaminer System can be attached to an Apple iPhone 4/4S and has gained FDA approval as an ophthalmoscope for mobile phones [16]. The disadvantages of handheld devices to conventional color photographs include a narrower field of view, reduced image quality, lower illumination, and reduced image contrast.
Advancements in electronic media have increased the importance of macular imaging using fundus photographs, which can aid disease evaluation and diagnosis through “teleophthalmology” [15]. In the future, patients will be able to send macular images to control centers without the need for physical attendance at a screening venue.
Biomarkers can be identified from macular imaging. These could be biomarkers of systemic or more generalized disease and ocular disease. For example, arterial width, arterial angle, venous angle, and fractal dimensions, reflective of arteriosclerosis present in the retinal vasculature, could be a potential biomarker for atherosclerosis in the coronary artery [17]. Deep learning algorithms have been developed for predicting age, sex, and cardiovascular disease using retinal biomarkers [18, 19]. In the case of ocular diseases, the findings of microaneurysm, retinal hemorrhage, hard exudates, and cotton-wool spots are biomarkers of retinovascular disease, which can be imaged, segmented, and analyzed using computer analytics for disease management [16]. Figures 6 and 7 are representative fundus images that contain leakage of hard exudates and serosanguinous material into the retina. Figure 8 depicts features of non-proliferative diabetic retinopathy, including macular hemorrhages, hard exudates, and microaneurysms. Figure 9 shows significant macular hard exudates and hemorrhages. In Figures 10 and 11, there is neovascularization of the disk and retina, respectively.

Figure 6.
Hard exudates and hemorrhage in the right eye macula of an eye diagnosed with exudative age-related macular degeneration. There are pigmentary changes with hyper- and hypo-pigmented spots spread over the macula.

Figure 7.
Large area of serosanguinous leakage into the macula (yellow dash arrow).

Figure 8.
Left eye macula hemorrhages, microaneurysms, and hard exudates in an eye diagnosed with non-proliferative diabetic retinopathy.

Figure 9.
Widespread macula hard exudates, hemorrhages, and vitreous opacities in diabetic macular edema.

Figure 10.
Right eye disk neovascularization from proliferative diabetic retinopathy. Macular exudates are also seen.

Figure 11.
Left eye retinal neovascularization along the superotemporal arcade secondary to proliferative diabetic retinopathy.
3. Stereoscopic photography
A stereo image is produced by taking photographs of the same scene from two slightly different positions so that the viewer fuses the images and obtains a three-dimensional reconstruction of the image. It is less practiced in the clinics [20]. Two photographs from slightly different viewpoints of the object are acquired to obtain any stereoscopic photography. Then, present these right and left images to the right and left eyes of the observer utilizing a stereo viewer. To obtain stereoscopic retina images, the retina camera begins in the same position used for single fundus photography. Then shifted, first to the left and then 3–4 mm to the right. Digital images are taken and saved, and the software incorporated into the camera enables viewing of the stereo pair. The right and left images are presented on the viewing monitor. A pair of viewing glasses should be used to merge the two images [21].
Stereoscopic fundus photography’s advantage compared to conventional photography is its ability to image the depth of the retina. The usefulness of stereo viewing can be seen in diabetic retinopathy, where it can help differentiate raised retinal neovascularization from the typically flat intraretinal microvascular anomaly. Figure 10 shows disk neovascularization and exudative maculopathy, and Figure 11 neovascularization on the retina, using conventional photography, both occurring from proliferative diabetic retinopathy. Stereoscopic imaging better appreciates the raised nature of this neovascularization. However, a comparative study of monoscopic and stereoscopic fundus photography found no difference in the ability of an ophthalmologist to evaluate diabetic retinopathy’s severity using the criteria established by the early treatment of diabetic retinopathy study (ETDRS) [22].
4. Fundus autofluorescence (FAF)
This noninvasive imaging technique relies on detecting fluorophores, which occur naturally and absorb and emit light of specific wavelengths [23]. Intravenously injected agents are not required for FAF imaging. It is dependent on intrinsic molecules present in the eye. FAF also differs from angiography in that the FAF signal intensity is much weaker at approximately two orders of magnitude lower than the fluorescein angiogram’s background intensity during the most intense part of the dye transit [23].
To generate autofluorescence, a fluorophore will absorb a photon of the excitatory wavelength that elevates an electron to an excited, high-energy state. The electron then dissipates some energy through molecular collisions, emitting light with lower energy and longer wavelength as it transitions to the ground state [24]. FAF’s image signal intensity depends on lipofuscin concentration and, to a minor degree, other fluorophores. Lesions can be categorized as hyper-auto, hypo-auto, or iso-auto fluorescent [24].
FAF can be used in the evaluation of age-related macular degeneration, diabetic macular edema, central serous chorioretinopathy, macular dystrophies, acute exudative polymorphous vitelliform choroidal dystrophy, macular telangiectasia, pentosan maculopathy, and hydroxychloroquine toxicity [24, 25, 26].
Several FAF patterns have been described in AMD. Drusen may have normal, hyper-, or hypo-autofluorescent patterns on fundus autofluorescence imaging [27]. A hyper-autofluorescent appearance can be seen due to lipofuscin within the drusen or in the RPE overlying the drusen, and a hypo-autofluorescent appearance is caused by regressed drusen or degenerated RPE cells. Large, soft drusen typically display relatively well-defined hyper-autofluorescence [27]. Drusenoid pigment epithelial detachments display a patchy pattern of hyper- and hypo-autofluorescence [28].
The International Fundus Autofluorescence Classification Group (IFAG) described a classification scheme for a range of distinct fundus autofluorescence patterns associated with early and intermediate AMD, including normal, minimal change, focal increased, patchy, linear, lace-like, reticular, or speckled [29].
FAF is especially valuable in detecting, evaluating, and monitoring geographic atrophy, used as an endpoint in clinical trials [29]. In neovascular AMD, FAF reveals distinct patterns of classic choroidal neovascularization noninvasively and may be especially useful for determining which eyes are likely to benefit from therapeutic intervention [29]. The spectrum of FAF imaging has been expanded with the increasing use of green in addition to blue FAF and the introduction of spectrally resolved FAF, near-infrared FAF, quantitative FAF imaging, and fluorescence lifetime imaging (FLIO) [30].
Figures 12–15 are the multimodal imaging of bilateral active peripapillary choroidal neovascular membrane with exudation and scarring involving the macula. Figure 12 (fundus photography), Figure 13 (fluorescein angiography), Figure 14 (fundus autofluorescence-green), and Figure 15 (optical coherence tomography angiography – montage) show the same pathology utilizing different imaging techniques.

Figure 12.
Right eye and left eye fundus photograph of a middle-aged female. Macular imaging shows peripapillary neovascularization, with leakage and scarring, more pronounced and involving the fovea in the left eye.

Figure 13.
Fluorescein angiography of the same eyes in

Figure 14.
Fundus auto fluorescence of the same eye in

Figure 15.
Right and left eye optical coherence tomography angiography (OCTA). The right eye demonstrates a temporal peripapillary network of blood vessels (blue arrow), that is missing in the left eye (blue arrow) because access to the left eye temporal peripapillary area is restricted by the presence of scar tissue.
5. Scanning laser ophthalmoscopy (SLO), including retromode imaging
The SLO gives high-quality retina images utilizing a small fraction of light used for conventional indirect ophthalmoscopy [31]. It is light, efficient imaging. The SLO utilizes the ophthalmoscopic principle in which a dim laser beam scans across the fundus, and reflected light is collected only from one retinal point at a time. Because the SLO illuminates only a single retinal point at a time, only 0.9 mm of the patient’s pupil (the diameter of the laser beam) is used for illumination, and the rest is available for light collection. This makes the SLO a very light-efficient instrument. Because of SLO’s light efficiency, illumination levels are comfortable for the patient, and fundus fluorescein angiography can be performed with about a tenth of the fluorescein dye dose [31]. The confocal scanning laser ophthalmoscopy (e.g., Heidelberg retina tomograph, HRT) is famous for examining macular structures in several macular diseases [32]. It offers a three-dimensional analysis of the macula and gives a retinal map. It has been used to evaluate diabetic macular edema and macular edema from branch retinal vein occlusion, age-related macular degeneration, and idiopathic macular holes [33].
SLO’s clinical applications, image contrast, and axial resolution are determined by an aperture overlying its photodetector. In high contrast, reflectance images are produced using small-diameter, centered apertures (confocal apertures) that collect retroreflections and reject side-scattered veiling light returned from the fundus. Retro illumination images are obtained with annular on-axis or laterally displaced off-axis apertures that capture scattered light and reject the retroreflected light used for reflectance imaging. Retro illumination highlights and shades the boundaries of chorioretinal tissues and abnormalities, facilitating small drusen detection, subretinal drusenoid deposits, and subthreshold laser lesions. It also facilitates screening for large area chorioretinal irregularities not readily identified with other enface retinal imaging modalities [34, 35, 36].
6. Multicolor imaging (MCI)
MCI uses the confocal scanning laser ophthalmoscopy (CSLO) to capture three simultaneous reflectance images using three monochromatic laser sources: (1) blue reflectance (BR; 488 nm), (2) green reflectance (GR; 515 nm), and (3) infrared reflectance (IR; 820 nm). These different wavelengths of light can penetrate the different retinal surfaces at diverse depths to show details of the retinal layers. The BR mainly enables the visualization of the inner retina and the vitreoretinal interface, including epiretinal membrane (ERM), retinal nerve fiber layer thinning, and macular pigment changes. GR images allow visualization of deeper details, such as retinal blood vessels and intraretinal lipid exudation. IR predominantly visualizes structures at the outer retina and choroid level, including drusen and retinal pigmentary epithelium alterations [34].
Compared to color fundus photography, which requires a bright flash of light to capture images, single-wavelength small laser spots are used in multicolor imaging, which may cause less photophobia. A disadvantage of multicolor imaging compared to conventional color fundus photography is that multicolor imaging may require a slightly more extended fixation period to take the three separate images compared to color fundus photography [37]. Multicolor imaging has been used to evaluate AMD, macular edema from retinal vein occlusion, central serous chorioretinopathy (CSCR), and inherited macular dystrophies [37].
7. Fundus fluorescein angiography (FFA)
FFA evaluates retinal and choroidal circulation’s anatomy, physiology, and pathology [38]. It involves the intravenous injection of fluorescein sodium, a noniodinated contrast agent, followed by serial photographs to visualize the patency and permeability of the retinal vessels.
Sodium fluorescein molecules emit green light (wavelength of 520–530 nm) when stimulated by blue light (wavelength of 465–490 nm). Two filters are needed to perform FFA: a blue filter excites to produce fluorescence, and a green filter absorbs the green fluorescence and blocks the reflected blue light [38]. Sixty percent of sodium fluorescein is bound to plasma proteins, mainly to albumin. The free dye passes readily across systemic capillaries to the tissues. Retinal capillaries usually do not leak fluorescein dye. A loss of the blood-retinal barrier integrity (either of the retinal vessel endothelial cells or the RPE) allows free fluorescein leakage into the extracellular spaces of the surrounding neurosensory retina. Neovascularization in the retina, choroid, and iris leak fluorescein profusely [38].
There are five phases in FFA: choroidal, arterial, arteriovenous, venous, and recirculation [39]. Hypofluorescence appears as a reduction from the normal expected fluorescence, and hyperfluorescence implies an increased or abnormal fluorescence. Hyperfluorescence can be from dye leakage, staining, pooling, or transmission defects, and hypofluorescence is due to a blocking effect or a vascular filling defect [39]. Figure 16a and b show the fundus photograph and fluorescein angiography of central retinal vein occlusion with disk edema seen as hyperfluorescence from leakage on angiography and blocked fluorescence from the retina hemorrhages, respectively.

Figure 16.
a and b: Right eye central retinal vein occlusion; wide-field fundus photograph and corresponding fundus fluorescein angiography.
Geographic atrophy typically shows late, well-defined hyperfluorescence from the exposed deep choroid and sclera staining [40]. Classic choroidal neovascularization (CNV) is characterized by well-demarcated hyperfluorescence in the early phases of FA and late leakage that obscures the boundaries of the lesion [41]. Angiographically, the disciform scar shows late staining [40].
FFA is beneficial in evaluating macular edema, age-related macular degeneration, central serous chorioretinopathy, and inherited macular dystrophies [42, 43]. The standard fundus camera captures images of 30–50 degrees of the retina; however, wide-field imaging efficiently assesses peripheral vascular leakage, peripheral vascular loops, and capillary nonperfusion areas present in retinal vein occlusion, proliferative sickle cell retinopathy and diabetic retinopathy [44].
8. Indocyanine green angiography (ICGA)
Indocyanine green angiography (ICGA) is used to image choroidal circulation and its abnormalities [45]. ICGA uses indocyanine green dye, a high-molecular-weight contrast (775 kD), and projects 790 nm infrared light into the eye, allowing deep RPE penetration [46]. The dye used in ICGA binds to plasma proteins and thus leaks less compared to fluorescein dye used in FFA imaging. The ICGA leakage, then reabsorbed, produces hyper cyanescent in the late phase [47]. ICGA has three phases: early, mid, and late. Indications for ICGA include exudative age-related macular degeneration, idiopathic polypoidal choroidal vasculopathy, and central serous chorioretinopathy [48].
ICGA has been used to highlight the polyps and branching vascular network (BVN) present in polypoidal choroidal vasculopathy (PCV) and choroidal neovascular membrane present in exudative age-related macular degeneration, myopia, and other causes [49, 50, 51]. Often, ICGA is unavailable, so other imaging techniques, including the B-mode OCT scan, can be used as an alternative for polyp detection in PCV [50]. Figure 17 shows the OCT angiography, enface, and cross-sectional OCT images of an eye diagnosed with polypoidal choroidal vasculopathy and polypoidal lesions. A broad pigment epithelial detachment can be seen on cross-sectional OCT of the polyp harboring area.

Figure 17.
Optical coherence tomography angiography (OCTA) of the left eye (fundus photography shown in
9. Retinal thickness analyzer (RTA)
The retinal thickness analyzer (RTA) is an automated, computerized slit-lamp biomicroscopic system. It utilizes a green (543 nm) He-Ne laser as a slit beam and provides optical cross sections of the retina. In the macula, the optical cross sections reveal retinal structural changes that are analyzed to generate two- and three-dimensional quantitative retinal thickness maps. The retinal thickness maps are obtained, like those obtained using the SLO and OCT. The RTA is error-prone, and the presence of retinopathy (edema) tends to cause false-positive readings [52]. RTA is not suitable for difficult reading situations since it is prone to erroneous or missing thickness readings under such conditions [53]. The OCT may be superior to the RTA in such situations.
10. B-mode ultrasonography
The ultrasound is a clinically useful imaging modality for the macula in conditions with a media opacity or unclear media. High-frequency ultrasound waves passing from the transducer to ocular tissue are transmitted back to the probe. Depending on the time and amplitude of the returning sound wave, which reflects the tissue density, the signal is summed to form a two-dimensional image of the eye. The more echogenic the appearance of the scanned image, the higher the amplitude of the detected signal and the higher the tissue density. A dense white appearance reflects echogenicity.
A B-scan has been used to detect macular thickening, and its sensitivity and specificity were determined. Ultrasonographic detection of macular thickening has been found to correlate with findings on retina examination using slit-lamp biomicroscopy, FFA, and OCT. B-scan ultrasonography has been described as a valuable technique for assessing macular thickness when biomicroscopy is impossible or when patients cannot tolerate alternatives, that is, FA or OCT [54].
11. Optical coherence tomography (OCT) and optical coherence tomography angiography (OCTA)
11.1 Optical coherence tomography (OCT)
Optical coherence tomography (OCT) is a non-contact, noninvasive ophthalmic imaging test [55]. The OCT uses the principle of light waves, which is based on the ability of ocular tissues to reflect and backscatter light involving low-coherence interferometry [56]. It provides a high-depth, resolution, cross-sectional image of the retina, enabling quantitative (mapping, volume, and thickness) evaluation of the retinal thickness and assessing qualitative (morphology and reflectivity) anatomic changes [56, 57].
OCT of the macular is used for the detection and monitoring of a diverse range of diseases affecting the macula, such as macular edema, macular holes, pseudo holes, epiretinal membranes (ERMs), vitreomacular adhesion (VMA), and vitreomacular traction (VMT)[55, 56]. Figure 18 illustrates the usefulness of OCT in the evaluation of vitreomacular interface disorder. Figure 18 is a full-thickness macular hole revealing basal and minimum diameters and a posterior vitreous detachment. Retinoschisis, as well as detachments of the neurosensory retina and pigment epithelium, diabetic retinopathy (DR), and drusen in age-related macular degeneration, can be detected by OCT [55, 56].

Figure 18.
A macular hole seen as full-thickness macular defect with detachment of the posterior hyaloid. There are intraretinal cystic spaces in the perifoveal retina. It is possible to measure the outer diameter and inner (minimum) diameter of the macular hole accurately. Macular holes can be closed effectively using surgical techniques. The choice of surgical technique to use and prognosis can be determined by the measurement of the macular hole size (diameter), provided by the OCT.
Macular OCT application can be broadly divided into localizing pathologies in the intraretinal, subretinal, and sub-RPE space. Intraretinal fluid collection is seen as retinal edema (focal or diffuse), cystoid edema, cysts, microcysts, and impending macular holes [56]. Subretinal fluid collection is typically seen in central serous chorioretinopathy (CSCR); here, the serous fluid causes elevation of the sensory retina [56].
Regular posterior segment ocular tissues are identified and localized due to their reflective properties [56]. Structures such as the internal limiting membrane, retinal nerve fiber layer, inner and outer plexiform layers are hyperreflective in nature; layers of the outer retina such as the external limiting membrane, the inner and outer segments junction of the photoreceptor, and the retinal pigment epithelium-Bruch’s membrane-choriocapillaris complex also exhibits high reflectivity [56]. Hyperreflectivity is also a feature of reduced retinal thickness (as in retinal atrophy) and scar tissue. Normal retinal tissues that are hyporeflective include the ganglion cell layer and the outer and inner nuclear layers. Retinal lesions that cause low or hyporeflectivity include cystic or pseudo cystic areas containing a serous fluid, atrophic RPE (loss of pigment), cystoid edema, serous neural retinal detachment, and RPE detachment. Such lesions appear as black, optically empty spaces.
In clinical practice, retino-vascular diseases and AMD biomarkers are sought to correlate visual function, predict treatment response, and forecast prognosis. These are useful in the decision to commence treatment or during treatment [55, 58, 59].
A biomarker is a measurable biological parameter evaluated and measured to indicate processes that can be normal biological processes, pathogenic processes, or some pharmacologic responses to a therapeutic intervention [55, 60]. Retinal OCT biomarkers are classified into seven categories, which are susceptibility or risk, diagnostic, monitoring, prognostic, predictive, pharmacodynamic or response, and safety [55]. Commonly used retinal OCT imaging biomarkers include central subfield thickness (CST) (which is the most popular), the junction in between the photoreceptor inner and outer segments (IS/OS) or ellipsoid zone (EZ), intraretinal fluid (IRF), subretinal fluid (SRF), subretinal hyperreflective material (SHRM), disorganization of retinal inner layers (DRIL), pigment epithelial detachment (PED), retinal pigmental epithelial (RPE) atrophy, outer retinal tubulation (ORT), hyperreflective foci (HRF), drusen type, subretinal drusenoid deposits (SDD), double-layer sign (DLS), incomplete retinal pigment epithelium (RPE) and outer retinal atrophy (iRORA), complete retinal pigment epithelium (RPE), and outer retinal atrophy (cRORA) [55].
11.2 Macular OCT biomarkers indicative of disease
11.2.1 Central subfield thickness (CST)
The OCT immediately measures the circular 1 mm diameter area surrounding the fovea’s center point, taking its reading from the internal limiting membrane to the RPE [58, 59]. The CST is provided as a quantifiable value on OCT software [58]. This measurement gives an unbiased reading of the macular thickness. An increase in CST plays a significant role in macular edema, commonly seen in diseases such as diabetic macular edema (DME), retinal vein occlusion (RVO), nAMD, and non-infectious uveitis (NIU).[55, 58] CST became one of the earliest OCT biomarkers implemented as an outcome measure in clinical trials of nAMD. CST measurement has been used to evaluate treatment outcomes, retreatment time, and overall clinical decision-making [59]. Fluid in the retina reflects disease activity and manifests as increased CST on OCT. Nevertheless, increased CST seen on OCT does not indicate the location of the fluid within the retina, which can be of visual prognostic value [55]. Various studies on DME, RVO-related macular edema, and macular edema in NIU have shown that there is only a modest or negative correlation between best-corrected visual acuity (BCVA) and CST [58]. However, large nAMD clinical trials, such as the PrONTO and SUSTAIN studies, showed that BCVA improvement correlated with the decreases in the mean CST [59]. Fluid located within the substance of the retina is referred to as intraretinal fluid (IRF); when the fluid is located between the neurosensory retina and RPE, it is termed subretinal fluid (SRF), while fluid located underneath the retinal pigment epithelium is referred to as sub-RPE, this is seen as pigment epithelial detachment (PED) [55]. Intraretinal cysts (IRC)/intraretinal fluid (IRF) at baseline and during anti-VEGF treatment are associated with poor visual outcomes [61]. SRF is more tolerated, described as being protective of vision, and is associated with better visual outcomes [55]. SRF may protect the retina from atrophy. For the above reason, CST is not a good predictor of baseline or final vision after anti-VEGF treatment, as this depends on the compartmentalization of the fluid rather than the overall central retina thickness [55].
11.2.2 Retinal structural alterations
The outer retina has four layers, which include the external limiting membrane (ELM), ellipsoid zone (EZ), [ELM and EZ represents the photoreceptor layer], interdigitation zone (IZ), and RPE. Damage to any of the outer retinal layers (ORL) has been correlated with worsening vision due to the associated photoreceptor defects [62]. Outer retinal layer integrity and presence on initial OCT evaluation for several retinal diseases, including nAMD, is associated with better pretreatment vision [55]. Likewise, the reconstitution of the outer retina after treating these retinal diseases has been correlated with improved visual outcomes [55]. Early treatment of retinal fluid with intravitreal anti-VEGF often results in the return or preservation of the ORL following fluid resolution. Ellipsoid zone alterations severely reduce retinal function. At the same time, IS/OS status has been reported to improve in response to anti-VEGF treatment, but ELM may show less improvement following treatment [55].
Malformations of the ORL are identified as outer retinal tubulations (ORT) and outer retinal corrugations. They are used to predict the clinical outcome of patients with nAMD [59]. Outer retinal tubulations (ORTs) can be found in nAMD and many retinal diseases. ORT is a circular, tube-like structural reconfiguration of disrupted, damaged photoreceptors [63]. They are often found in advanced nAMD and rarely disappear with regular anti-VEGF injections. Since ORT involves the loss of photoreceptor function, it is highly predictive of a worsening BCVA over time [59]. Outer retinal corrugations are groups of wavy hyperreflective materials above the Bruchs membrane found on OCT imaging of AMD that are often associated with basal laminar deposits (BLamD) [59]. They are generally limited to areas in eyes with significant GA or choroidal neovascularization (CNV) and are correlated with late nAMD. Outer retinal corrugations do not have a strong predictive value of visual outcomes, as they do not indicate leakage [59].
11.2.2.1 Hyperreflective material (HRM) and hyperreflective foci (HRF)
Hyperreflective material: Any hyperdense, reflective deposits found between the retina and the RPE are referred to as subretinal hyperreflective material (SHRM) [59]. The contents of SHRM vary and can evolve. These include blood, fibrin, choroidal neovascularization, and scar tissue. SHRM presence, especially in the fovea at baseline, is strongly linked to poorer visual prognosis compared with eyes without SHRM due to the disruption of the photoreceptors [55, 59, 61].
Hyperreflective foci (HRF): On OCT imaging, HRF appears as hyperreflective roundish lesions or small-sized, well-defined dots across the neurosensory retina; it is seen around the intraretinal cystoid spaces or near the drusen edge [55, 59]. They occur in several retina diseases, including DME and nAMD. HRF is believed to be a strong risk factor for the progression of dry AMD to nAMD [59, 61]. When found at an inner location of the retina and in a cluster, distribution is associated with nAMD. The persistence of HRF after anti-VEGF treatment has been correlated with a poorer VA at baseline [59]. Further, the persistence of HRF in patients had been noted in non-responders to anti-VEGF, compared to a decline in HRF in patients responsive to treatment. Thus, it serves as a good prognostic sign. The presence of HRF has likewise been significantly connected with the presence of other key biomarkers [61]. In a retrospective study, the presence of IRF was substantially associated with the presence of HRF in the inner retina, SRF layer, and outer retina; the presence of PED was noticeably associated with HRF in the inner retina, and the presence of SRF was significantly associated with HRF in the SRF layer [64]. Tuerksever et al. reported that eyes with more HRF at baseline showed a significant decrease in CNV leakage area in the 12th month, with a rapid reduction in HRF in the second week associated with lower CST at month 12 [65]. HRF quantity was also significantly correlated with drusen volume at baseline and after 1 year [61].
11.2.2.2 Double-layer sign (DLS)
Is an OCT finding suggestive of early-stage macular neovascularization of choroidal origin (type 1 macular neovascularization (MNV)) [55, 66]. It consists of two hyperreflective bands, one on top of the other with a small hyperreflective space in between; the lower band is the Bruch’s membrane, the upper band is the RPE and the space in between corresponds to the type 1 MNV that is referred to as “double-layer sign” (DLS) [55, 66]. Shallow, irregular RPE elevation (SIRE) has been used to describe the characteristic features of DLS in eyes with non-exudative MNV [55]; SIRE has been found to have a sensitivity of 100% for non-exudative MNV [55].
11.2.2.3 Retinal pigment epithelial (RPE) atrophy
A loss of retinal layers, RPE, and choriocapillaris characterize retinal pigment epithelial (RPE) atrophy [61]. There are two stages of atrophy in AMD, named according to the affected anatomic layers on OCT: cRORA (complete retinal pigment epithelium and outer retinal atrophy) and iRORA (incomplete RPE and outer retinal atrophy) [60]. The stage named cRORA is defined on OCT by a region of choroidal hypertransmission of diameter of at least 250 mm, a zone of attenuation or disruption of the RPE of 250 mm or more in diameter, and evidence of degeneration of the overlying photoreceptor, all of which occur in the absence of an RPE tear or scrolled RPE [60, 61]. The term iRORA is defined on OCT as evidence of some transmission but is discontinuous; the RPE band is present but irregular or interrupted; interrupted ELM and EZ is evidence of photoreceptor degeneration; the INL and OPL exhibit subsidence [61]. The finding of iRORA predates progression to cRORA in non-neovascular AMD; of multiple factors investigated, drusen collapse was the OCT feature most strongly correlated to progression to iRORA/cRORA [55].
11.2.2.4 Disorganization of retinal inner layers (DRIL)
The normal retina is an orderly, layered structure recognized by the hypo- and hyper-reflectivity patterns on OCT [55]. When there is a lack of demarcation in the inner retinal layers situated in the central fovea between the ganglion cell layer-inner plexiform layer complex (GCL-IPL), inner nuclear layer (INL), outer plexiform layer (OPL), and outer nuclear layer (ONL), this is described as DRIL [55, 58]. DRIL is a potentially important biomarker of reduced VA [58]. A large area of DRIL at baseline is correlated with worse baseline VA [55]. Regarding the measurement of DRIL on OCT, the central 1 mm retinal zone is the area considered. Disorganization of greater than 50% or > 500 μm of this area is considered significant and related to poorer visual prognosis [55]. A correlation has been found between DRIL, the foveal avascular zone (FAZ) size, and macular capillary nonperfusion [67]. Retinovascular diseases such as DME and retinal vein occlusions (RVO) studies have shown DRIL to be a marker for poor visual prognosis as these eyes have a worse baseline and final VA despite anti-VEGF treatment [67, 68].
11.2.2.5 Pigment epithelium detachment
Retinal pigment epithelium detachment (PED) is the separation between RPE’s basal lamina layer and the inner collagenous layer of Bruch’s membrane [59, 69, 70]. PEDs are seen as a prominent feature in AMD as well as in idiopathic polypoidal choroidal vasculopathy (IPCV) [69]. Various large treatment trials have shown that PEDs develop in 30–80% of eyes with nAMD [59, 69]. Cheong et al. provided a review of PED’s effect on VA in nAMD and IPCV [71]. Numerous studies have focused on VA’s association with the presence or absence of PED and its association with its morphological features, such as height, width, linear diameter, area, volume, reflectivity, and content of PED [59]. Despite several prospective and retrospective studies and randomized control trials, there is no clear agreement on the influence of these factors on the VA [59, 61]. Though some studies reported that the presence of PEDs may portend a slightly worse VA and hence a need for more regular retreatment, other studies counterintuitively report better vision in eyes with PEDs. There is evidence, however, that fibrovascular PED carries an inferior visual prognosis [59]. There are various types of PEDs, namely serous, drusenoid, fibrovascular, and mixed detachments [59, 70].
11.2.2.6 OCT imaging characteristics of types of PED
The OCT findings of a serous PED will appear as a dome-shaped elevation of the RPE over a hyporeflective space, with Bruch’s membrane commonly visible as a straight, thin hyperreflective line at the base of the elevation [69]. The occurrence of IRF/SRF or hyperreflective structures within the PED implies the presence of CNV.
In drusenoid PEDs, OCT will reveal RPE elevations over homogeneous mildly hyperreflective spaces. Bruch’s membrane is often seen at its base. CNV should be suspected in cases where significant heterogeneous optical reflectivity is seen within the PED and/or with the presence of IRF/SRF [69].
On OCT, fibrovascular PEDs usually appear as irregular elevations of the RPE with an interior that is not optically empty. It is seen as a non-uniform interior with hyper- and hypo-reflective layers [69].
11.2.2.7 Drusen
Drusen, a clinical hallmark of AMD, is a focal deposit of extracellular debris that could spontaneously appear, disappear, or change over time [72, 73]. Routine quantification of total drusen area and volume in the clinic is possible using the spectral domain OCT (SD-OCT) algorithms. The measurement of drusen load can accurately predict the development of advanced AMD [72].
Drusen associated with the development of advanced AMD, with baseline drusen volume greater than 0.03 mm2 in the central 3 mm diameter circle of the macula occurring in up to 25% of intermediate AMD eyes was a significant prognosticator for developing advanced AMD in fellow eyes, [61, 72] with a greater than four-fold increase in risk at 1 and 2 years [61, 72]. Increased drusen volume and drusen area have also been linked to developing occult CNV, with baseline drusen volume significantly greater in eyes demonstrating CNV than in eyes without CNV [61]. Increased drusen height that is “taller” drusen disrupting or compressing the outer nuclear layer, external limiting membrane, and ellipsoid zone on OCT are likely to carry an unfavorable prognosis [72]. The AREDS - age-related eye disease study - research group reported that of 95 eyes that went on to develop geographic atrophy (GA), the following features were observed: large drusen (≥ 125 μm in 96%, very large or ≥ 250 μm in 83%), confluent drusen (94%) and focal hyperpigmentation (96%), followed by drusen regression/fading and hypopigmentary changes (82%) occasionally accompanied by the deposition of refractile deposits (23%) [74]. Drusen is, therefore, an important biomarker of disease conversion to advanced AMD [61].
11.3 Optical coherence tomography angiography (OCTA)
OCT angiography (OCTA) is a non-dye, noninvasive technique that allows the in-depth visualization of the retinal plexuses layer by layer, quantifying microvascular parameters and comparing them with functional and morphological data [75, 76]. It has been evaluated as a complement or an alternative to fluorescein angiography (FA) and indocyanine green angiography (ICG-A) [76]. In Figure 17 OCTA and OCT are used to illustrate imaging of polypoidal choroidal vascular lesions in a PCV eye.
OCTA has several comparative advantages over FA and ICG-A. OCTA does not require the administration of exogenous contrast; hence, it can be performed at any patient visit when FA or ICGA is contraindicated [77]. It can be used to achieve capillary scale resolution; this means that pathology affecting the capillaries, such as capillary dropout, is best imaged with OCTA [78]. OCTA acquires higher microvascular contrast and well-defined images than FA, as its images are not masked by hyperfluorescence from dye leakage that can obscure vessels [77, 78]. This high-quality image data is adaptable to software-based image processing, which can provide quantitative markers for vascular pathology [77].
OCTA volumetric data can be segmented with different retinal layers projected to enable separate visualization of retinal capillary plexus and the choriocapillaris, as well as visualizing vascular pathologies, including alterations in retinal capillary and choriocapillaris structure as well as neovascularization [77]. Additionally, OCTA is distinctively capable of providing depth-resolved biomarkers [78].
11.4 OCT angiography biomarkers
11.4.1 Perfusion
OCTA can detect blood flow in the retina and choriocapillaris by assessing perfusion through proxy measurements that are ultimately different means of assessing vascular anatomy [78]. Some of these proxy measurements are listed below:
Macular area vessel density (VD): Vessel density is a biomarker parameter in OCTA that can be used to observe the movement and perfusion of retinal blood flow [79]. VD measurement is achieved by segmenting vessels in enface images, which is measured as a percent area [78]. Vascular density can be divided into superficial capillary plexus (SCP), deep capillary plexus (DCP), the outer retina, and choriocapillaris [79, 80]. It is helpful in staging and diagnosing prevalent diseases, including age-related macular degeneration and diabetic retinopathy [78]. In dry AMD, it has been shown that the vascular density of the choriocapillaris decreases with increased drusen density [80]. A similar feature is seen in geographic atrophy, the advanced form of dry AMD. There are reports of significant loss of choriocapillaris flow under the RPE atrophy area and flow abnormalities observed at the borders of the atrophy. AttaAllah et al. reported that eyes with DME had significantly lower vessel densities at the deep capillary plexus (DCP) level compared to diabetic eyes without macular edema and controls [81]. The study concluded that VD was one of the biomarkers that could be used to predict the progression of visual acuity and to monitor the response to anti-VEGF treatment.
Nonperfusion area: This refers to areas of impaired capillary perfusion [57]. Nonperfusion areas are localized regions of vessel loss and capillary dropout. They are identified as regions where the distance to the nearest vessel is larger than a physiologically determined threshold [78]. The most widely documented use of this OCTA capability has been to evaluate the shape, size enlargement, and remodeling of the fovea avascular zone (FAZ) among patients with diabetes of varying severity, RVO, and normal subjects [57, 78]. FAZ is quantified using the OCTA to gauge its development and progression using several metrics divided into size and shape categories. For size, these would include FAZ area, horizontal and vertical diameter, and Feret’s diameter for shape, circularity, and aspect ratio [82, 83, 84]. Feret’s diameter is the maximum diameter of the FAZ and is also known as the maximum caliper.
Choriocapillaris flow deficits: In some retinovascular diseases such as AMD and DR, perfusion can be lost in the choriocapillaris [78]. Imaging the choriocapillaris with OCTA is more complex than imaging superficial retinal layers because the choriocapillaris is located beneath the RPE, a strongly reflecting layer that attenuates the reflectance signal [78]. Choriocapillaris imaging is consequently susceptible to both projection artifacts and signal attenuation, as well as the density of the choriocapillaris vasculature, meaning that individual capillaries may not be resolvable. To ensure the challenges of imaging in this region are met, it is essential to consider the anatomic slab boundaries used, the projection method employed, the effect of scan size, sample beam wavelength, and comparisons with other imaging modalities for validation.
11.4.2 Neovascularization
In neovascular lesions such as nAMD, polypoidal choroidal vasculopathy (PCV), and pathologic myopia, neovascularization creates pathology, which commonly leads to a severe threat to vision [78]. In contrast to conventional dye angiographies, OCTA provides an image of the exact boundaries and intrinsic details of neovascular membranes [80]. Three types of neovascularization in wet AMD have been described based on the location of abnormal vessels [57]. Visualized on OCTA, Type 1 macular neovascularization (MNV) refers to a network of vessels lying underneath the RPE, between it and the Bruch’s membrane, often in the setting of a fibrovascular pigment epithelial detachment (PED) [57, 77, 78]. Type 2 MNV occurs as a network of vessels situated above the RPE but underneath the neurosensory retina, usually seen as a smaller but sharper vascular structure than type 1 MNV in the outer retinal section of OCTA [80]. Type 3 MNV originates from the deep capillary plexus within the retina and, on OCTA, is visualized as a discrete high-flow linear structure extending from the middle retinal layers into the deep retina and infrequently past the RPE [77, 80]. Various OCTA imaging features, such as the pattern of MNV (lacy wheel, sea fan, medusa, glomerular), the loop formation, branching characteristics, anastomosis, and the dark halo appearance around the lesion, have been previously described [80]. Studies have attempted to use the aforementioned OCTA features as biomarkers to determine MNV lesion activity criteria as either active or inactive [77, 80]. A recent biomarker termed “dark halo” is defined as a hypofluorescent choriocapillaris area surrounding the MNV, characterized by a flow deficit detected by OCTA [85]. Rispoli et al. have quantified dark halo (i.e., choriocapillaris vascular density changes) around MNV before and after anti-vascular endothelial growth factor (VEGF) injections using OCTA [70].
12. Functional imaging of the macula
Tests for potential vision assess the integrity of the retina and neural integrity of the visual system. Macular function tests are an essential part of evaluating potential vision [86]. A macular function test is vital for diagnosing and following up macula diseases. Imaging of the macular function includes the following:
12.1 Microperimetry
Microperimetry (MP), also known as macular perimetry, fundus perimetry, or fundus-related perimetry, is a functional test for the screening and follow-up of macular diseases [87, 88]. Conventionally, the Humphrey field analyzer (HFA) could be used to evaluate central macular sensitivity, but its role in monitoring macular disease has been limited by its inability to quantify retinal thresholds accurately over small, distinct retinal lesions and to retest these areas precisely over time [89]. Traditional visual field (VF) testing is not valuable for most patients with macular disease because central fixation is impacted, and VF tests need to be more reliable [90].
MP assesses retinal sensitivity
Microperimetry is a method of choice for residual visual function assessment. Some macular diseases, including age-related macular degeneration (AMD), diabetic macular edema (DME), Stargardt disease, macular hole, idiopathic macular telangiectasia, and central serous chorioretinopathy, are studied using microperimetry [85, 88]. Visual rehabilitation training benefits from microperimetry. Identifying eccentric fixation locations, known as preferred retinal loci (PRL), and fixation-stability estimates at those sites allow the practitioner to use the best residual visual function available for rehabilitation [91].
12.2 Multifocal electroretinography
Multifocal electroretinography (mfERG) represents an objective, noninvasive retina examination to assess visual function [94]. mfERG produces a retinal function map reflecting cone-mediated responses from the photoreceptor and bipolar cells [95]. It is a diagnostic test that measures electrical activity in the retina when stimulated by light [96]. It is also valuable in distinguishing between retinal and optic nerve disease [97]. An abnormal mfERG indicates that the foveal cones and bipolar cell layers are dysfunctional and are the source of vision loss. mfERG also indicates the precise distribution of the retinal dysfunction [97]. mfERG is most applicable to patients with focal deficits in visual function and an otherwise normal appearing fundus, as commonly seen in macular dystrophies such as retinitis pigmentosa (RP), hydroxychloroquine retinopathy, bull’s eye maculopathy, Stargardt’s macular dystrophy, occult macular dystrophy [98]. Macular diseases, such as AMD and hereditary macular conditions, have reduced mfERG findings. A multifocal electroretinography test is recommended for patients on Plaquenil therapy, as it can detect subtle changes in the early stages of toxicity. The most specific waveform pattern observed with Plaquenil toxicity is paracentral amplitude loss, indicative of decreased retinal function in the susceptible perifovea [95].
12.3 Oxygen saturation of the macula
Human retina metabolism is supported by oxygen supply, and abnormality in oxygen perfusion is linked to various ischemic and degenerative retinopathies, leading to visual impairment and blindness [99, 100]. Oxygenation of the human retina is an energy-dependent process in which different mechanisms maintain the regulation [100]. Both hypoxia and hyperoxia are destructive for the retina; therefore, adequate blood supply and oxygen metabolism are necessary to maintain proper visual function. Anatomically, the inner retina is primarily supplied by the retinal arterial vessels and the superficial retinal capillaries. In contrast, the outer retina is primarily supplied by the choroidal vessels and, to a lesser degree, by the deep retinal capillaries. Notably, while the retinal blood flow is auto-regulated, the choroidal blood flow is not [100, 101]. In the presence of photoreceptor degeneration, the oxygen delivery to the outer retina remains unchanged, whereas the intraretinal oxygen level increases progressively. With disease progression, a measured increase of superoxide radicals in the cytoplasm of the cones and the mitochondria follows [101]. Furthermore, excess superoxide radicals generate other reactive oxygen species, resulting in even more significant oxidative damage to the cones [101]. Ischemic retinopathies show topographical patterns, and the macula is particularly affected in many cases, such as in vascular occlusions, diabetic macular edema, and age-related macular degeneration [102]. Consequently, the measurement of blood oxygen saturation within the retinal circulation is not only crucial to understanding the pathophysiology of retinal diseases, but it also plays a vital role in detection and monitoring [99].
12.4 Fundus autofluorescence (FAF)
FAF is a noninvasive imaging technique that predominantly highlights fluorophores such as lipofuscin, rhodopsin, melanin, and N-retinylidene-N-retinylethanolamine (A2E) present in the retinal pigment epithelium (RPE). Fluorophores are naturally occurring molecules that both absorb and emit light of specified wavelengths [103, 104]. To produce autofluorescence, FAF relies on the property of the RPE to emit specific wavelengths in response to excitation by short-wavelength light, with the dominant fluorophore being RPE lipofuscin, which contains the fluorescent pigment A2E. A photon of the excitation wavelength is absorbed by fluorophores, raising an electron to an excited, high-energy state [26]. This electron then dissipates some energy through molecular collisions. It emits a quantum of light at a lower energy and a longer wavelength as it transitions back to the ground state [103, 105]. FAF reveals RPE defects with reduced fluorescence and can show areas of photoreceptor damage, which appear as increased fluorescence from an accumulation of lipofuscin [95]. FAF imaging detects lipofuscin, a metabolic biomarker of the photoreceptor/RPE complex that indicates AMD, inherited retinal disorders, toxic maculopathy, and other macular diseases. Thus, it is useful diagnostically and prognostically [95, 105].
12.5 Automated 10-2 visual field
Automated 10-2 visual field testing is a valuable tool for functional assessment of macular damage. As the macular region (±80) covers less than 2% of the retina, using other tests, such as the 24-2 visual field, misses damage to this area [106]. Visual field defects not respecting the vertical or horizontal midline are a feature of most macular diseases [107]. Macular diseases can cause central or paracentral scotomas depending on the location of the lesion.
Sometimes, patients with AMD may retain good visual acuity but experience distortion and other qualitative visual changes. Visual field assessment can detect the size and depth of the defects, leading to early detection and intervention [95]. Plaquenil (hydroxychloroquine-HCQ) screening guidelines mandate that a 10–2 white-stimulus visual field be performed on all patients taking this medication [95]. Other macular pathologies result in visual field defects that directly correlate with the retinal findings [107].
13. Multimodal imaging
Multimodal imaging of macular disease combines a series of imaging modalities, resulting in a better appreciation and understanding of the pathologic process, increased diagnostic sensitivity and specificity, and a clearer understanding of disease evolution [108]. The term multimodal imaging has been used in other medical disciplines, including cardiology, neurology, and oncology. In cardiology, multimodal imaging is “the efficient integration of various cardiovascular imaging methods to improve the ability to diagnose, guide therapy, or predict outcomes.” [109]. Expertise in multiple imaging modalities is required for multimodal imaging [110].
The various imaging modalities already covered in this chapter can provide aspects of imaging information that complement each other for macular imaging. Various combinations of fundus photography, scanning laser ophthalmoscopy, fundus autofluorescence, fundus fluorescein angiography, indocyanine angiography, optical coherence tomography (OCT), and in recent times, addition of OCT angiography have been used in multimodal imaging of macular diseases. Because of the popularity, non-invasiveness, and three-dimensional imaging offered by the OCT (and, in recent times, OCTA), it is combined with the color fundus photograph in most multimodal imaging platforms. Macular diseases for which multimodal imaging has been utilized include diabetic macular edema, age-related macular degeneration, polypoidal choroidal vasculopathy, retinal vein, and choroidal vascular occlusion [111, 112, 113]. Figures 12–15 utilize multimodal imaging to evaluate peripapillary choroidal neovascularization.
Yeung et al. observed a correlation between OCT and FFA findings in DME [114]. They noted a positive correlation between the severity of the outer retinal edema on OCT and the severity of leakage on FFA. Furthermore, inner and outer retina cystic changes also correlated with the severity of fluorescein dye leakage. Loss of inner retinal layers on OCT also correlated with capillary nonperfusion on FA, and large foveal cysts on SD-OCT corresponded to cystoid leakage patterns on FA. These findings suggest that diseased retinal structural changes highlighted by OCT can demonstrate patterns of leakage or non-perfusion, as seen on FA. On a case-by-case basis, multimodal imaging helps determine the appropriate diagnosis and extent of pathology, such as in polypoidal choroidal vasculopathy; OCT defines outer retina structure, including pigment epithelial detachment, and the thickened choroid, ICGA demonstrates the branching vascular network and choroidal polyps, which can also be demonstrated using OCTA. OCTA can image macular nonperfusion in diabetic macular ischemia or sickle cell maculopathy, while OCT images often present reduced temporal retina thickness, which can be associated with ischemic maculopathy.
14. Adaptive optics in macular imaging
Adaptive optics (AO) is an imaging modality that helps correct existing aberrations in the optical system, whose role in ophthalmology is emerging [115, 116]. It can significantly enhance visualization and assessment of the microstructure of retina cells, including ganglion cells (neurons), photoreceptors, and blood vessels (capillaries). The AO technique corrects for optical aberrations and was originally used to correct the blurring effect of atmospheric turbulence on images in ground-based telescopes. It is used in astronomy [117]. With AO’s aid, the eye’s imperfect optics can be corrected so that microscopic retinal changes can be visualized and imaged [117]. Because of its aberration correction, AO improves transverse resolution from 10 to 15 μm to approximately 2 μm, enabling the assessment of individual retinal cell types [118]. AO allows imaging of cellular and subcellular details of the macula and retina without histology [119]. Incorporation of AO into existing imaging technologies such as the fundus camera, scan laser ophthalmoscope, and OCT has greatly benefited the evaluation (including stratification of disease phenotypes), research, and treatment of several macular diseases [115]. In AO ophthalmoscopes, a synergy of AO with fundus photography, OCT, and scanning laser ophthalmoscopy (SLO) allows microscopic imaging. The AO ophthalmoscopes use a wavefront sensor to measure the ocular monochromatic aberrations and a deformable mirror to correct the detected aberrations [120].
AO retinal imaging is noninvasive and safe, used to study individual retinal cells’ structure and function. Adaptive optics scanning laser ophthalmoscopy (AOSLO) systems have been used extensively [120]. It has been used to image cones, rods, retinal pigment epithelium, ganglion cells, and small retinal blood vessels and for studying cone function [121]. AO has been extensively used in the clinical evaluation and investigation of inherited retinal diseases (IRDs), including Stargardt disease, retinitis pigmentosa (RP), and achromatopsia [118, 119, 120]. Clinical trials on therapeutics for IRDs employ AO ophthalmoscopy for participant selection, stratification, and monitoring of treatment safety and efficacy. AO retina imaging has facilitated the study of photoreceptor distribution in the foveomacula area in healthy eyes and diseases, such as IRD. Cone density is the most used mosaic metric, with good reliability and repeatability shown in healthy controls [118]. Cone spacing is another metric that has found usage. Both cone density and spacing have been used successfully to determine treatment efficacy in patients with RP and Usher syndrome, treated with ciliary neurotrophic factor (CNF), resulting in a reduced rate of cone loss [122].
AO ophthalmoscopy has been used in AMD. Findings on macular imaging in AMD include the following observed by Paques et al.: improved drusen identification, limits of atrophy are better delineated, and the appreciation (visualization) of novel features, including punctate hyperreflectivity and mobile melanin-containing clumps [123]. AO retinal imaging has also been applied to study retinal vasculature. Retinal vascular biomarkers identified using AO flood illumination ophthalmoscopy (FLO) and AOSLO include inner diameter (ID), outer diameter (OD), parietal thickness (PT), wall cross-sectional area (WCSA), and wall-to-lumen ratio (WLR) [124].
15. Artificial intelligence in macular imaging
There has been much interest in incorporating artificial intelligence (AI) models to analyze retinal images. This interest is primarily because of the ability of AI to noninvasively, systematically, and rapidly analyze large amounts of data from digital images in a manner that is not humanly possible or would require a significant amount of time were it to be physically done by humans. Deep learning (DL) models have been commonly used in ophthalmology, and they can recognize, quantify, and describe several macular-related pathologic clinical features [125].
The expanding role of AI using different learning models includes screening, diagnostic grading, therapy guidance with automated detection of disease activity, recurrences, quantification of therapeutic effects, and identification of relevant targets for novel therapeutic approaches [126]. AI also offers the opportunity for personalized care for several macular diseases through its ability to predict and prognosticate outcomes since several biomarkers of macular diseases have been discovered and analyzed.
DL models have been applied to digital images from fundus photographs, mainly OCT, and are promising for the early detection of diabetic retinopathy and macular degeneration, two leading macular diseases. Of note, the increase in life expectancy and projected increase in the prevalence of diabetes suggest higher rates of AMD and DR, and by extension, more digital fundus photographs and OCT to train AI models [127]. Therefore, DL models will become valuable in rapidly, accurately, and efficiently analyzing such images.
DL has been validated for detecting diabetic retinopathy. Color fundus photography has been used for training AI models on DR. Shah et al. compared AI versus clinician examination for detecting diabetic retinopathy during screening of diabetic patients. Similarly, high sensitivity and specificity rates were demonstrated for any DR detection and prompt referral by AI and human screening [128]. In one study, AI was more sensitive than ophthalmologists in detecting DR [129]. Therefore, in situations of limited resources, the use of alternative AI models for the screening and early detection of DR, resulting in prompt referral for treatment, appears reasonable, given its performance in detecting vision-threatening DR and diabetic macular edema when used in population screening for DR [130]. In DR, DL algorithms diagnose microaneurysms, hemorrhages, hard exudates, cotton-wool spots, and neovascularization in people with DR [131].
AI has been used in AMD with reports of high detection rates of referable diseases. With success in using color fundus photographs, efforts have focused on utilizing OCT for volumetric quantification of intraretinal and subretinal fluid volumes [132]. Hwang et al. investigated the utility of AI- and cloud-based telemedicine interaction tools for diagnosis and proposed AMD treatment [132]. DL models used OCT images to diagnose AMD with a high degree of accuracy, and treatment recommendations were found to be similar to those of retina specialists [133]. The AI platform’s detection accuracy was higher than 90%, superior rates to medical students, and equal to retinal specialists (92.7% and 91.9%) [133]. Yoo et al. investigated the diagnostic accuracy of DL using the combination of fundus photographs and OCT to diagnose AMD. They found this to be superior in accuracy to AI fundus photographs alone and AI OCT alone. DL using both OCT and fundus data outperformed DL using OCT alone and fundus image alone [134]. This finding supports the notion that DL using multimodal imaging could be more accurate than unimodal imaging.
DL models have been used for other novel applications, including OCT angiography images and biomarkers analysis [135, 136]. It has been used to accurately detect pathologies such as choroidal neovascularization, precise quantification of retinal perfusion, and more [135, 136]. Deep learning has been used to predict geographic atrophy areas and growth rates [137]. This study trained the DL network using multimodal imaging (baseline FAF images and OCT volumes) [137]. DL has also been used to accurately segment OCT images in different macular diseases, including GA, DR, and AMD [138, 139, 140]. DL has also been used to analyze different fundus photography and OCT biomarkers.
Despite the apparent usefulness of AI and DL models, significant challenges still need to be addressed to the adaptability of this platform to everyday use in clinical practice. Some of the challenges include the deskilling of physicians due to an increase in reliance on automation, the lack of AI programs to assume a comprehensive, holistic approach to clinical encounters with patients, the need for pre-existing robust datasets to train AI programs with, and lack of AI programs to incorporate the ambiguity and variability often encountered in clinical medicine [132]. Other reasons include security, privacy, poor pervasiveness, trust, and explainability concerns [141].
16. Other macular imaging techniques
There are other less-known macular imaging techniques. These include the following:
Macula pigment optical density (MPOD) measures the macular pigment, a dietary pigment thought to have a protective role in the retina. The estimated value of macular pigment is known to decrease in patients who suffer from AMD, and this pigment could be protective. Population studies suggest no significant differences in age after excluding patients with AMD. However, lower MPOD could be a risk factor for developing dry AMD [142]. MPOD is much lower in AMD patients than in age-matched healthy controls. Several methods have been proposed for measuring the degree of macular pigment. One of the methods is based on fundus reflectometry, which also features a photodetector for measuring reflectance at different wavelengths and retinal locations. The image of the pigment density can be spatially reconstructed, appearing as color codes [143].
Photoacoustic microscopy (PAM) and photoacoustic tomography (PAT) use acoustic detection to image optical absorption contrast with high-resolution deep into scattering tissue [144]. PAT is a three-dimensional (3-D) imaging modality based on the photoacoustic (PA) effect. PAM has been used as a noncontact technique for
in vivo retina imaging and estimating the retinal vasculature’s oxygen saturation [145]. An optical coherence photoacoustic microscopy (OC-PAM) system, which can accomplish optical coherence tomography (OCT) and photoacoustic microscopy (PAM) simultaneously, has also been developed [146]. The principle in PAM is that tissues undergo thermoelastic expansion with a nanosecond pulsed laser beam, releasing a wide-band acoustic wave that can be detected using a high-frequency ultrasound transducer [147]. In PAM, each laser pulse generates a one-dimensional (1-D) photoacoustic image (A-line) along the axial direction. Raster-scanning and piecing together all the A-lines provides a 3-D PA image. Image reconstruction is not required since each signal obtained by the transducer represents a 1-D image of a single line inside the object following minimal signal processing [145]. PAM can simultaneously image anatomical, functional, molecular, flow dynamic, and metabolic contrastsin vivo [148]. PAM has been used for macular blood flow imaging in retina vaso-occlusive diseases [149]. Of interest is that PAM has been integrated with adaptive optics for high-resolution retina imaging [150]. The AO-PAM system was used to image single RPE cells inex vivo experiments [150]. The safety of PAM has been demonstrated using preclinical studies in which the laser energy from a PAM equivalent had no adverse effect on the retina [151].Fluorescence lifetime imaging ophthalmoscopy (FLIO) is an emerging, noninvasive imaging modality to investigate the autofluorescence of the human fundus
in vivo . Lipofuscin is a fluorophore in the retinal pigment epithelium, strongly influencing macular autofluorescence. However, other endogenous retinal fluorophores exist. Fundus autofluorescence is characterized by the spatial distribution of the fluorescence intensity or emission spectrum and its characteristic fluorescence lifetime function. The average time a fluorophore remains excited following excitation is referred to as the fluorescence lifetime [152]. Different retinal and macular diseases can influence this FLIO. Diseases such as AMD, diabetic retinopathy, macular telangiectasia type 2, retinitis pigmentosa, and Stargardt disease affect FLIO [153]. In some normal eyes, FLIO changes already exist, suggesting a predisposition or increased risk of developing the disease, while changes in already diseased eyes may suggest progression. Because of its role in early disease detection, it holds promise as a tool for early diagnosis.
17. Conclusion
Imaging of the macula in health and disease has been revolutionized by technological advances and the need to understand disease pathophysiology and evolution, diagnosis, and monitoring outcome of treatment. This evolution in imaging has yielded significant benefits since macular imaging can now be accomplished at even subcellular levels, granting a better understanding of several macular diseases. The quest to integrate higher-resolution imaging and analytics of the macula into routine clinical practice and everyday patient decision-making will result in even more personalization of treatment and improvements in outcomes. Future goals to be accomplished with macular imaging include earlier detection and improved prognostication of disease, prediction of treatment outcome enhancement by imaging, and image-guided treatment for several untreatable inherited retinal diseases.
Already, breakthroughs in cellular imaging using adaptive optics have improved the understanding of inherited retinal diseases and have been used for patient selection in clinical trials, understanding inherited retinal disease natural history, and monitoring the response of genetic and other therapies in clinical trials. It is anticipated that newer and more robust macular imaging will continue to evolve. Multimodal imaging and artificial intelligence will play significant roles in clinical practice and research into macular diseases. As patient care moves from clinics to the comfort of homes, imaging devices such as the home OCT will gain popularity for screening and monitoring the evolution of macular diseases. Expanding the benefits of macular imaging will ultimately result in increased personalization of patient care, improved patient management decision-making, and better treatment outcomes for the patient.
Acknowledgments
We express our gratitude to Dr. Adekunle Hassan for his support in the writing of this manuscript and for contributing images.
Conflict of interest
There are no relevant conflicts of interest to be declared by any of the authors.
References
- 1.
Feibel RM. Looking back at ophthalmic imaging from the first century of the American Journal of Ophthalmology: Photography and ultrasonography. American Journal of Ophthalmology. 2018; 195 :xx-lv. DOI: 10.1016/j.ajo.2018.08.020. Epub 2018 Aug 22 - 2.
Hildred RB. A brief history on the development of ophthalmic retinal photography into digital imaging. The Journal of Audiovisual Media in Medicine. 1990; 13 (3):101-105. DOI: 10.3109/17453059009055111 - 3.
Hurtes R. Evolution of ophthalmic photography. International Ophthalmology Clinics. 1976; 16 :1-22 - 4.
Van Cader TC. History of ophthalmic photography. Journal of Ophthalmic Photography. 1978; 1 :7-9 - 5.
Bennett TJ, Barry CJ. Ophthalmic imaging today: An ophthalmic photographer's viewpoint - a review. Clinical & Experimental Ophthalmology. 2009; 37 (1):2-13. DOI: 10.1111/j.1442-9071.2008.01812.x. Epub 2009 Sep 23 - 6.
Meyer-Schwickerath GR. Ophthalmology and photography. American Journal of Ophthalmology. 1968; 66 :1011-1019. DOI: 10.1016/0002-9394(68)90809-X - 7.
Saine PJ, Patrick J, Tyler ME. Ophthalmic photographers’ society. Fundus Photography Overview. Available from: http://www.opsweb.org/?page5fundusphotography . [Accessed: November 28, 2013] - 8.
Choudhry N, Duker JS, Freund KB, et al. Classification and guidelines for widefield imaging: Recommendations from the international widefield imaging study group. Ophthalmology Retina. 2019; 3 :843-849 - 9.
MacGillivray TJ, Trucco E, Cameron JR, Dhillon B, Houston JG, van Beek EJ. Retinal imaging as a source of biomarkers for diagnosis, characterization and prognosis of chronic illness or long-term conditions. The British Journal of Radiology. 2014; 87 (1040):20130832. DOI: 10.1259/bjr.20130832. Epub 2014 Jun 17 - 10.
Mishra C, Tripathy K. Fundus Camera. In: StatPearls [Internet]. Treasure Island (FL): StatPearls Publishing; 2023. Available from: https://www.ncbi.nlm.nih.gov/books/NBK585111/ [Accessed: Jul 31, 2023] - 11.
Gobel AP, Fleckenstein M, Schmitz Valckenberg S, Brinkmann CK, Holz FG. Imaging geographic atrophy in age-related macular degeneration. Ophthalmologica. 2011; 226 (4):182-190 - 12.
Peli E, Lahav M. Drusen measurement from fundus photographs using computer image analysis. Ophthalmology. 1986; 93 (12):1575-1580. DOI: 10.1016/s0161-6420(86)33524-3 - 13.
Lord RK, Shah VA, San Filippo AN, Krishna RJO. Novel uses of smartphones in ophthalmology. Ophthalmology. 2010; 117 (6):1274-.e3 - 14.
Iqbal U. Smartphone fundus photography: A narrative review. International Journal of Retina and Vitreous. 2021; 7 :44. DOI: 10.1186/s40942-021-00313-9 - 15.
Patton N, Aslam TM, MacGillivray T, Deary IJ, Dhillon B, Eikelboom RH, et al. Retinal image analysis: Concepts, applications and potential. Progress in Retinal and Eye Research. 2006; 25 (1):99-127 - 16.
Besenczi R, Tóth J, Hajdu A. A review on automatic analysis techniques for color fundus photographs. Computational and Structural Biotechnology Journal. 2016; 14 :371-384. DOI: 10.1016/j.csbj.2016.10.001 - 17.
Huang F, Lian J, Ng KS, Shih K, Vardhanabhuti V. Predicting CT-based coronary artery disease using vascular biomarkers derived from fundus photographs with a graph convolutional neural network. Diagnostics (Basel). 2022; 12 (6):1390. DOI: 10.3390/diagnostics12061390 - 18.
Chan YK, Cheng CY, Sabanayagam C. Eyes as the windows into cardiovascular disease in the era of big data. Taiwan Journal of Ophthalmology. 2023; 13 (2):151-167. DOI: 10.4103/tjo.TJO-D-23-00018 - 19.
Wu JH, Liu TYA. Application of deep learning to retinal-image-based Oculomics for evaluation of systemic health: A review. Journal of Clinical Medicine. 2022; 12 (1):152. DOI: 10.3390/jcm12010152 - 20.
Tyler ME. Stereo fundus photography: Principles and technique. Journal of Ophthalmic Photography. 1996; 18 :68-89 - 21.
Hancock R. Stereo imaging in ophthalmology. The Royal Photographic Society. 2020. Available from: https://rps.org/news/groups/medical/2020/stereo-imaging-in-ophthalmology/ - 22.
Li HK, Hubbard LD, Danis RP, Esquivel A, Florez-Arango JF, Krupinski EA. Monoscopic versus stereoscopic retinal photography for grading diabetic retinopathy severity. Investigative Ophthalmology & Visual Science. 2010; 51 :3184-3192 - 23.
Delori FC, Dorey CK, Staurenghi G, Arend O, Goger DG, Weiter JJ. In vivo fluorescence of the ocular fundus exhibits retinal pigment epithelium lipofuscin characteristics. Investigative Ophthalmology & Visual Science. 1995; 36 (3):718-729 - 24.
Yung M, Klufas MA, Sarraf D. Clinical applications of fundus autofluorescence in retinal disease. International Journal of Retina and Vitreous. 2016; 2 :12. DOI: 10.1186/s40942-016-0035-x - 25.
Pole C, Ameri H. Fundus autofluorescence and clinical applications. Journal of Ophthalmic & Vision Research. 2021; 16 (3):432-461. DOI: 10.18502/jovr.v16i3.9439 - 26.
Calvo-Maroto AM, Cerviño A. Spotlight on fundus autofluorescence. Clinical Optometry (Auckl). 2018; 10 :25-32. DOI: 10.2147/OPTO.S134637 - 27.
Bindewald A, Bird AC, Dandekar SS, et al. Classification of fundus autofluorescence patterns in early age-related macular disease. Investigative Ophthalmology & Visual Science. 2005; 46 :3309Y14 - 28.
Forte R, Querques G, Querques L, et al. Multimodal imaging of dry age-related macular degeneration. Acta Ophthalmologica. 2012; 90 :e281Y7 - 29.
Ly A, Nivison-Smith L, Assaad N, Kalloniatis M. Fundus autofluorescence in age-related macular degeneration. Optometry and Vision Science. 2017; 94 (2):246-259. DOI: 10.1097/OPX.0000000000000997 - 30.
Schmitz-Valckenberg S, Pfau M, Fleckenstein M, Staurenghi G, Sparrow JR, Bindewald-Wittich A, et al. Fundus autofluorescence imaging. Progress in Retinal and Eye Research. 2021; 81 :100893. DOI: 10.1016/j.preteyeres.2020.100893. Epub 2020 Aug 3 - 31.
Alten F, Clemens CR, Heiduschka P, Eter N. Characterisation of reticular pseudodrusen and their central target aspect in multi-spectral, confocal scanning laser ophthalmoscopy. Graefe's Archive for Clinical and Experimental Ophthalmology. 2014; 252 :715-721 - 32.
Tan ACS, Fleckenstein M, Schmitz-Valckenberg S, Holz FG. Clinical application of multicolor imaging technology. Ophthalmologica. 2016; 236 (1):8-18. DOI: 10.1159/000446857 - 33.
Laatikainen L. The fluorescein angiography revolution: A breakthrough with sustained impact. Acta Ophthalmologica Scandinavica. 2004; 82 (4):381-392. DOI: 10.1111/j.1395-3907.2004.00284.x - 34.
Ruia S, Tripathy K. Fluorescein angiography. In: StatPearls [Internet]. Treasure Island (FL): StatPearls Publishing. 2023. Available from: https://www.ncbi.nlm.nih.gov/books/NBK576378/ [Accessed: Feb 22, 2023] - 35.
Pieramici DJ, Bressler SB. Fluorescein angiography. In: Berger JW, Fine SL, Maguire MG, editors. Age-Related Macular Degeneration. St. Louis: Mosby; 2005. pp. 219-236 - 36.
Subfoveal neovascular lesions in age-related macular degeneration. Guidelines for evaluation and treatment in the macular photocoagulation study. Macular Photocoagulation Study Group. Archives of Ophthalmology. 1991; 109 (9):1242-1257 - 37.
Gass JDM. Stereoscopic Atlas of Macular Diseases: Diagnosis and Treatment. 4th ed. St. Louis: Mosby-Yearbook; 1997 - 38.
Tripathy K, Chawla R, Sharma YR, Gogia V. Ultrawide field fluorescein angiogram in a family with gyrate atrophy and foveoschisis. Oman Journal of Ophthalmology. 2016; 9 (2):104-106 - 39.
Yannuzzi LA. Indocyanine green angiography: A perspective on use in the clinical setting. American Journal of Ophthalmology. 2011; 151 (5):745-751.e1 - 40.
Talks SJ, Aftab AM, Ashfaq I, Soomro T. The role of new imaging methods in managing age-related macular degeneration. The Asia Pacific Journal of Ophthalmology. 2017; 6 (6):498-507 - 41.
Keane PA, Sim DA, Sadda SR. Advances in imaging in age-related macular degeneration. Current Ophthalmology Reports. 2013; 1 (1):1-11 - 42.
Muraleedharan S, Tripathy K. Indocyanine green (ICG) angiography. In: StatPearls [Internet]. Treasure Island (FL): StatPearls Publishing; 2023. Available from: https://www.ncbi.nlm.nih.gov/books/NBK580479/ [Accessed: Mar 27, 2023] - 43.
Wong RL, Lai TY. Polypoidal choroidal vasculopathy: An update on therapeutic approaches. Journal of Ophthalmic & Vision Research. 2013; 8 (4):359-371 - 44.
Kokame GT, Omizo JN, Kokame KA, Yamane ML. Differentiating exudative macular degeneration and Polypoidal choroidal vasculopathy using OCT B-scan. Ophthalmology. Retina. 2021; 5 (10):954-961. DOI: 10.1016/j.oret.2021.05.009. Epub 2021 May 19 - 45.
Slakter JS, Yannuzzi LA, Guyer DR, Sorenson JA, Orlock DA. Indocyanine-green angiography. Current Opinion in Ophthalmology. 1995; 6 (3):25-32. DOI: 10.1097/00055735-199506000-00005 - 46.
Mainster MA, Timberlake GT, Webb RH, Hughes GW. Scanning laser ophthalmoscopy. Clinical applications. Ophthalmology. 1982; 89 (7):852-857. DOI: 10.1016/s0161-6420(82)34714-4 - 47.
Yoshida A. New examination methods for macular disorders–Application of diagnosis and treatment. Nippon Ganka Gakkai Zasshi. 2000; 104 (12):899-942. Japanese - 48.
Konno S, Takeda M, Yanagiya N, Akiba J, Yoshida A. Three-dimensional analysis of macular diseases with a scanning retinal thickness analyzer and a confocal scanning laser ophthalmoscope. Ophthalmic Surgery and Lasers. 2001; 32 (2):95-99 - 49.
Mainster MA, Desmettre T, Querques G, Turner PL, Ledesma-Gil G. Scanning laser ophthalmoscopy retroillumination: Applications and illusions. International Journal of Retina and Vitreous. 2022; 8 (1):71. DOI: 10.1186/s40942-022-00421-0 - 50.
Ranetti AE, Stanca HT, Tăbăcaru B, Teodoru A, Munteanu M, Stanca S. Retromode imaging in age-related macular degeneration. Medicina (Kaunas, Lithuania). 2023; 59 (4):647. DOI: 10.3390/medicina59040647 - 51.
Wylęgała A, Wozniak P, Sędziak-Marcinek B, Bolek B, Szkodny D, Wylęgała E. Retro-mode in NIDEK Mirante: A comparative analysis with other imaging modalities for AMD and CSR. Diagnostics (Basel). 2023; 13 (17):2846. DOI: 10.3390/diagnostics13172846 - 52.
Yang Y, Vitale S, Ding Y, O'Connell SR, Alexander J, Bressler NM, et al. A comparison of quantitative mapping and stereoscopic fundus photography grading of retinal thickness in diabetic eyes with macular edema. Ophthalmic Surgery, Lasers & Imaging. 2003; 34 (1):7-16 - 53.
Goebel W, Franke R. Retinal thickness in diabetic retinopathy: Comparison of optical coherence tomography, the retinal thickness analyzer, and fundus photography. Retina. 2006; 26 (1):49-57. DOI: 10.1097/00006982-200601000-00009 - 54.
Lai JC, Stinnett SS, Jaffe GJ. B-scan ultrasonography for the detection of macular thickening. American Journal of Ophthalmology. 2003; 136 (1):55-61. DOI: 10.1016/s0002-9394(02)02273-0 - 55.
Udoh M, Okudo A, Okonkwo ON. Optical coherence tomography and optical coherence tomography angiography biomarkers for age-related macular degeneration and retinovascular diseases. Nigerian Journal of Vitreoretinal Diseases. 2023; 6 (1):1-10. DOI: 10.4103/njvd.njvd_3_23 - 56.
Al-Mujaini A, Wali UK, Azeem S. Optical coherence tomography: Clinical applications in medical practice. Oman Medical Journal. 2013; 28 (2):86-91 - 57.
Kashani AH, Chen C, Gahm JK, Zheng F, Richter GM, Philip J. Review of current methods and clinical applications. Progress in Retinal and Eye Research. 2018; 60 :66-100 - 58.
Gemayel M, Ciulla T. Retinal OCT biomarkers for clinicians and clinical researchers. Retinal Physician. 2021; 18 :28-30 - 59.
Nawash B, Ong J, Driban M, Hwang J, Chen J, Selvam A, et al. Prognostic optical coherence tomography biomarkers in neovascular age-related macular degeneration. Journal of Clinical Medicine. 22 Apr 2023; 12 (9):3049 - 60.
Goździewska E, Wichrowska M, Kocięcki J. Early optical coherence tomography biomarkers for selected retinal diseases—A review. Diagnostics. 2023; 13 (14):2444 - 61.
Hanson RLW, Airody A, Sivaprasad S, Gale RP. Optical coherence tomography imaging biomarkers associated with neovascular age-related macular degeneration: A systematic review. Eye. 2023; 37 (12):2438-2453 - 62.
Mitamura Y, Mitamura-Aizawa S, Katome T, Naito T, Hagiwara A, Kumagai K, et al. Photoreceptor impairment and restoration on optical coherence tomographic image. Journal of Ophthalmology. 2013; 2013 :518170 - 63.
Iaculli C, Barone A, Scudieri M, Palumbo MG, Noci ND. Outer retinal tubulation. Retina. 2015; 35 (10):1979-1984 - 64.
Huang CH, Yang CH, Hsieh YT, Yang CM, Ho TC, Lai TT. Hyperreflective foci in predicting the treatment outcomes of diabetic macular edema after anti-vascular endothelial growth factor therapy. Scientific Reports [Internet]. 2021; 11 (1):1-9. DOI: 10.1038/s41598-021-84553-7 - 65.
Tuerksever C, Pruente C, Hatz K. High-frequency SD-OCT follow-up leading to up to biweekly intravitreal ranibizumab treatment in neovascular age-related macular degeneration. Scientific Reports [Internet]. 2021; 11 (1):1-10. DOI: 10.1038/s41598-021-86348-2 - 66.
Berlin A, Chen L, Messinger J, Ferrara D, Freund KB, Curcio CA. Double-layer sign in neovascular age-related macular degeneration – Do we treat? Acta Ophthalmologica. 2022; 100 (3):348-349 - 67.
Markan A, Agarwal A, Arora A, Bazgain K, Rana V, Gupta V. Novel imaging biomarkers in diabetic retinopathy and diabetic macular edema. Therapeutic Advances in Ophthalmology. 2020; 12 :1-16 - 68.
Castro-Navarro V, Monferrer-Adsuara C, Navarro-Palop C, Montero-Hernández J, Cervera-Taulet E. Optical coherence tomography biomarkers in patients with macular edema secondary to retinal vein occlusion treated with dexamethasone implant. BMC Ophthalmology [Internet]. 2022; 22 (1):1-16. DOI: 10.1186/s12886-022-02415-w - 69.
Karampelas M, Malamos P, Petrou P, Georgalas I, Papaconstantinou D, Brouzas D. Retinal pigment epithelial detachment in age-related macular degeneration. Ophthalmology and Therapy [Internet]. 2020; 9 (4):739-756. DOI: 10.1007/s40123-020-00291-5 - 70.
Rispoli M, Eandi CM, Di Antonio L, Kilian R, Montesel A, Savastano MC. Biomarkers in early response to brolucizumab on pigment epithelium detachment associated with exudative age-related macular degeneration. Biomedicines. 10 Jun 2021; 9 (6):668 - 71.
Cheong KX, Grewal DS, Teo KYC, Gan ATL, Jaffe GJ, Cheung GCM. The relationship between pigment epithelial detachment and visual outcome in neovascular age-related macular degeneration and polypoidal choroidal vasculopathy. Eye [Internet]. 2020; 34 (12):2257-2263. DOI: 10.1038/s41433-020-0803-6 - 72.
Ly A, Yapp M, Nivison-Smith L, Assaad N, Hennessy M, Kalloniatis M. Developing prognostic biomarkers in intermediate age-related macular degeneration: Their clinical use in predicting progression. Clinical & Experimental Optometry. 2018; 101 (2):172-181 - 73.
Schlanitz F, Baumann B, Sacu S, Baumann L, Pircher M, Hitzenberger CK, et al. Impact of drusen and drusenoid retinal pigment epithelium elevation size and structure on the integrity of the retinal pigment epithelium layer. The British Journal of Ophthalmology. 2019; 103 (2):227-232 - 74.
Klein ML, Ferris FL, Armstrong J, Hwang TS, Chew EY, Bressler SB, et al. Retinal precursors and the development of geographic atrophy in age-related macular degeneration. Ophthalmology. 2008; 115 (6):1026-1031 - 75.
Suciu CI, Suciu VI, Nicoara SD. Optical coherence tomography (angiography) biomarkers in the assessment and monitoring of diabetic macular Edema. Journal Diabetes Research. 31 Dec 2020:6655021 - 76.
Coscas F, Cabral D, Pereira T, Geraldes C, Narotamo H, Miere A, et al. Quantitative optical coherence tomography angiography biomarkers for neovascular age-related macular degeneration in remission. PLoS One. 2018; 13 (10):1-13 - 77.
Spaide RF, Fujimoto JG, Waheed NK, Srinivas SR, Staurenghi G. Optical coherence tomography angiography. Progress in Retinal and Eye Research. Author manuscript; available PMC 2019. 2018; 64 :1-55 - 78.
Hormel TT, Jia Y. OCT angiography and its retinal biomarkers [invited]. Biomedical Optics Express. 2023; 14 (9):4542 - 79.
Lv M, Li T, Li Y. Clinical application of optical coherence tomography angiography in diabetic macular edema. African Health Sciences. 2023; 23 (2):484-489 - 80.
Batıoğlu F, Yanık Ö, Demirel S, Özmert E. Clinical use of optical coherence tomography angiography in retinal diseases. Diagnostics (Basel). 22 May 2023; 13 (10):1820 - 81.
AttaAllah H, Mohamed A, Ali M. Macular vessels density in diabetic retinopathy: Quantitative assessment using optical coherence tomography angiography. International Ophthalmology. 2019; 39 (8):1845-1859 - 82.
Krawitz BD, Mo S, Geyman LS, Agemy SA, Scripsema NK, Garcia PM, et al. A circularity index and axis ratio of the foveal avascular zone in diabetic eyes and healthy controls measured by optical coherence tomography angiography. Vision Research [Internet]. 2017; 139 :177-186. DOI: 10.1016/j.visres.2016.09.019 - 83.
Freiberg FJ, Pfau M, Wons J, Wirth MA, Becker MD, Michels S. Optical coherence tomography angiography of the foveal avascular zone in diabetic retinopathy. Graefe's Archive for Clinical and Experimental Ophthalmology [Internet]. 2016; 254 (6):1051-1058. DOI: 10.1007/s00417-015-3148-2 - 84.
Shiihara H, Terasaki H, Sonoda S, Kakiuchi N, Shinohara Y, Tomita M, et al. Objective evaluation of size and shape of the superficial foveal avascular zone in normal subjects by optical coherence tomography angiography. Scientific Reports [Internet]. 2018; 8 (1):1-9. DOI: 10.1038/s41598-018-28530-7 - 85.
Fossataro F, Cennamo G, Montorio D, Clemente L, Costagliola C. Dark halo, a new biomarker in macular neovascularization: Comparison between OCT angiography and ICGA—A pilot prospective study. Graefe's Archive for Clinical and Experimental Ophthalmology [Internet]. 2022; 260 (10):3205-3211. DOI: 10.1007/s00417-022-05693-8 - 86.
Pooja P, Stokkermans TJ. Tests for potential vision. In: StatPearls [Internet]. Treasure Island (FL): NCBI Bookshelf; 2023. Available from: https://www.ncbi.nlm.nih.gov/books/NBK587444/ - 87.
Rodrigues Neto TDS, Silva Neto EDD, Higashi AH, Megnis BP, Haddad MAO, Monteiro MLR, Zacharias LC. Normative data for macular perimetry using the MP-3 microperimeter in healthy individuals. Arquivos Brasileiros de Oftalmologia. 2023; 87 (5):1-7 - 88.
Crossland M, Jackson M-L, Seiple WH. Microperimetry: A review of fundus-related perimetry. Optometry Reports. 2012; 2 (1):2 - 89.
Squirrell D, Ehrlich R. The use of macular microperimetry in the assessment and diagnosis of macular disease. Retinal Physician. 2012; 9 :53-57 - 90.
Huang L, Fields A, Ashimatey BS, Kashani AH. The evolving role of microperimetry. Retina Specialist. 2018; 4 :22-27 - 91.
Kim L, Madeira MF. Microperimetry. In: EyeWiki [Internet]. San Francisco (CA): EyeWiki; Aug 2023. Available from: https://eyewiki.aao.org/Microperimetry - 92.
Rao HL, Hussain RSM, Januwada M, Pillutla LN, Begum VU, Chaitanya A, et al. Structural and functional assessment of macula to diagnose glaucoma. Eye. 2017; 31 :593-600 - 93.
Gella L, Nittala MG, Raman R. Retinal sensitivity in healthy Indians using microperimeter. Indian Journal of Ophthalmology. 2014; 62 (3):284-286 - 94.
Dettoraki M, Moschos MM. The role of multifocal electroretinography in the assessment of drug-induced retinopathy: A review of the literature. Ophthalmic Research. 2016; 56 (4):169-177 - 95.
Reynolds SA. Lesson_are you clear on your macular function screening responsibilities_ - 96.
Kumar UR, Ramkumar HL. Electroretinogram: EyeWiki [Internet]. American Academy of Ophthalmology. San Francisco (CA): EyeWiki; 2015. p. 1. Available from: https://eyewiki.aao.org/Electroretinogram - 97.
Maluri K, Bleau L. Multifocal ERG in practice. Review of Ophtalmology. 2004; XI :42-43 - 98.
Asanad S, Karanjia R. Multifocal Electroretinogram. In: StatPearls [Internet]. Treasure Island (FL): NCBI Bookshelf; 2022. Available from: https://www.ncbi.nlm.nih.gov/books/NBK564322/ - 99.
Wang J, Song W, Sadlak N, Fiorello MG, Desai M, Yi J. A baseline study of oxygen saturation in Parafoveal vessels using visible light optical coherence tomography. Frontiers in Medicine. 2022; 9 (May):1-7 - 100.
Türksever C, López Torres LT, Valmaggia C, Todorova MG. Retinal oxygenation in inherited diseases of the retina. Genes (Basel). 2021; 12 (2):1-17 - 101.
Bojinova RI, Schorderet DF, Valmaggia C, Türksever C, Schoetzau A, Todorova MG. Higher retinal vessel oxygen saturation: Investigating its relationship with macular edema in retinitis pigmentosa patients. Eye [Internet]. 2018; 32 (7):1209-1219. DOI: 10.1038/s41433-018-0043-1 - 102.
Olafsdottir OB, Hardarson SH, Stefansson E. Retinal oxygen levels are different in the macula compared to the periphery of the retina. Investigative Ophthalmology & Visual Science. 2018; 59 (9):4657 - 103.
Yung M, Klufas MA, Sarraf D. Clinical applications of fundus autofluorescence in retinal disease. International Journal of Retina and Vitreous. 2016; 2 (1):1-25 - 104.
Tsang SH, Sharma T. Fundus autofluorescence. Advances in Experimental Medicine and Biology. 2018; 1085 :15-16 - 105.
Jalalizadeh R, Durrani AK. Retinal physician - Fundus autofluorescence: An emerging window on the retina [Internet]. Available from: https://www.retinalphysician.com/issues/2013/april-2013/fundus-autofluorescence-an-emerging-window-on-the - 106.
Grillo LM, Wang DL, Ramachandran R, Ehrlich AC, De Moraes CG, Ritch R, et al. The 24-2 visual field test misses central macular damage confirmed by the 10-2 visual field test and optical coherence tomography. Translational Vision Science & Technology. 2016; 5 (2):4-10 - 107.
Adelman RA, Pahk P. Visual field defects in Chorioretinal disorders. In: Thomas W, editor. Visual Fields. 3rd ed. New York: Oxford Academic; 2010. pp. 207-232 - 108.
Novais EA, Baumal CR, Sarraf D, Freund KB, Duker JS. Multimodal imaging in retinal disease: A consensus definition. Ophthalmic Surgery, Lasers & Imaging Retina. 2016; 47 (3):201-205. DOI: 10.3928/23258160-20160229-01 - 109.
Weissman NJ, Soman P, Shah DJ. Multimodality imaging: Opportunities and challenges. JACC: Cardiovascular Imaging. 2013; 6 (9):1022-1023. DOI: 10.1016/j.jcmg.2013.07.003 - 110.
Fox K, Achenbach S, Bax J, Cosyns B, Delgado V, Dweck MR, et al. Multimodality imaging in cardiology: A statement on behalf of the task force on multimodality imaging of the European association of cardiovascular imaging. European Heart Journal. 2019; 40 (6):553-558. DOI: 10.1093/eurheartj/ehy669 - 111.
Acón D, Wu L. Multimodal imaging in diabetic macular edema. Asia-Pacific Journal of Ophthalmology (Philadelphia, PA.). 2018; 7 (1):22-27. DOI: 10.22608/APO.2017504. Epub 2017 Jan 29 - 112.
Garrity ST, Sarraf D, Freund KB, Sadda SR. Multimodal imaging of non neovascular age-related macular degeneration. Investigative Ophthalmology & Visual Science. 20 Mar 2018; 59 (4):AMD48-AMD64. DOI: 10.1167/iovs.18-24158 - 113.
Nguyen VP, Zhu T, Henry J, Zhang W, Wang X, Paulus YM. Multimodal in vivo imaging of retinal and choroidal vascular occlusion. Photonics. 2022; 9 (3):201. DOI: 10.3390/photonics9030201. Epub 2022 Mar 21 - 114.
Yeung L, Lima VC, Garcia P, Landa G, Rosen RB. Correlation between spectral domain optical coherence tomography findings and fluorescein angiography patterns in diabetic macular edema. Ophthalmology. 2009; 116 (6):1158-1167. DOI: 10.1016/j.ophtha.2008.12.063. Epub 2009 Apr 23 - 115.
Ogbedo E, Chukwuebuka UV, Okonkwo ON. An introduction to adaptive optics. Nigerian Journal of Vitreoretinal Diseases. 2020; 3 (1):19-26. DOI: 10.4103/2222-2222.352613 - 116.
Morgan JIW, Chui TYP, Grieve K. Twenty-five years of clinical applications using adaptive optics ophthalmoscopy [invited]. Biomedical Optics Express. 2022; 14 (1):387-428. DOI: 10.1364/BOE.472274 - 117.
Hampson KM, Turcotte R, Miller DT, Kurokawa K, Males JR, Ji N, et al. Adaptive optics for high-resolution imaging. Nature Reviews Methods Primers. 2021; 1 (1):1-26. DOI: 10.1038/s43586-021-00066-7 - 118.
Gill JS, Moosajee M, Dubis AM. Cellular imaging of inherited retinal diseases using adaptive optics. Eye (London, England). 2019; 33 (11):1683-1698. DOI: 10.1038/s41433-019-0474-3 - 119.
Burns SA, Elsner AE, Sapoznik KA, Warner RL, Gast TJ. Adaptive optics imaging of the human retina. Progress in Retinal and Eye Research. 2019; 68 :1-30. DOI: 10.1016/j.preteyeres.2018.08.002 - 120.
Georgiou M, Kalitzeos A, Patterson EJ, Dubra A, Carroll J, Michaelides M. Adaptive optics imaging of inherited retinal diseases. The British Journal of Ophthalmology. 2018; 102 (8):1028-1035. DOI: 10.1136/bjophthalmol-2017-311328 - 121.
Rossi EA, Chung M, Dubra A, Hunter JJ, Merigan WH, Williams DR. Imaging retinal mosaics in the living eye. Eye (London, England). 2011; 25 (3):301-308. DOI: 10.1038/eye.2010.221 - 122.
Talcott KE, Ratnam K, Sundquist SM, et al. Longitudinal study of cone photoreceptors during retinal degeneration and in response to ciliary neurotrophic factor treatment. Investigative Ophthalmology & Visual Science. 2011; 52 :2219-2226 - 123.
Paques M, Meimon S, Rossant F, Rosenbaum D, Mrejen S, Sennlaub F, et al. Adaptive optics ophthalmoscopy: Application to age-related macular degeneration and vascular diseases. Progress in Retinal and Eye Research. 2018; 66 :1-16. DOI: 10.1016/j.preteyeres.2018.07.001. Epub 2018 Jul 17 - 124.
Bakker E, Dikland FA, van Bakel R, Andrade De Jesus D, Sánchez Brea L, Klein S, et al. Adaptive optics ophthalmoscopy: A systematic review of vascular biomarkers. Survey of Ophthalmology. 2022; 67 (2):369-387. DOI: 10.1016/j.survophthal.2021.05.012 - 125.
Ferro Desideri L, Rutigliani C, Corazza P, Nastasi A, Roda M, Nicolo M, et al. The upcoming role of artificial intelligence (AI) for retinal and glaucomatous diseases. Journal of Optometry. 2022; 15 (Suppl. 1):S50-S57. DOI: 10.1016/j.optom.2022.08.001. Epub 2022 Oct 8 - 126.
Schmidt-Erfurth U, Sadeghipour A, Gerendas BS, Waldstein SM, Bogunović H. Artificial intelligence in retina. Progress in Retinal and Eye Research. 2018; 67 :1-29. DOI: 10.1016/j.preteyeres.2018.07.004. Epub 2018 Aug 1 - 127.
Balyen L, Peto T. Promising artificial intelligence-machine learning-deep learning algorithms in ophthalmology. Asia-Pacific Journal of Ophthalmology (Philadelphia, PA.). 2019; 8 (3):264-272. DOI: 10.22608/APO.2018479. Epub 2019 May 31 - 128.
Shah P, Mishra DK, Shanmugam MP, Doshi B, Jayaraj H, Ramanjulu R. Validation of deep convolutional neural network-based algorithm for detection of diabetic retinopathy - Artificial intelligence versus clinician for screening. Indian Journal of Ophthalmology. 2020; 68 (2):398-405. DOI: 10.4103/ijo.IJO_966_19 - 129.
Krause J, Gulshan V, Rahimy E, Karth P, Widner K, Corrado GS, et al. Grader variability and the importance of reference standards for evaluating machine learning models for diabetic retinopathy. Ophthalmology. 2018; 125 (8):1264-1272 - 130.
Bellemo V, Lim ZW, Lim G, Nguyen QD, Xie Y, Yip MYT, et al. Artificial intelligence using deep learning to screen for referable and vision-threatening diabetic retinopathy in Africa: A clinical validation study. The Lancet. Digital Health. 2019; 1 (1):e35-e44. DOI: 10.1016/S2589-7500(19)30004-4. Epub 2019 May 2 - 131.
Dutt S, Sivaraman A, Savoy F, Rajalakshmi R. Insights into the growing popularity of artificial intelligence in ophthalmology. Indian Journal of Ophthalmology. 2020; 68 (7):1339-1346. DOI: 10.4103/ijo.IJO_1754_19 - 132.
Kapoor R, Whigham BT, Al-Aswad LA. Artificial intelligence and optical coherence tomography imaging. Asia-Pacific Journal of Ophthalmology (Philadelphia, PA.). 2019; 8 (2):187-194. DOI: 10.22608/APO.201904. Epub 2019 Apr 18 - 133.
Hwang DK, Hsu CC, Chang KJ, Chao D, Sun CH, Jheng YC, et al. Artificial intelligence-based decision-making for age-related macular degeneration. Theranostics. 2019; 9 (1):232 - 134.
Yoo TK, Choi JY, Seo JG, Ramasubramanian B, Selvaperumal S, Kim DW. The possibility of the combination of OCT and fundus images for improving the diagnostic accuracy of deep learning for age-related macular degeneration: A preliminary experiment. Medical & Biological Engineering & Computing. 2019; 57 (3):677-687. DOI: 10.1007/s11517-018-1915-z. Epub 2018 Oct 22 - 135.
Hormel TT, Hwang TS, Bailey ST, Wilson DJ, Huang D, Jia Y. Artificial intelligence in OCT angiography. Progress in Retinal and Eye Research. 2021; 85 :100965. DOI: 10.1016/j.preteyeres.2021.100965. Epub 2021 Mar 22 - 136.
Kalra G, Zarranz-Ventura J, Chahal R, Bernal-Morales C, Lupidi M, Chhablani J. Optical coherence tomography (OCT) angiolytics: A review of OCT angiography quantitative biomarkers. Survey of Ophthalmology. 2022; 67 (4):1118-1134. DOI: 10.1016/j.survophthal.2021.11.002. Epub 2021 Nov 5 - 137.
Anegondi N, Gao SS, Steffen V, Spaide RF, Sadda SR, Holz FG, et al. Deep learning to predict geographic atrophy area and growth rate from multimodal imaging. Ophthalmology. Retina. 2023; 7 (3):243-252. DOI: 10.1016/j.oret.2022.08.018. Epub 2022 Aug 28 - 138.
Spaide T, Jiang J, Patil J, Anegondi N, Steffen V, Kawczynski MG, et al. Geographic atrophy segmentation using multimodal deep learning. Translational Vision Science & Technology. 2023; 12 (7):10. DOI: 10.1167/tvst.12.7.10 - 139.
Pekala M, Joshi N, Liu TYA, Bressler NM, DeBuc DC, Burlina P. Deep learning based retinal OCT segmentation. Computers in Biology and Medicine. 2019; 114 :103445. DOI: 10.1016/j.compbiomed.2019.103445. Epub 2019 Sep 17 - 140.
Moraes G, Fu DJ, Wilson M, Khalid H, Wagner SK, Korot E, et al. Quantitative analysis of OCT for neovascular age-related macular degeneration using deep learning. Ophthalmology. 2021; 128 (5):693-705. DOI: 10.1016/j.ophtha.2020.09.025. Epub 2020 Sep 24 - 141.
Jin K, Ye J. Artificial intelligence and deep learning in ophthalmology: Current status and future perspectives. Advances in Ophthalmology Practice and Research. 2022; 2 (3):100078. DOI: 10.1016/j.aopr.2022.100078 - 142.
Hong IH, Jung WH, Lee JH, Chang IB. Macular pigment optical density in the Korean population: A cross sectional study. Journal of Korean Medical Science. 2020; 35 (5):e30. DOI: 10.3346/jkms.2020.35.e30 - 143.
Christaras D, Ginis H, Pennos A, Mompean J, Artal P. Objective method for measuring the macular pigment optical density in the eye. Biomedical Optics Express. 2019; 10 (7):3572-3583. DOI: 10.1364/BOE.10.003572 [Accessed: November 11, 2023] - 144.
Zhou Y, Yao J, Wang LV. Tutorial on photoacoustic tomography. Journal of Biomedical Optics. 2016; 21 (6):61007. DOI: 10.1117/1.JBO.21.6.061007 - 145.
Hosseinaee Z, Pellegrino N, Abbasi N, Amiri T, Simmons JAT, Fieguth P, et al. In-vivo functional and structural retinal imaging using multiwavelength photoacoustic remote sensing microscopy. Scientific Reports. 2022; 12 (1):4562. DOI: 10.1038/s41598-022-08508-2. Erratum in: Sci Rep. 2022 Mar 29;12(1):5318 - 146.
Liu X, Liu T, Wen R, Li Y, Puliafito CA, Zhang HF, et al. Optical coherence photoacoustic microscopy for in vivo multimodal retinal imaging. Optics Letters. 2015; 40 (7):1370-1373. DOI: 10.1364/OL.40.001370 - 147.
Zhang HF, Maslov K, Stoica G, Wang LV. Functional photoacoustic microscopy for high-resolution and noninvasive in vivo imaging. Nature Biotechnology. 2006; 24 (7):848-851. DOI: 10.1038/nbt1220. Epub 2006 Jun 25 - 148.
Yao J, Wang LV. Photoacoustic microscopy. Laser & Photonics Reviews. 1 Sep 2013; 7 (5). DOI: 10.1002/lpor.201200060 - 149.
Okonkwo ON, Agweye CT, Akanbi T. Neuroprotection for nonarteritic central retinal artery occlusion: Lessons from acute ischemic stroke. Clinical Ophthalmology. 2023; 17 :1531-1543. DOI: 10.2147/OPTH.S403433 - 150.
Jiang M, Zhang X, Puliafito CA, Zhang HF, Jiao S. Adaptive optics photoacoustic microscopy. Optics Express. 2010; 18 (21):21770-21776. DOI: 10.1364/OE.18.021770 - 151.
Li Y, Zhang W, Nguyen VP, Khan NW, Xia X, Wang X, et al. Retinal safety evaluation of photoacoustic microscopy. Experimental Eye Research. 2021; 202 :108368. DOI: 10.1016/j.exer.2020.108368. Epub 2020 Nov 24 - 152.
Dysli C, Wolf S, Berezin MY, Sauer L, Hammer M, Zinkernagel MS. Fluorescence lifetime imaging ophthalmoscopy. Progress in Retinal and Eye Research. 2017; 60 :120-143. DOI: 10.1016/j.preteyeres.2017.06.005. Epub 2017 Jun 30 - 153.
Sauer L, Andersen KM, Dysli C, Zinkernagel MS, Bernstein PS, Hammer M. Review of clinical approaches in fluorescence lifetime imaging ophthalmoscopy. Journal of Biomedical Optics. 2018; 23, 9 :1-20. DOI: 10.1117/1.JBO.23.9.091415. Erratum in: J Biomed Opt. 2018 Sep;23(9):1.