 Open access peer-reviewed chapter
Abstract
In this chapter, the stability and phase transformation of B2 Ti50Pd50-xMx (M = Os, Ru, Co) alloys are investigated using density functional theory. TiPd alloy can be suitable for high-temperature shape memory applications due to its martensitic transformation capability from B2 to B19 at 823 K. It was reported that the binary Ti50Pd50 alloy is mechanically unstable at 0 K. A partial substitution of Pd with Os, Ru, or Co is investigated to determine which alloy will have the best properties. The heat of formation, density of states, and mechanical properties were determined to check the stability. The heat of formation was found to decrease with an increase in Ru and Os concentrations (condition of stability), consistent with the density of states trend. This is in contrast to Co addition, which indicates that the thermodynamic stability is not enhanced (heat of formation increases). It was also found that an increase in Os, Ru, and Co content stabilizes the Ti50Pd50 with a positive elastic shear modulus (
Keywords
- B2 Ti50Pd50-xMx
- shape memory alloys
- DFT
- stability
- phase transformation
1. Introduction
Shape-memory alloys (SMAs) are known as smart materials which exhibit unusual elastic and mechanical behaviors, such as shape memory effect and superelasticity [1]. These materials are capable of restoring their shape after being excessively deformed at low or high temperatures. SMAs undergo a reversible martensitic phase transformation upon the influence of temperature or stress field, giving rise to the shape memory effect and superelasticity [1]. Recently, SMAs are being developed to suit many applications in many fields, especially for engineering properties. The most commonly known SMAs include nickel-titanium (NiTi), nickel-titanium copper (NiTiCu)), and many other metallic alloy systems where the application temperatures do not exceed 373 K [2]. There is an increasing demand for high-temperature shape memory alloys (HTSMAs) in actuators for automobile, pipe couplings and aircraft engines, and other applications. Recently, new alloy systems which can work above that temperature have been investigated such as TiPt, TiAu, and TiPd binary systems as possible new HTSMA materials [3]. As their transformation temperatures are above 800 K and have martensitic transformations from B2 in the austenite phase to B19 in the martensite phase [4].
Ti50Pd50 systems are considered as one of the potential high-temperature shape memory alloys (HTSMA’s) due to their high martensitic transformation temperature [5, 6]. The Ti50Pd50 has two stable phases—the high-temperature phase called austenite and the low-temperature phase called martensite [7]. The Ti50Pd50 has a simple cubic CsCl-type structure (cP2, B2) at high temperatures [8], and an orthorhombic AuCd-type structure (oP4, B19) at ambient temperatures [9, 10]. Besides being lightweight and oxidation resistant, these alloys are also ductile at 823 K [11, 12]. Previously, B2 Ti50Pd50 was reported to be mechanically unstable due to negative elastic shear modulus [4, 11, 13, 14]. Furthermore, it was also reported that the strength of these alloys drop above 823 K. As a result, there is a need to establish ternary alloys to improve the properties of the binary alloy Ti50Pd50 that can be used for actuators and the aeronautics industry [15, 16]. The collapse is due to a possible phase transformation from body-centered cubic (bcc) to other tetragonal and orthorhombic phases, such as L10 and B19, similar to those reported in TiPt alloy [17]. Nonetheless, their transformation behavior has not been ascertained explicitly.
In order to enhance the transformation temperature and performance of the Ti50Pd50 SMA’s ternary alloying has been suggested. The elements such as Au, Ni, Ru, Rh, Ir, Pt, Zn, Rc, Tc, Os, and Co were reported as the best site preference for both Ti and Pd substitution with less than 50 atomic percentage (at. %), while Ag and Cd prefer the Ti substitution site in B2 Ti50Pd50 structure [18]. A high work output was shown and good workability was demonstrated by the addition of the third elements such as Ru, Ir, Pt, Co, and Ni. [19]. Previously, the addition of Ni to Ti50Pd50 has shown improvement in shape memory characteristics for Ti50Pd30Ni20 composition [11]. Furthermore, another study was conducted on the ternary alloying of TiPd with Ru addition using density functional theory (DFT)) [20]. The findings showed that the mechanical stability of Ti50Pd50 is enhanced above 25 at. % Ru. A cluster expansion approach was also used in our other study to investigate the phase stability of TiPd1-xRux and Ti1-xPdRux shape memory alloys [21]. As a result of the research, it was found that Ru prefers Ti-site compared to Pd-site, which showed better thermodynamic stability. In a previous study [22], DFTB+ code was used to develop a set of potential parameters of Ti50Pd50-xRux shape memory alloys. A set of potential parameters were developed in order to investigate the stability and transformation temperature of investigated alloys. It was found that the addition of 6.25, 18.75, and 25 at. % Ru on Ti50Pd50 reduce the transformation temperature from B19 to B2 phase.
Cobalt and other PGMs elements have been in use for the production of various components such as vanes or combustion chambers in gas turbines for their exceptional heat-resistant properties [23]. In previous studies, it was discovered that Ru increased the mechanical stability of high-temperature single-crystal superalloys and titanium-based alloys for use in jet engines [24, 25]. Due to their better temperature capabilities and reduced creep rate, these alloys will boost aircraft efficiency and increase the durability of the actuator [24]. Osmium is regularly utilized as an alloying element with other PGMs in order to enhance electricity and stiffness in medical devices and other applications [26]. The ternary alloying with Os, Ru, and Co may improve the stability and the transformation temperature to above 1000 K [27].
In this chapter, the ternary alloying of Ti50Pd50 with Os, Ru, and Co has been performed using the density functional theory approach to investigate the thermodynamic, electronic, and mechanical stability. Furthermore, the effect of Os, Ru, and Co on the ductility/brittleness has been deduced from the anisotropy ratio, which confirms the strength of the systems. The findings will provide very valuable information and practical guidance on the development of these alloys in the future.
2. Computational methodology
2.1 Density functional theory (DFT)
Density functional theory (DFT) is a quantum mechanical theory used in physics and chemistry to study the electronic structure and ground state properties of many-body systems, particularly molecules, atoms, and condensed phase. DFT was first formulated by Hohenberg and Kohn in 1964 [28], then secondly developed by Kohn and Sham in 1965 [29]. Using DFT, independent particle methods have been developed that take into account particle correlations and interactions. The ground state properties of a many-electron system are determined by an electron density that is dependent on the three spatial coordinates as follows:
where
Kohn and Sham further derived different sets of differential equations which enable the calculation of ground state density
The kinetic energy of non-interacting electron gas with density
and Eq. (2) is defined as exchange-correlation energy functional
The above equation can be rewritten in terms of an effective potential,
where
The
So, solving
The self-consistent solution is required due to the dependence of
2.2 Approximations to exchange-correlation functional
The exchange-correlation functionals used in DFT are categorized into two namely; the local density approximation (LDA) [31] and the generalized gradient approximation (GGA) [32]. These functionals are discussed in sections 2.2.1 and 2.2.2.
2.2.1 Local density approximation
The local density approximation (LDA) is an approximation in which the exchange-correlation (XC) energy function depends upon the value of the electronic density at each point in density functional theory (DFT) [31]. It was first discovered by Kohn and Sham in the context of DFT which can be expressed as:
where
where
2.2.2 Generalized gradient approximation
The GGA is known to be semi-local approximation which means that the function does not use the local density
The spin-independent form is considered in GGA but practically functional is more generally formulated in terms of spin densities
There are several GGA-based functionals that are the PBE [33], PBEsol [34], RPBE [35], BLYP [36], and AM05 [37]. PBEsol functional is a simple modification of PBE that differs only with two parameters. It is designed to improve the equilibrium properties of bulk solids and their surfaces of PBE in physics and surface science communities. The revised version of the PBE, such as the RPBE functional, is widely used in catalysis to improve the performance of PBE. In the case of AM05, it gives the best performance for applications of catalysis. The GGA-BLYP functional is widely used in the chemistry environment. Other known GGA-based functionals are meta-GGA [38], hyper-GGA, and generalized random-phase approximation. An extension of the GGA, the meta-GGA uses the kinetic energy density and its gradient as inputs to the function and gradient along with the functional density. Hyper-GGA offers an accurate treatment of correlation that goes beyond the level of LDA or GGA when using exact exchange (EXX) to deal with exchange correlation. The generalized random-phase approximation uses EXX and exact partial correlation.
In this chapter, the GGA-PBE [33] functional was used to optimize the Ti50Pd50-xMx systems as it provides accurate parameters for this material.
2.3 Computational code and implementation
2.3.1 VASP code
The Vienna Ab initio Simulation Package (VASP) code [39] was used to calculate structural, thermodynamic, electronic, and mechanical properties of ternary Ti50Pd50-xMx (M = Ru, Co, Os) alloys. VASP [39] is a computer program for carrying out ab initio quantum mechanical calculations by making use of a plane wave basis along with pseudopotentials or projector-augmented-wave (PAW) [40]. VASP can compute an approximate solution by solving the Kohn-Sham equations within DFT. In VASP, central quantities, such as one-electron orbitals, electron change density, and local potential, are expressed in the form of plane-wave basis sets. The ultra-soft pseudopotentials (US-PP) [41] or the PAW method [40] is used to describe the interactions between the electrons and an ion in VASP. The US-PP method (and the PAW method) are effective in reducing the number of plane waves per atom in transition metals and first-row elements. The code consists of two main loops namely: the outer and inner loop, where the outer loop optimizes the charge density while the inner loop optimizes the wavefunction. VASP code uses a wide range of exchange-correlation functionals such as LDA and GGA as well as Meta- and hyper-GGA and hybrid functionals. All functionals found in VASP have spin-degenerate and also spin-polarized versions.
2.3.2 Implementation
A convergence test was done before calculating any properties, this is to ensure that proper convergence is attained. As such precision was set at “accurate” to minimize errors in the calculation. Importantly, the structures were subjected to full geometry optimization (by allowing both lattice parameters and volume to vary) until the atomic forces were less than 0.01 eV/Å for the unit cell. This was done in order to prepare the structures to be at their ground state energy before determining any properties, such as elastic constants and electronic structures. The effects of exchange-correlation interaction are treated with the generalized gradient approximation (GGA) [29] of Perdew-Burke = Ernzerhof (PBE) [33] and were used with the PAW potential [40]. The strain value of 0.005 was chosen for the deformation of the lattice when calculating elastic properties. A plane-wave cutoff energy of 500 eV and a k-spacing of 0.2 were found to converge the total energy of the systems.
The input structure has a B2 phase with the space group Pm-3 m (as shown in Figure 1a, it is cubic and stable at high temperature. The positions of B2 atoms are denoted by the Pearson symbol cP2 and the prototype is CsCl with all angles being 90°. B2 TiPd experimental observed unit cell parameters are a = b = c = 3.180
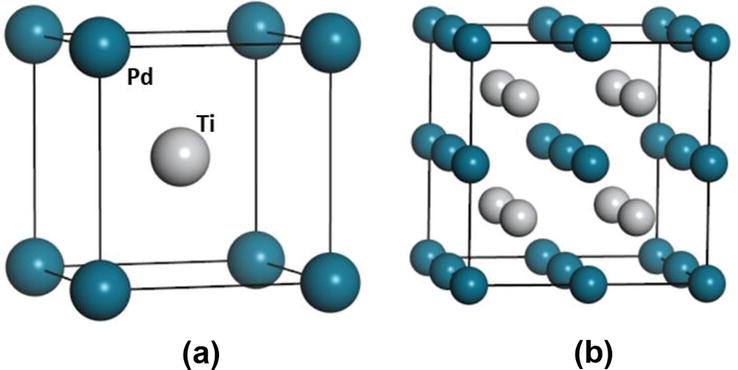
Figure 1.
(a) The B2 Ti50Pd50 structure with 2 atoms per unit cell and (b) a 2×2×2 supercell with 16 atoms per unit cell structures.
2.4 Theoretical background on calculated properties
2.4.1 Heat of formation
The heat of formation (
where
2.4.2 Density of states
The density of states (DOS) can be used to predict the electronic stability of metal alloys. It is described by a function, g (E), as the number of electrons per unit volume and energy with electron energies near E. At a specific energy level, a high DOS means many states are open for occupation. In the case of states with DOS of zero, there is no state that can be occupied.
The electrical behavior of a material is determined by the location of Ef within the DOS. Metal alloys’ stability can be predicted using the density of states (DOS). Any material’s electronic density of states can be viewed as a qualitative measure of its electronic structure. DOS is then calculated as the sum of atomic contributions. The DOS is calculated by using the following expression:
where
2.4.3 Mechanical properties
The elastic constants (Cij) contain information regarding the strength of the materials against an externally applied strain and also act as stability criteria to study structural transformations from ground-state total-energy calculations. For a structure to exist in a stable phase, certain relationships must be observed between the elastic constants. There are various criteria established to deduce the mechanical stability of crystals for different lattice crystals. Accuracy in determining the elasticity of a compound is vital in understanding its mechanical stability and elastic properties. The B2 cubic crystal system has the simplest form of a stiffness matrix, with only 3-independent elastic constants c11, c12, and c44 [43]. The mechanical stability criteria as outlined in Ref. [43] for the B2 Cubic and its alloyed structures can be expressed as follows:
The stability criterion for the elastic constants must be completely satisfied for the structure to be stable. The positive
3. Results and discussion
3.1 Structural and thermodynamic properties
In Figure 2, the calculated equilibrium lattice parameters for the B2 Ti50Pd50-xMx (M = Os, Ru, Co) systems are shown. It is observed that the partial substitution of Pd with Ru reduces the lattice parameters of the Ti50Pd50-xRux minimally (see Figure 2). This may be attributed to the small atomic radius of Ru as compared to that of Pd.
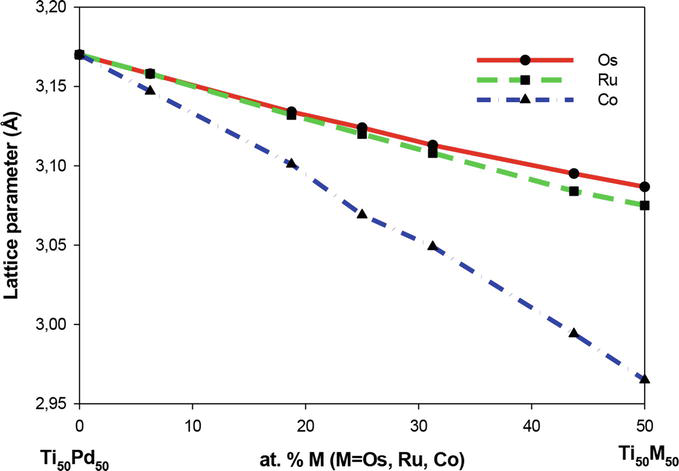
Figure 2.
The lattice parameter, a (Å) of the B2 Ti50Pd50-xMx (M=Os, Ru, Co) (0 ≤ x ≤ 50) ternary SMAs.
Furthermore, the lattice parameters of the Ti50Pd50-xMx system decrease as the Co and Os content is increased. This can be understood since the atomic radius of Pd is larger in size than Co, and Os. Recall that the lattice parameter of binary Ti50Pd50 was predicted to be 3.170 Å, which is larger than those calculated for the Ti50Pd50-xMx systems.
The heats of formation for the B2 Ti50Pd50-xMx systems are shown in Figure 3. As discussed in Section 2.4.1, the heat of formation is calculated to check the thermodynamic stability of the system. We observe that the ∆Hf decreases as Ru is increased this implies that the structure becomes stable at high Ru concentration (thermodynamically stable). Similar behavior was observed for Os as their values decrease with an increase in concentration, indicating thermodynamic stability. Furthermore, the addition of Co concentrations becomes less stable since the values of heat of formation increases as the content is increased. It is seen that Co substitution shows less stability, while the addition of Os and Ru enhances the stability of the Ti50Pd50 system at high concentration (0
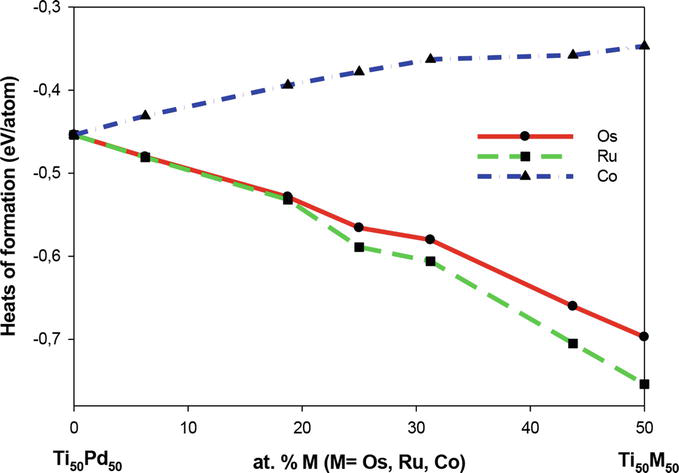
Figure 3.
Heats of formation of the B2 Ti50Pd50-xMx (M=Os, Ru, Co) (0 ≤ x ≤ 50) ternary SMAs.
3.2 Electronic total density of states (tDOS)
In order to better examine the differences in electronic structures of Ti50Pd50-xMx alloys, it is important to analyze the behavior of the total density of states (DOS) near the Fermi level (Ef) with respect to the pseudogap. It is also known from previous studies that the DOS of structures of the same composition can be used to mimic the stability trend with respect to their behavior at the Ef [17, 44, 45]. A structure is considered the most stable if it has the lowest density of state at Ef. The DOS is expressed as the number of states per atom per energy interval.
Figure 4 shows the total DOS for Ti50Pd50-xRux alloys. The structures show an overlapping peak from the valence band (VB) to the conduction band (CB) suggesting a metallic behavior since there is no visibility of a bandgap. A shift of DOS is also observed when Ru is added toward CB. As the composition of Ru is added, the pseudogap moves toward the Ef, indicating that the electronic stability is enhanced in particular for composition above 20 at. % Ru. It is noted that Ti50Ru50 has the lowest DOS at the Ef, which suggests that it is the most stable, while the Ti50Pd43.75Ru6.25 is the least stable compared to other compositions. Furthermore, it was observed that the Ef coincides with the pseudogap. This observation suggests that Ti50Pd50-xRux is electronically stable at the high content of Ru. The predicted DOS analysis is consistent with the stability trend as predicted by the ∆Hf.
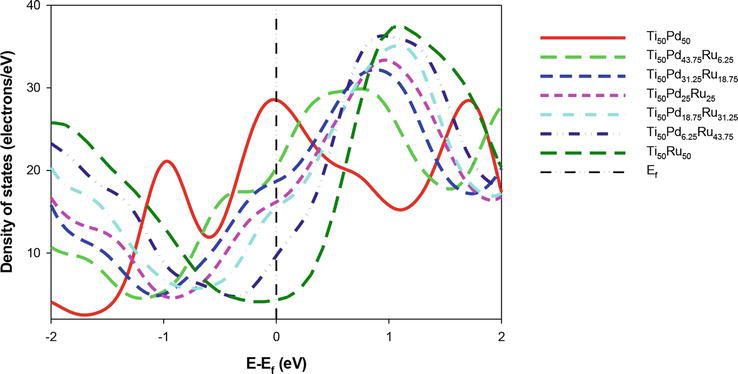
Figure 4.
Comparison of the total density of state for Ti50Pd50-xRux systems (0 ≤ x ≤ 50) against energy. The Fermi level is taken as the energy zero (E–Ef = 0).
In Figure 5, we plot the total DOS for B2 Ti50Pd50-xOsx (0 ≤ x ≤ 50) alloys. As Os content is added, the DOS for Ti50Pd43.75Os6.25 hits the peak at the shoulder near the Ef. Furthermore, at above 18.75 at. % Os, the pseudogap moves toward the Ef, which may suggest that the system starts to stabilize. It is also observed that at 50 at. % Os (Ti50Os50) has the lowest DOS near the Ef. The result suggests that Ti50Pd50-xMx is electronically stable at higher content of Os, consistent with the predicted ∆Hf.
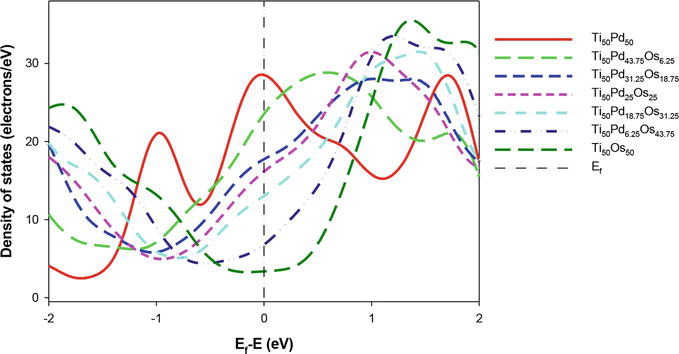
Figure 5.
Comparison of the total density of state for Ti50Pd50-xOsx systems (0 ≤ x ≤ 50) against energy. The Fermi level is taken as the energy zero (E–Ef = 0).
Figure 6 shows and compares the calculated tDOS for Ti50Pd50-xCox alloys. It is noted that as the Co content is increased the DOS hit the shoulder of the peak at Ef. The highest DOS along the Ef is observed at the high composition of Co (50 at. %), while 6.25 at. % Co has the lowest DOS peak. This observation indicates that Co is not preferable to enhancing the electronic stability of Ti50Pd50 in good agreement with the predicted ∆Hf.
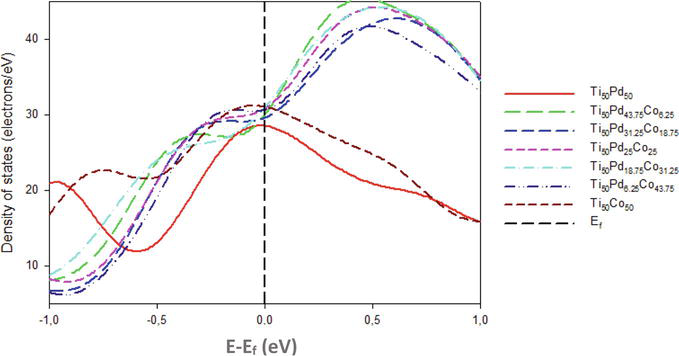
Figure 6.
Comparison of the total density of state against energy for Ti50Pd50-xCox systems (0 ≤ x ≤ 50). The Fermi level is taken as the energy zero (E–Ef = 0).
3.3 Elastic properties
The elastic constants (Cij) are important parameters, which can be used to predict mechanical stability. To further investigate the stability of Ti50Pd50-xMx, elastic constants were calculated. The stability criterion for the elastic constants must be satisfied for the structure to be defined as stable. The stability conditions for the cubic system are outlined in Section 2.4.3.
In Figure 7, the calculated elastic constants of the Ti50Pd50-xRux alloys (0
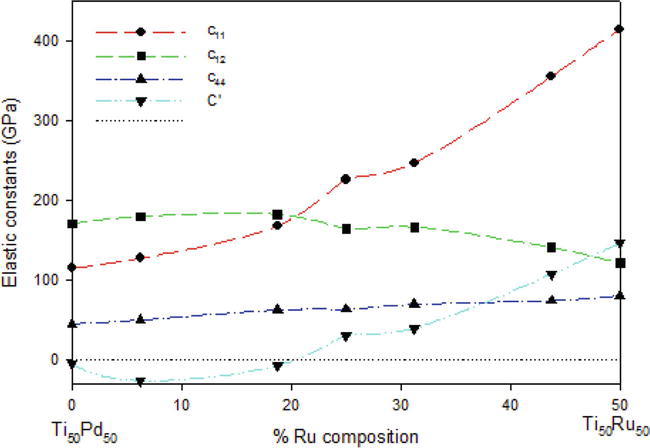
Figure 7.
The elastic constants (GPa) as a function of the atomic % Ru composition of Ti50Pd50-xRux SMAs.
However, the predicted Cij does not satisfy the stability criteria for Ti50Pd50-xRux (when x = 6.25 and 18.75) since c11 is less than c12 which resulted in negative elastic shear modulus (
The calculated elastic properties of the Ti50Pd50-xOsx alloys (0
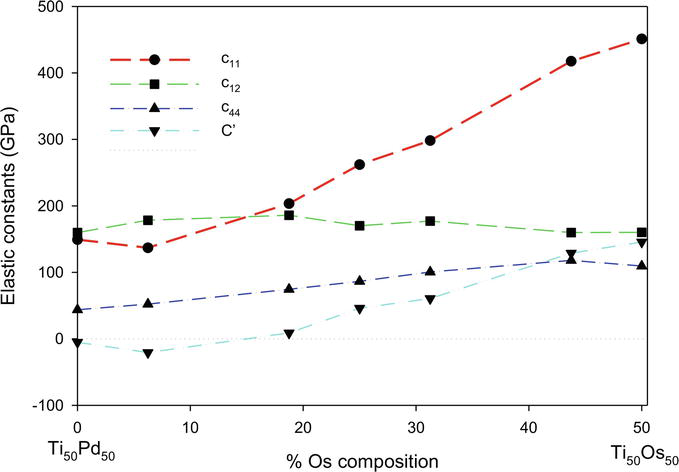
Figure 8.
The elastic constants (GPa) as a function of the atomic % Os composition of Ti50Pd50-xOsx SMAs.
Figure 9 shows the comparison of elastic constant c11 and the c12 for the Ti50Pd50-xCox at different concentrations. From the results, it is noted that the c11 is less than c12 below 25 at. % Co, which suggests instability at those compositions. It is clearly seen that the
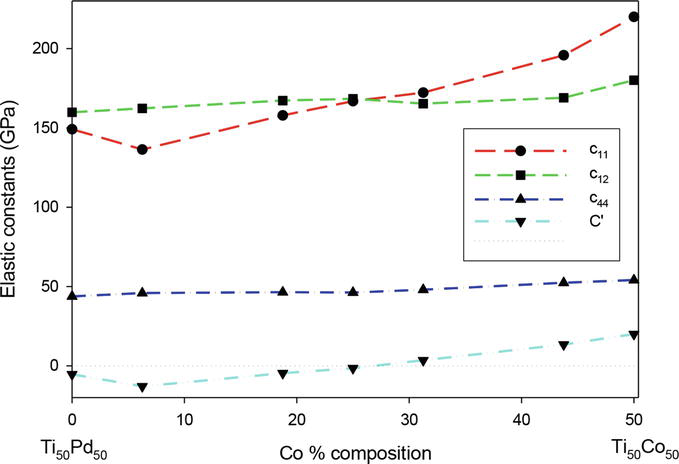
Figure 9.
Elastic constants (GPa) as a function of atomic percent Co for Ti50Pd50-xCox where 0 ≤ x ≤ 50.
3.4 Anisotropy ratio
This section focuses on the anisotropy ratio to describe isotropic behavior and transformation as well as the ductility of the Ti50Pd50-xMx systems.
3.4.1 Isotropic and anisotropy behavior
It is important to study the elastic anisotropy of the systems in order to understand material properties and improve their mechanical durability. The anisotropy can be calculated as:
The factor
The anisotropic plot depicts anisotropic behavior below 25 at. % for Ru, Os, and Co additions. However,
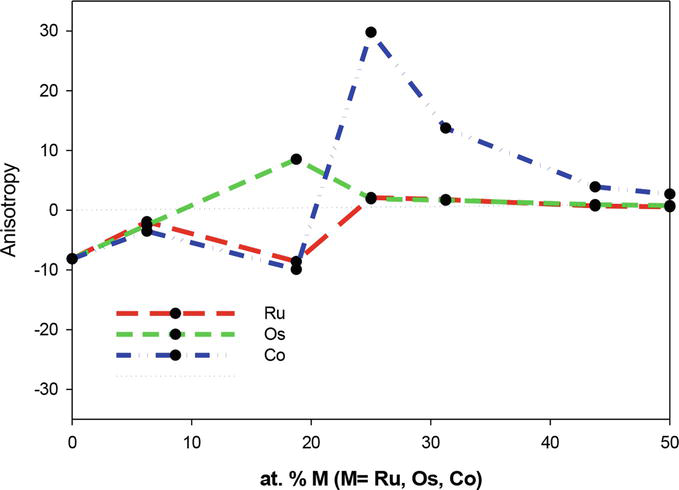
Figure 10.
Anisotropy as a function of atomic percent M (M=Os, Ru, Co) for Ti50Pd50-xMx where 0 ≤ x ≤ 50.
3.4.2 Anisotropy and martensite transformation
An anisotropy ratio (
In Figure 10, a higher value of
Previously, Yi et al. [48] indicated that the c44 and
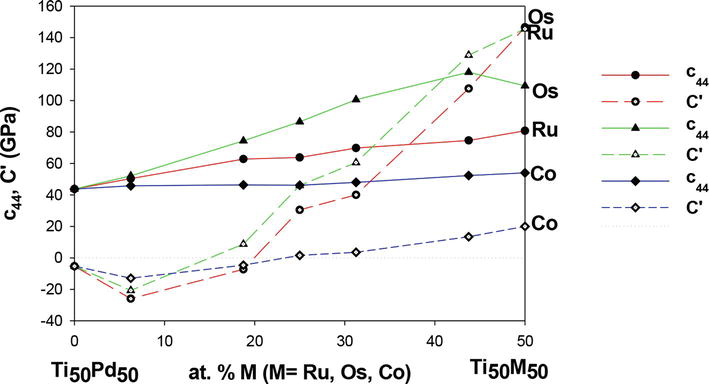
Figure 11.
The elastic constants c44 and C′ against the composition of Ti50Pd50-xMx alloys.
3.4.3 Anisotropy and ductility
The calculated
4. Conclusions
Ab initio DFT approach was used to study the equilibrium lattice parameters, heat of formation, and elastic properties of Ti50Pd50-xMx as potential HTSMAs. Our results of lattice parameters were found to be in good agreement to within 5% with the available experimental and theoretical values. Ternary alloying with Os, Ru, and Co were investigated. The results suggested that the addition of Ru and Os stabilizes the Ti50Pd50 structure since the heat of formation decrease with composition (
The effect of ternary addition revealed that Ti50Pd50-xOsx alloys are mechanically stable above 18.75 at. % Os according to the criteria of mechanical stability. Furthermore, the
An elastic anisotropy ratio (
The ductile nature of Ti50Pd50-xMx alloys was confirmed by the value of anisotropy. It was revealed that increasing Os and Ru above 6.25 at. % could effectively improve the ductility of the compound. Furthermore, the anisotropy ratios were found greater than 0.8 above 18.75 at. % Os and Co, which reveal ductility behavior.
Acknowledgments
The computational work was carried out using computer resources at the Materials Modeling Center, University of Limpopo. The authors acknowledge the High-Performance Computing (CHPC) in Cape Town for their computing resources. The support of the South African Research Chair Initiative of the Department of Science and Technology is highly appreciated.
References
- 1.
Jani JM, Leary M, Subi A, Gibson MA. A review of shape memory alloy research, applications and opportunities. Materials and Design. 2014; 56 :1078-1113 - 2.
Melton KN, Otsuka K, Wayman CM. General applications of SMA’s and smart materials. In: Shape Memory Materials. Cambridge: Cambridge University Press; 1998. pp. 220-239 - 3.
Yamabe-Mitarai Y, Arockiakumar R, Wadood A, Suresh KS, Kitashima T, Hara T, et al. Ti(Pt, Pd, Au) based high temperature. Materials Today: Proceedings. 2015; 2 :S517-S552 - 4.
Donkersloot HC, Van Vucht JHN. Martensitic transformations in gold-titanium, palladium-titanium and platinum-titanium alloys near the equiatomic composition. Journal of Less Common Metals. 1970; 20 :83-91 - 5.
Solomon VC, Nishida M. Martensitic transformation in Ti-rich Ti–Pd shape memory alloys. Materials Transactions. 2002; 43 :908-915 - 6.
Hisada S, Matsuda M, Yamabe-Mitarai Y. Shape change and crystal orientation of B19 martensite in equiatomic TiPd alloy by isobaric test. Metabolism. 2020; 10 :3754 - 7.
Golberg D, Xu Y, Murakami Y, Otsuka K, Ueki T, Horikawa H. High-temperature shape memory effect in Ti50Pd50-xNix (x = 10, 15, 20) alloys. Intermetallics. 1995; 22 :241-248 - 8.
Nishida M, Hara T, Morizono Y, Ikeya A, Kijima H, Chiba A. Transmission electron microscopy of twins in martensite in Ti-Pd shape memory alloy. Acta Materialia. 1997; 45 :4847-4853 - 9.
Guo C, Li M, Li C, Du Z. A thermodynamic modeling of the Pd–Ti system. Calphad. 2011; 23 :512-517 - 10.
Dwight AE, Conner RA Jr, Downey JW. Equiatomic compounds of the transition and lanthanide elements with Rh, Ir, Ni and Pt. Acta Crystallographica. 1965; 18 :835-839 - 11.
Golberg D, Xu Y, Murakami Y, Morito S, Otsuka K. Characteristics of Ti50Pd30Ni20 high-temperature shape memory alloy. Intermetallics. 1995; 3 :35-46 - 12.
Huang X, Karin M, Ackland J. First-Principles Study of the structural energetics of PdTi and PtTi. Physical Review B. 2003; 67 :024101-024107 - 13.
Yamabe-Mitarai Y. TiPd- and TiPt-based high-temperature shape memory alloys: A review on recent advances. Metabolism. 2020; 10 :1531-1552 - 14.
Otsuka K, Oda K, Ueno Y, Piao M, Ueki T, Horikawa H. The shape memory effect in a Ti50Pd50 alloy. Scripta Metallugica et Materialia. 1993; 29 :1355-1358 - 15.
Diale RG, Modiba R, Ngoepe PE, Chauke HR. Density functional theory study of TiPd alloying with Os as potential high temperature shape memory alloys. IOP Conference Series in Material Science and Engineering. 2019; 655 :012042 - 16.
Bozzolo G, Mosca HO, Noebe RD. Phase structure and site preference behavior of ternary alloying additions to PdTi and PtTi shape-memory alloys. Intermetallics. 2007; 15 :901-911 - 17.
Mahlangu R, Phasha MJ, Chauke HR, Ngoepe PE. Structural, elastic and electronic properties of equiatomic PtTi as potential high-temperature shape memory alloy. Intermetallics. 2013; 33 :27-32 - 18.
Otsuka K, Ren X. Recent developments in the research of shape memory alloys. Intermetallics. 1999; 7 :511-528 - 19.
Baldwin E, Thomas B, Lee JW, Rabiei A. Processing TiPdNi base thin-filmshape memory alloys using ion beam assisted deposition. Surface and Coating Technology. 2005; 200 :2571-2579 - 20.
Diale RG, Modiba R, Ngoepe PE, Chauke HR. The effect of Ru on Ti50Pd50 high temperature shape memory alloy: A first-principles study. MRS Advance. 2019; 4 :2419-2429 - 21.
Diale RG, Modiba R, Ngoepe PE, Chauke HR. Phase stability of TiPd1-xRux and Ti1-xPdRux shape memory alloys. Materials Today: Proceedings. 2021; 38 :1071-1076 - 22.
Diale RG, Ngoepe PE, Chauke HR. Self-consistent charge density functional tight-binding (SCC-DFTB) parameterization and validation for Ti50Pd50-XRuX alloys. Computational Materials Science. 2023; 218 :111988 - 23.
Coutsouradis D, Davin A, Lamberigts M. Cobalt-based superalloys for applications in gas turbines. Materials Science and Engineering. 1987; 88 :11-19 - 24.
Haynes WM, editor. CRC Handbook of Chemistry and Physics. 92nd ed. Boca Raton: CRC Press; 2011: 2656 - 25.
Jahn’atek M, Levy O, Hart GLW, Nelson LJ, Chepulskii RV, Xue J, et al. Ordered phases in ruthenium binary alloys from high-throughput first-principles calculations. Physical Review B. 2011; 84 :214110-214,118 - 26.
Haynes WM, editor. CRC Handbook of Chemistry and Physics. 92nd ed. CRC Press; - 27.
Kumar PK, Lagoudas DC, Zanca J, Lagouda MZ. Thermomechanical characterization of high temperature SMA actuators. Proceedings of SPIE. 2006; 6170 :306-312 - 28.
Hohenberg P, Kohn W. Inhomogeneous electron gas. Physical Review B. 1964; 136 :B864-B871 - 29.
Kohn W, Sham LJ. Self-consistent equations including exchange and correlation effects. Physical Review A. 1965; 140 :A1133-A1138 - 30.
Mattson AE, Schultz PA, Desjarlais MP, Mattsson TR, Leung K. Designing meaningful density functional theory calculations in materials science—A primer. Materials Science and Engineering. 2005; 13 :R1-R32 - 31.
Hedin L, Lundqvist BI. Explicit local exchange-correlation potentials. Journal of Physics C. 1971; 4 :2064-2082 - 32.
Perdew JP, Wang Y. Accurate and simple analytic representation of the electron-gas correlation energy. Physical Review B. 1992; 45 :13244-13,249 - 33.
Perdew JP, Burke K, Ernzerhof M. Generalized gradient approximation made simple. Physical Review Letters. 1996; 77 :3865-3868 - 34.
Perdew JP, Ruzsinszky A, Csonka GI, Vy-drov OA, Scuseria GE, Constantin LA, et al. Restoring the density-gradient expansion forexchange in solids and surfaces. Physical Review Letters. 2008; 100 :136406 - 35.
Hammer B, Hansen LB, Nørskov JK. Improved adsorption energetics within density-functionaltheory using revised Perdew-Burke-Ernzerhof functionals. Physical Review B. 1999; 59 :7413 - 36.
Peter M, Gill W, Johnson BG, Pople JA, Frisch MJ. The performance of the Becke-Lee-Yang-Parr (B-LYP) density functional theory with various ba-sis sets. Chemical Physics Letters. 1992; 197 :499 - 37.
Armiento R, Mattsson AE. Functional designed toinclude surface effects in self-consistent density functional theory. Physical Review B. 2005; 72 :085108 - 38.
Tao J, Perdew JP, Staroverov VN, Scuseria GE. Climbing the density functional ladder: nonempirical meta-generalized gradient approximation designed for molecules and solids. Physical Review Letters. 2003; 91 :146401 - 39.
Kresse G, Furthmüller J. Efficient Iterative Schemes for Ab-initio Total-energy Calculations Using a Plane-wave Basis Set. Physical Review B. 1996; 54 :11169-11,186 - 40.
Blöchl PE. Projector augmented-wave method. Physical Review B. 1994; 50 :17953-17,979 - 41.
Vandebilt D. Soft self-consistent pseudopotentials in a generalized eigenvalue formalism. Physical Review B. 1990; 41 :7892 - 42.
Masia M, Probst M, Rey R. Ethylene carbonate- Li+: A theoretical study of structural and vibrational properties in gas and liquid phases. The Journal of Physical Chemistry B. 2004; 108 :2016-2027 - 43.
Mehl MJ, Klein BM. First-principles calculation of elastic properties. In: Westbrook JH, Fleischer RL, editors. Intermetallic Compounds – Principles and Practice. Vol. 1. London: John Wiley and Sons, Ltd; 1994. pp. 195-210 - 44.
Gornostyrev YN, Kontsevoi OY, Maksyutov AF, Freeman AJ, Katsnelson MI, Trefilov AV, et al. Negative yield stress temperature anomaly and structural instability of Pt3Al. Physical Review B. 2004; 70 :014102 - 45.
Pankhurst DA, Nguyen-Manh D, Pettifor DG. Electronic origin of structural trends across early transition-metal disilicides: Anomalous behavior of CrSi2. Physical Review B. 2004; 69 :075113 - 46.
Tan CL, Cai W, Zhu JC. First-principles study on elastic properties and electronic structures of Ti-based binary and ternary shape memory alloys. Chinese Physics Letters. 2006; 23 :2863-2866 - 47.
Ren X, Miura N, Taniwaki L, Otsuka K, Suzuki T, Tanaka K, et al. Understanding the martensitic transformations in TiNi-based alloys by elastic constants measurement. Materials Science and Engineering A. 1999; 273–275 :190-194 - 48.
Zener C. Contributions to the theory of beta-phase alloys. Physics Review. 1947; 71 :846-851 - 49.
Gschneidner K et al. A family of ductile intermetallic compounds. Nature Materials. 2003; 2 :587-591