Open Access is an initiative that aims to make scientific research freely available to all. To date our community has made over 100 million downloads. It’s based on principles of collaboration, unobstructed discovery, and, most importantly, scientific progression. As PhD students, we found it difficult to access the research we needed, so we decided to create a new Open Access publisher that levels the playing field for scientists across the world. How? By making research easy to access, and puts the academic needs of the researchers before the business interests of publishers.
We are a community of more than 103,000 authors and editors from 3,291 institutions spanning 160 countries, including Nobel Prize winners and some of the world’s most-cited researchers. Publishing on IntechOpen allows authors to earn citations and find new collaborators, meaning more people see your work not only from your own field of study, but from other related fields too.
To purchase hard copies of this book, please contact the representative in India:
CBS Publishers & Distributors Pvt. Ltd.
www.cbspd.com
|
customercare@cbspd.com
The advent of augmented reality (AR) has introduced a new era of real-time geosimulation and analysis, particularly in urban planning, spatial design, and architecture. In this chapter, we propose a framework for using urban augmented reality model (UARM) to implement 3D geosimulation and prospective analysis of urban built environments. Our framework leverages advanced technologies, such as computer vision, 3D modeling, and machine learning, to provide a realistic and interactive representation of urban built environments. Using UARM, stakeholders can visualize and analyze the impact of proposed changes to the built environment in real-time. This paper presents the technical specifications and implementation details of our proposed framework and provides case studies demonstrating its effectiveness in urban planning and design. This paper will serve as a guideline for future research in implementation tools for virtual geographic environments (VGE).
Université de Franche-Comté, Laboratoire ThéMA UMR 6049, IUT NFC, France
*Address all correspondence to: igor.agbossou@univ-fcomte.fr
1. Introduction
The field of urban planning, spatial design, and architecture has long relied on various methods and tools to assess the impact of proposed changes in the built environment [1, 2]. However, these traditional approaches often lack interactivity [3, 4] and fail to provide stakeholders with an immersive and realistic understanding of the potential future developments [5, 6]. With the advent of augmented reality (AR) technology, there is a significant opportunity to revolutionize the way we perceive and analyze urban environments [6, 7]. Augmented reality enhances our perception of the physical world by overlaying digital information onto it, thereby providing a seamless integration of virtual and real-world elements. This technology has already made remarkable strides in entertainment and gaming [8, 9, 10, 11], but its potential for practical applications in urban planning and land use is yet to be fully explored [6, 7, 9, 11]. In this paper, we propose a framework that leverages urban augmented reality models (UARM) [12] to implement 3D geosimulation and prospective analysis in the context of urban built environments.
The main objective of this framework is to enable stakeholders, including researcher, planners, designers, and decision-makers, to visualize and analyze proposed changes to the built environment in real-time. By combining advanced technologies such as computer vision [13], 3D modeling [9], and machine learning [14, 15], the UARM framework provides a realistic and interactive representation of urban spaces. This allows stakeholders to gain a comprehensive understanding of the potential impacts of their decisions and interventions. One of the key components of the framework is computer vision, which enables the accurate detection and tracking of physical elements in the urban environment. By analyzing live video feeds or stereoscopic images, computer vision algorithms align virtual objects with the real-world context. This ensures a seamless integration of digital information within the physical space, creating an immersive experience for stakeholders. Another important aspect of the UARM framework is the use of high-fidelity 3D models of urban environments. These models capture both the geometric and semantic information of the built environment, providing a realistic representation of buildings, roads, and other urban elements. Techniques such as laser scanning, photogrammetry, and CAD modeling are employed to generate these 3D models using universal scene description (USD) schema and specifications […].
The main objective of the project was to develop a VGE [16] framework using the augmented reality application development kit (ARKit) [17, 18] for 3D geosimulation and prospective analysis. The research aimed to answer the following questions: 1) How does augmented reality enhance the accuracy and realism of 3D geosimulation in urban areas? 2) What are the effective methods to integrate real-time data into augmented reality for prospective analysis in urban planning and design? 3) How can augmented reality facilitate stakeholder engagement and participatory design in urban planning and design processes? 4)What are the challenges and opportunities of integrating augmented reality with simulation models in the urban environment?
Addressing these questions will contribute to the advancement of augmented reality in 3D geosimulation and prospective analysis of urban areas, leading to improved decision-making, increased stakeholder engagement, and sustainable practices in urban planning and design. After exploring the foundations of augmented reality for urban simulation, including key concepts, enabling technologies, and the limitations of traditional approaches in Section 2, we will clarify and discuss the settings of the experimental application of UARM, focusing on the urban built environment geosimulation area and the use of sensors for data acquisition in Section 3. We present in Section 4, scenario-based prospective analysis results, highlighting the advancements in urban planning through green spaces and urban ecology, as well as urban sustainability through energy-efficient interventions. Section 6 concludes this chapter and future work.
2. Foundations of augmented reality for urban simulation
In recent years, geosimulation based on VGE framework has emerged as a valuable approach in urban planning and design, enabling the simulation and analysis of complex urban systems [19, 20, 21]. Geosimulation combines geospatial data, computer modeling, and simulation techniques to replicate and study the dynamics of urban environments. It provides a powerful tool for understanding the complex interactions between various elements of the urban environment, including buildings, transportation systems, and human activities. One of the key applications of geosimulation in urban planning is scenario modeling. By simulating different scenarios, planners and designers can explore the potential impacts of various interventions and policies on the urban landscape. It allows stakeholders to assess factors such as population dynamics, land use changes, transportation patterns, and environmental impacts, providing valuable insights for decision-making. With the advancement of remote sensing technologies and data collection techniques, geospatial data has become more accessible and comprehensive. This wealth of data allows for the creation of realistic 3D models, which serve as the basis for UARM in urban augmented reality applications. The integration of geosimulation and augmented reality offers a unique opportunity to bridge the gap between virtual simulations and the physical world. By overlaying digital information onto the real-world context, augmented reality enhances the understanding and perception of urban simulations. Indeed, AR has emerged as a powerful technology that enhances our perception and interaction with the physical world by overlaying digital information onto real-world environments. In the context of urban simulation, AR offers unique opportunities to visualize, analyze, and interact with urban environments in real-time.
2.1 Definition and key concepts
AR refers to a technology that overlays digital information, such as images, videos, or 3D models, onto the real-world environment, enhancing the user’s perception and interaction with their surroundings. Unlike virtual reality, which immerses users in a completely virtual environment, augmented reality supplements the physical world with digital content, creating a blended experience. AR applications typically rely on devices such as smartphones, tablets, smart glasses, or headsets to deliver the augmented experience to users. These devices incorporate cameras, sensors, and displays to capture and augment the real-world environment in real-time. Two fundamental concepts in augmented reality are registration and tracking. Registration involves aligning virtual objects with the real-world context, ensuring they appear in the correct position and orientation. Tracking involves continuously monitoring the user’s viewpoint and the physical environment to maintain the spatial consistency of the augmented content.
2.2 Technologies enabling urban augmented reality
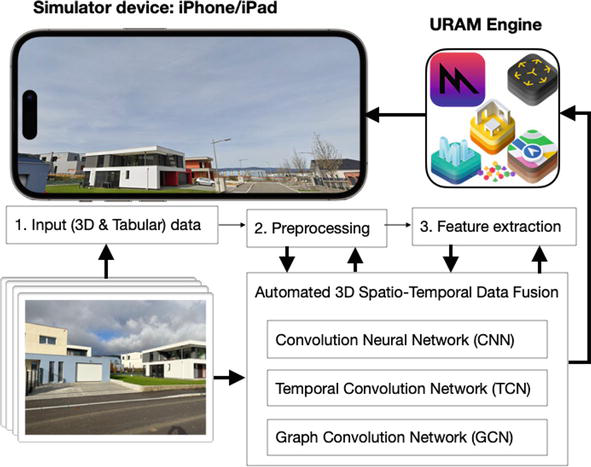
Several technologies contribute to the development and implementation of augmented reality systems. Understanding these technologies is crucial for designing effective urban augmented reality solutions. Computer vision […] plays a vital role in AR by enabling the recognition and understanding of the physical environment. It involves the analysis of visual data [6, 13, 22], such as images or video streams, to detect and track objects, estimate their pose, and extract relevant features [22, 23, 24]. Computer vision algorithms facilitate the registration of virtual objects in the real world, allowing for seamless integration and interaction. Accurate and detailed 3D models of the urban environment are essential for realistic and contextually relevant augmentations. Techniques such as laser scanning [12], photogrammetry [12], and CAD modeling enable the creation of high-fidelity 3D models [1, 25]. These models capture the geometric and semantic information of buildings, streets, and other urban elements, forming the foundation for precise and visually consistent augmentations [18, 22, 26]. Machine learning techniques [14, 15, 22, 24] play a crucial role in augmenting reality. They enable object recognition [12, 24], semantic understanding, and real-time tracking. Machine learning algorithms can be trained to recognize and classify urban objects, allowing for intelligent augmentations and predictive analysis [27]. Furthermore, AI-based algorithms can adapt and improve over time, enhancing the accuracy and effectiveness of augmented reality systems. The integration of augmented reality with urban and spatial computing offers new possibilities for analyzing and simulating the built environment. Urban and spatial computing focuses on the interactions between humans, their physical environment, and digital information systems. By combining augmented reality with urban and spatial computing, stakeholders in urban planning and design can visualize and analyze proposed changes to the built environment in real-time. The foundations of augmented reality and its integration with urban and spatial computing offer immense potential for enhancing the field of urban planning, spatial design, and architecture. Figure 1 illustrates the different components of the process underlying the UARM for prospective analysis.
Figure 1.
Urban augmented reality modeling process components.
2.3 Urban prospective analysis and traditional approaches limitations
Urban prospective analysis plays a crucial role in understanding the potential impacts of urban planning and design interventions on the future development of cities. By assessing different scenarios and evaluating their implications, decision-makers can make informed choices to shape sustainable and resilient urban environments. However, traditionalpproaches to prospective analysis in urban planning and design have several limitations that can be overcome by leveraging augmented reality and 3D geosimulation. In Table 1, we expose the limitations of traditional approaches and discuss how augmented reality can address these challenges.
Traditional approaches limitations
Role of AR in addressing limitations
Lack of Visual Realism
Traditional prospective analysis methods often rely on 2D maps, diagrams, or static renderings to visualize future scenarios. This limited visual representation can make it challenging for stakeholders to fully comprehend and evaluate the proposed interventions. It may lead to misunderstandings or overlooking critical aspects of the design, hindering effective decision-making.
Enhanced Visual Realism
AR can overcome the lack of visual realism in traditional prospective analysis methods. By overlaying virtual content onto the physical environment, augmented reality provides a more immersive and realistic representation of future scenarios. Stakeholders can visualize proposed interventions as if they already exist in the real world, enabling them to better understand and evaluate the potential outcomes.
Difficulty in Spatial Contextualization
Traditional prospective analysis methods often struggle to provide a comprehensive spatial contextualization of proposed interventions. 2D representations fail to capture the three-dimensional nature of urban environments, making it challenging to assess the impact of interventions on the existing built environment, transportation networks, and open spaces. This limitation restricts the ability to evaluate design alternatives in their proper spatial context.
Spatial Contextualization
Coupled with 3D geosimulation, AR enables the integration of proposed interventions into the existing urban fabric. Stakeholders can experience the design in its proper spatial context, observing how it interacts with surrounding buildings, infrastructure, and natural elements. This spatial contextualization facilitates a more comprehensive understanding of the design’s impact on the urban environment.
Limited Stakeholder Engagement
Traditional approaches to prospective analysis often lack effective stakeholder engagement. Decision-makers and stakeholders are typically presented with finalized designs or scenarios, leaving little room for meaningful participation and input. This limited engagement can lead to a lack of ownership, decreased satisfaction, and potential conflicts among stakeholders.
Improved Stakeholder Engagement
AR facilitates enhanced stakeholder engagement in prospective analysis. By providing an interactive platform, augmented reality allows stakeholders to actively participate in the design process. They can explore and manipulate virtual objects, test different scenarios, and provide real-time feedback. This participatory approach fosters collaboration, empowers stakeholders, and promotes a sense of ownership in decision-making.
Time-Intensive Iterative Process
Traditional prospective analysis methods tend to have a lengthy and resource-intensive iterative process. As stakeholders provide feedback and propose modifications, multiple iterations of analysis and redesign are required, leading to extended project timelines and increased costs. This inefficiency can impede the agility and responsiveness needed in dynamic urban planning processes.
Streamlined Iterative Process
AR can streamline the iterative process of prospective analysis. Stakeholders can make design modifications and instantly visualize their impact, reducing the time and effort required for multiple iterations. Augmented reality also supports rapid prototyping and scenario testing, enabling decision-makers to evaluate design alternatives efficiently and make timely adjustments.
Table 1.
Traditional approaches limitations and the role of AR in addressing them.
3. Experimental application of UARM for prospective analysis
Simulating large-scale urban built environment processes using physically-based rendering in 3D poses significant challenges for modern computing techniques in urban studies and regional planning [28, 29, 30, 31]. Urban systems inherently exhibit complexity [3, 19, 20, 21, 32], and simulation serves as a tool to comprehend the causes and impacts of events within these systems. Additionally, simulation enables the prediction of future states resulting from specific actions. The level of detail [29, 31, 33, 34] achieved in simulating real system behavior depends on the chosen model. More detailed models with extensive data can provide a more accurate reflection of reality, but their complexity directly affects computational time required for model changes.
3.1 Urban built environment geosimulation area
In this experimental study, our URAM framework was applied to a section of a newly constructed housing estate in Belfort, France (Figure 2). The development project comprises 25 plots ranging from 600 to 900 m2 for individual houses. It’s called “Jardins du MONT,” and depicts a contemporary with high-quality architectural design, conveniently located within a 10-minute travel distance from the city center of Belfort via car, bus, or bike. It is also situated within a short walking distance from the bustling “Techn’Hom” business park, which houses major companies such as GE and Alstom. The area offers a serene and green urban environment, providing exceptional views of Belfort and its fortifications.
Figure 2.
Experimental study area “Jardins du MONT”, Belfort (France).
The research work undertaken in this study focuses on 3D spatial analysis, the temporal evolution of new housing estates, and the implementation of smart city concepts using scientific tools in artificial intelligence. Considering the ongoing development of this specific urban area, it was deemed appropriate to apply the URAM to conduct a prospective analysis of the urban built environment.
3.2 Sensor for data acquisition
In the context of data acquisition for urban augmented reality modeling, the choice of sensor plays a crucial role in capturing accurate and high-quality data. With the advancement of technology, a wide range of sensors are available for collecting geospatial data in urban environments. These sensors enable researchers to capture various types of data, including spatial coordinates, 3D point clouds, images, and depth information. One of the widely used sensors for data acquisition is the Light Detection and Ranging (LiDAR) scanner. LiDAR scanners emit laser pulses and measure the time it takes for the laser to return after hitting objects in the environment. This data is then used to generate precise 3D point clouds, which are essential for creating detailed urban models. Another commonly employed sensor is the Global Navigation Satellite System (GNSS) receiver, which uses satellite signals to determine accurate spatial coordinates. GNSS receivers provide location information with high precision and are often used in conjunction with other sensors to enhance data acquisition accuracy. Mobile sensors such as smartphones and tablets have also gained popularity in recent years [35, 36]. These devices are equipped with advanced cameras and sensors, including RGB cameras and depth sensors. The cameras capture high-resolution images, while the depth sensors provide distance measurements from the sensor to objects in the scene. The combination of these sensors enables researchers to capture both visual and depth data for urban modeling. Furthermore, aerial platforms such as drones and aircraft equipped with sensors are utilized for data acquisition in larger-scale urban areas. These platforms enable the collection of geospatial data from a bird’s-eye view, providing a broader perspective of the urban environment. Sensors such as LiDAR scanners and RGB cameras mounted on drones or aircraft allow for efficient data capture over large areas. The choice of sensor depends on various factors, including the specific data requirements, the scale of the study area, budget constraints, and logistical considerations. Researchers must carefully evaluate the capabilities and limitations of different sensors to ensure the acquisition of accurate and comprehensive data for urban augmented reality modeling. For our specific data acquisition needs, we selected the iPhone 13 Pro Max as our sensor of choice. This smartphone model offers a range of advanced features that contribute to the quality of the captured images. The sensors integrated into modern smartphones provide capabilities that meet the requirements for data acquisition in photogrammetry, making them suitable for capturing high-quality images for 3D modeling [37]. These features include wide color capture for photos and live photos, lens correction to ensure accurate representations, retina flash for enhanced lighting conditions, auto image stabilization for reducing blurriness, and burst mode for capturing multiple frames in quick succession. The combination of these features makes the iPhone 13 Pro Max well-suited for our research purposes. Figure 3 visually depicts the iPhone 13 Pro Max as the primary sensor utilized in our experimental study, highlighting its role in capturing the necessary data for our urban augmented reality modeling efforts.
Figure 3.
iPhone 13 Pro Max used as sensor for data acquisition.
3.3 Enhanced data collection for UARM approach
When capturing images for augmented reality, a specific region of the image sensor is utilized, specifically an area of 3840x2880 pixels on the iPhone 13 Pro. To optimize image processing and memory usage, a technique called binning is applied [38, 39]. Binning involves averaging the pixel values within a 2x2 pixel region and replacing them with a single pixel. This approach offers two significant benefits. Firstly, it reduces the image dimensions by a factor of two, resulting in downscaled images of 1920x1440 pixels. This reduction in size allows for efficient memory consumption and processing power, enabling the camera to operate at up to 60 frames per second while freeing up resources for rendering. Secondly, binning mitigates the impact of sensor noise, making it advantageous in low-light environments. To project the captured images from the 2D image plane into the 3D world, geometric distortion caused by lens imperfections must be corrected. Lens distortion is modeled using a one-dimensional lookup table, consisting of evenly distributed 32-bit float values along a radius from the distortion center to a corner. Each value represents a magnification factor applied to the radius, assuming symmetrical lens distortion [40].
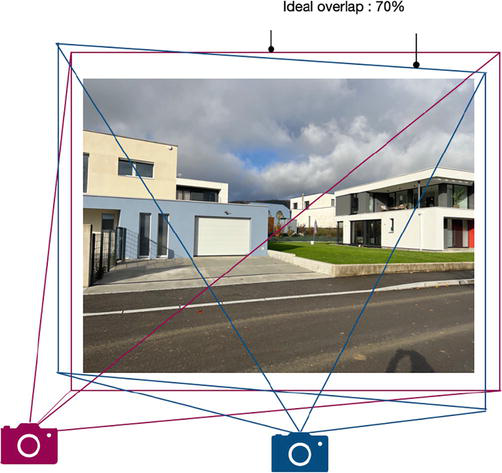
To generate detailed 3D models from real-world photographs using computer vision technology, photos of the urban built environment are taken from various angles using an iPhone. Multiple images are captured, ensuring sufficient overlap for accurate landmark matching and successful 3D reconstruction. Sequential images are positioned to have a 70% overlap or more (0.7 ≤ overlap ≤0.9) to ensure robust reconstruction [33, 41] as shown in Figure 4. Insufficient overlap can lead to reconstruction failures or low-quality augmented reality models. Maintaining a narrow aperture setting to achieve crisp focus is recommended [42, 43]. The spatial precision between image pairs and the density of chromatic textures significantly contribute to the quality of the collected images for 3D reconstruction of urban environments. Key factors that ensure high-quality input data [33, 41, 42, 43, 44] are summarized in Table 2.
Figure 4.
Ideal overlap to respect when capturing urban built environment.
Factor
Description
Fuzzy threshold value
Range or depth
Distance between camera and scene
Low
Sensor quality
The resolution of de sensor
High
Overlap
Superposition rate between two consecutive photographs
0.7 ≤ overlap ≤0.9
Image texture
Texture and texture variance
High
Table 2.
Key factors affecting photogrammetric input images quality for URAM.
For this experimental study, a photographic database consisting of 800 photos captured in compliance with the overlap constraints was created to feed the model. The database comprises 799 calibrated image pairs, which are sorted based on the constraints of stereovision image matching. Figure 5 illustrates a sample of the captured data, indicating the reading direction of the photos from start to end. The number of pictures required for an accurate 3D representation varies depending on the quality of the image pairs, the complexity and size of the built environment. It is crucial to adhere to the recommended overlap and aperture settings to ensure the generation of high-quality augmented reality models [33, 41, 42, 43]. All the urban built environment visual features were rendered using USD standard and specifications [6]. The steps and workflow needed to create USD files describing urban 3D visual features are summarized in Table 3.
Figure 5.
Dataset sample for URAM with the USD schema files.
Step and workflow
Description
Photogrammetry Processing
To process the set of 800 overlapped photographs and generate a 3D point cloud or mesh representing the urban environment, we used Apple ARKit in conjunction with Reality composer Swift programming language.
Geometry Conversion
Convert the 3D point cloud and mesh into a suitable format compatible with USD, such as .usdz and .usda.
USD Scene Assembly
Creation of new USD files (.usda) using a text Apple Reality converter and define the initial stage and layer structure of the scene and import the geometry as a reference or as a direct asset.
Visual Feature Modeling
Within the USD file, one defines the visual features of the urban environment using USD’s schema and attribute system. This includes specifying materials, textures, shading parameters, and any other visual properties.
Hierarchy and Organization
Arrange the visual features in a hierarchical structure that reflects the urban environment’s spatial relationships. This involve grouping buildings, roads, vegetation, and other elements into separate layers or sublayers.
Metadata Annotation
Enhance the USD files with metadata annotations to capture additional information about the urban features. This includes attributes like building heights, material properties, semantic labels, or any other relevant data.
Table 3.
Steps and workflow needed to create USD files describing urban 3D scene.
One of the core functionalities of the UARM is the ability to perform 3D geosimulation and prospective analysis. The framework incorporates computational models and simulation algorithms to simulate the behavior and dynamics of urban systems (Figure 6). These models can include factors such as population growth, transportation flows, land use patterns, and environmental factors. By running simulations based on different design scenarios, the UARM enables decision-makers to evaluate the potential impacts of proposed interventions and make informed decisions. Analytics capabilities are also integrated into the UARM, allowing for quantitative and qualitative analysis of the simulation results such as, transportation Infrastructure Expansion, high-density mixed-use development, green spaces and urban ecology, energy efficiency measures. In this chapter we focus on the augmented reality simulation results related to green spaces and urban ecology and energy efficiency.
Figure 6.
Scenario based prospective analysis components.
4.1 Advancing urban planning through green spaces and urban ecology
In contemporary urban planning and design, the integration of green spaces and the promotion of urban ecology are paramount considerations […]. This prospective scenario explores the potential benefits and implications of incorporating green spaces within the urban environment, aiming to evaluate their impact on various aspects of urban ecology. To achieve this, we employ the UARM approach to create a virtual representation of the urban area of interest. By integrating accurate 3D models of existing structures with virtual green spaces, we can visualize and assess their potential contributions to urban ecology. The envisioned green spaces encompass a range of elements, including parks, community gardens, urban forests, green roofs, and vertical gardens. Through the visualization and assessment provided by UARM, we can analyze the impact of these green spaces on multiple dimensions of urban ecology. For instance, by considering vegetation types, tree canopies, and pollutant dispersion models, we can estimate the potential reduction in air pollution levels. This information facilitates an understanding of how green spaces can contribute to mitigating air pollution and creating healthier urban environments for residents. Furthermore, by incorporating virtual flora and fauna, stakeholders can observe the potential habitats created by the green spaces and evaluate their suitability for supporting diverse species. This scenario provides insights into the potential increase in biodiversity and ecological connectivity within the urban context. Through simulations that simulate the introduction of green roofs, vertical gardens, and shaded areas, stakeholders can observe the potential reduction in surface temperatures and intensity of the urban heat island effect. Such analyses aid in identifying strategies to mitigate heat-related issues and enhance the thermal comfort of urban residents.
The Green Spaces and Urban Ecology scenario, enabled by UARM, serves as a valuable tool for urban planners and designers. It allows them to visualize and assess the potential benefits of incorporating green spaces within the urban environment, promoting evidence-based decision-making, and fostering stakeholder engagement. By leveraging this approach, we can facilitate the creation of sustainable and livable cities, where the integration of green spaces enhances the overall quality of urban life.
4.2 Advancing urban sustainability through energy-efficient interventions
The implementation of energy-efficient measures within the urban environment has the potential to create a significant impact [1, 4, 9]. This scenario aims to assess the reduction in energy consumption, environmental impact, and economic viability associated with these interventions. By leveraging the capabilities UARM, we visualize the virtual representation of the urban area and explore the potential changes resulting from energy efficiency measures.
Through virtual overlays, we illustrate retrofitted buildings, solar panels, wind turbines, and electric vehicle charging stations, among other elements. The augmented reality environment allows stakeholders to interact with these virtual elements and evaluate their impact on energy usage, carbon emissions, and cost savings. By integrating real-time energy data and building energy models, we can observe the potential reduction in energy consumption resulting from different interventions. This analysis aids in identifying areas with high energy demand and evaluating the effectiveness of proposed energy-saving strategies.
Furthermore, by incorporating cost data, energy pricing models, and return on investment calculations, we assess the financial implications of implementing various interventions. This analysis enables the prioritization of energy-saving measures that provide the greatest economic benefits and cost-effectiveness for urban development projects. By visualizing energy-saving measures in the augmented reality environment, stakeholders gain a better understanding of the associated benefits and actively participate in the decision-making process.
The augmented experience offered by UARM facilitates meaningful discussions, raises awareness, and promotes the adoption of sustainable behaviors among residents, businesses, and communities. By visualizing the potential outcomes of energy-efficient interventions, stakeholders are empowered to make informed choices and actively contribute to urban sustainability.
In this chapter, we have presented the application of Urban Augmented Reality Model (UARM) for 3D geosimulation and prospective analysis in urban planning and design. We have explored the foundations of augmented reality for urban simulation, discussed the technologies enabling UARM, and highlighted the limitations of traditional approaches in urban prospective analysis. Furthermore, we have presented the experimental application of UARM, focusing on the urban built environment geosimulation area, sensor utilization for data acquisition, and enhanced data collection for UARM approach.
The scenario-based prospective analysis results have demonstrated the effectiveness of UARM in advancing urban planning through the integration of green spaces and urban ecology, as well as promoting urban sustainability through energy-efficient interventions. These findings provide valuable insights for decision-makers and urban designers in understanding the potential impacts of proposed changes in the built environment and making informed choices for sustainable urban development.
There are several avenues for future research and development in the field of urban augmented reality and geosimulation. Firstly, further advancements in sensor technologies and data collection techniques can enhance the accuracy and realism of UARM models. This can include the integration of more comprehensive environmental data, real-time monitoring systems, and advanced sensing technologies for capturing finer details of the urban environment. Additionally, the incorporated machine learning and artificial intelligence algorithms can enhance the predictive capabilities of UARM, allowing for more accurate and reliable analysis of prospective scenarios. This can enable stakeholders to anticipate the long-term impacts of urban interventions, optimize resource allocation, and facilitate data-driven decision-making. Moreover, exploring the scalability of UARM to larger urban areas and complex urban systems is an important direction for future research. This includes addressing computational challenges, developing efficient algorithms for handling large-scale geospatial data, and exploring distributed computing approaches for real-time geosimulation and analysis.
Our future research and development efforts focus on further refining the UARM framework for addressing scalability challenges and enhance its capabilities in supporting advanced urban visual analytics [45, 46, 47].
References
1.Biljecki F, Ledoux L, Stoter J, Vosselman G. The variants of an LOD of a 3D building model and their influence on spatial analyses. ISPRS Journal of Photogrammetry and Remote Sensing. 2016;116:42-54. DOI: 10.1016/j.isprsjprs.2016.03.003
2.Li L, Tang L, Zhu H, Zhang H, Yang F, Qin W. Semantic 3D modeling based on CityGML for ancient Chinese- style architectural roofs of digital heritage. ISPRS International Journal of Geo-Informatics. 2017;6(5):132. DOI: 10.3390/ijgi6050132
3.Benenson I, Torrens P. Geosimulation: Automata-based Modeling of Urban Phenomena. Chichester: Wiley; 2002
4.Ledoux H. val3dity: Validation of 3D GIS primitives according to the international standards. Open Geospatial Data, Software Stand. 2018;3:1. DOI: 10.1186/s40965-018-0043-x
5.Sinyabe E, Kamla V, Tchappi I, Najjar Y, Galland S. Shapefile-based multi-agent geosimulation and visualization of building evacuation scenario. Procedia Computer Science. 2023;220:519-526. DOI: 10.1016/j.procs.2023.03.066
6.USDZ. Interopérabilité 3D autour du format de Réalité Augmentée. Available online: https://www.cadinterop.com/fr/les-formats/maillage/usdz.html# [Accessed: June 2, 2023]
7.OGC CityGML 3.0 Conceptual Model. Available online: https://github.com/opengeospatial/CityGML-3.0CM [Accessed: Mai 7, 2022]
8.Jung J, Hong S, Yoon S, Kim J, Heo J. Automated 3D wireframe modeling of indoor structures from point clouds using constrained least-squares adjustment for as-built BIM. Journal of Computing in Civil Engineering. 2016;30(4):2016. DOI: 10.1061/(ASCE)CP.1943-5487.0000556
9.Bonczak B, Kontokosta CE. Large-scale parameterization of 3D building morphology in complex urban landscapes using aerial LiDAR and city administrative data. Computers, Environment and Urban Systems. 2019;73:126-142. DOI: 10.1016/j.compenvurbsys.2018.09.004
10.Bielefeldt BR, Reich GW, Beran PS, Hartl DJ. Development and validation of a genetic L-System programming framework for topology optimization of multifunctional structures. Computers & Structures. 2019;218:152-169. DOI: 10.1016/j.compstruc.2019.02.005
11.Henderson P, Ferrari V. Learning single-image 3D reconstruction by generative modeling of shape, pose and shading. International Journal of Computer Vision. 2020;128:835-854. DOI: 10.1007/s11263-019-01219-8
12.Agbossou I. Fuzzy photogrammetric algorithm for city built environment capturing into urban augmented reality model. Artificial Intelligence. 2023. DOI: 10.5772/intechopen.110551
13.Weinmann M. Visual features – From early concepts to modern computer vision. In: Farinella G, Battiato S, Cipolla R, editors. Advanced Topics in Computer Vision. London: Advances in Computer Vision and Pattern Recognition. London: Springer; 2013. DOI: 10.1007/978-1-4471-5520-1_1
14.Song C, Lin Y, Guo S, Wan H. Spatial–temporal synchronous graph convolutional networks: A new framework for spatial–temporal network data forecasting. Proceedings of the AAAI Conference on Artificial Intelligence. 2020;34(01):914-921. DOI: 10.1609/aaai.v34i01.5438
15.Guangyin J, Qi W, Cunchao Z, Yanghe F, Jincai H, Xingchen H. Urban fire situation forecasting: Deep sequence learning with spatio-temporal dynamics. Applied Soft Computing. 2020;97(Part B):106730. DOI: 10.1016/j.asoc.2020.106730
16.You L, Lin H. A conceptual framework for virtual geographic environments Knowledge engineering. International Architect Photogramming and Remote Sense Spatial Information Science. 2016;XLI-B2:357-360. DOI: 10.5194/isprs-archives-XLI-B2-357-2016
17.AppleARKit. More to explore with ARKit. AppleARKit. 2017. Available at: https://developer.apple.com/documentation/arkit [Accessed: June 11, 2023]
18.Wang ZB, Ong SK, Nee AYC. Augmented reality aided interactive manual assembly design. International Journal of Advanced Manufacturing Technology. 2013;69:1311-1321. DOI: 10.1007/s00170-013-5091-x
19.Batty M. Cities and Complexity. Cambridge: MIT Press; 2005
20.Batty M, Torrens P. Modeling and prediction in a complex world. Futures. 2005;37:745-766
21.Portugali J. Self-organization and the City. New York: Springer-Verlag; 2000
22.Huang MQ , Ninić J, Zhang QB. BIM, machine learning and computer vision techniques in underground construction: Current status and future perspectives’. Tunneling and Underground Space Technology. 2021;2021:108. DOI: 10.1016/j.tust.2020.103677
23.Zheng Y, Capra L, Wolfson O, Yang H. Urban computing: Concepts, methodologies, and applications. ACM Transactions on Intellectual System and Technology. 2014;5:3. DOI: 10.1145/2629592
24.Rao J, Qiao Y, Ren F, Wang J, Du Q. A mobile outdoor augmented reality method combining deep learning object detection and spatial relationships for geovisualization. Sensors. 2017;17(9):1951. DOI: 10.3390/s17091951
25.Liao T. Standards and their (recurring) stories: How augmented reality markup language was built on stories of past standards. Science, Technology, & Human Values. 2020;45(4):712-737. DOI: 10.1177/0162243919867417
26.Claudia M, Jung T. A theoretical model of mobile augmented reality acceptance in urban heritage tourism. Current Issues in Tourism. 2018;21(2):154-174. DOI: 10.1080/13683500.2015.1070801
27.Gautier J, Brédif M, Christophe S. Co-visualization of air temperature and urban data for visual exploration. In: 2020 IEEE Visualization Conference (VIS). Salt Lake City, UT, USA; 2020. pp. 71-75. DOI: 10.1109/VIS47514.2020.00021
28.Liliana B, Luca C, Franco C, Giuseppe R, editors. Future Cities and Regions. Simulation, Scenario and Visioning, Governance and Scales. New York, Heidelberg: Springer; 2011
29.Verma JK, Paul S, editors. Advances in Augmented Reality and Virtual Reality. Singapore: Springer; 2022. p. 312. DOI: 10.1007/978-981-16-7220-0
30.Gustavo A et al. Procedural modeling applied to the 3D city model of bogota: A case study. Virtual Reality & Intelligent Hardware. 2021;3(5):423-433. DOI: 10.1016/j.vrih.2021.06.002
31.Peeters A, Etzion Y. Automated recognition of urban objects for morphological urban analysis. Computers, Environment and Urban Systems. 2012;36(6):573-582
32.Berrou JL, Beecham J, Quaglia P, Kagarlis MA, Gerodimos A. Calibration and validation of the Legion simulation model using empirical data. In: Waldau N, Gattermann P, Knoflacher H, Schreckenberg M, editors. Pedestrian and Evacuation Dynamics. New York: Springer Verlag; 2007. pp. 155-156
33.Anders K-H. Level of detail generation of 3D building groups by aggregation and typification. In: International Cartographic Conference. Vol. 2. 2005. p. 32
34.Johannes E et al. Procedural modeling of architecture with round geometry. Computers & Graphics. 2017;64:14-25. DOI: 10.1016/j.cag.2017.01.004
35.Biljecki F, Ledoux H, Stoter J. Generating 3D city models without elevation data. Computers, Environment and Urban Systems. 2017;64:1-18
36.Gnana OV, Karthikeyan SK, Padmanaban S, editors. Smart Buildings Digitalization. Case Studies on Data Centers and Automation. Boca Raton: CRC Press; 2022. p. 314. DOI: 10.1201/9781003240853
37.Cherdo L. The 8 Best 3D Scanning Apps for Smartphones and IPads in 2019. 2019. Available from: https://www.aniwaa.com/buyers-guide/3d-scanners/best-3d-scanning-apps-smartphones/ [Accessed: May 12, 2022]
38.Liu Y, Wang W, Xu X, Guo X, Gong G, Lu H. Lightweight real-time stereo matching algorithm for AI chips. Computer Communications. 2022. DOI: 10.1016/j.comcom.2022.06.018
39.Yuan W, Meng C, Tong X, Li Z. Efficient local stereo matching algorithm based on fast gradient domain guided image filtering. Signal Processing: Image Communication. 2021;95:116280. DOI: 10.1016/j.image.2021.116280
40.Liu Y, Wang W, Xu X, Guo X, Gong G, Lu H. Lightweight real-time stereo matching algorithm for AI chips. Computer Communications. 2023;199:210-217. DOI: 10.1016/j.comcom.2022.06.018
41.Kim T-H et al. Smart city and IoT. Future Generation Computer Systems. 2017;76:159-162. DOI: 10.1016/j.future.2017.03.034
42.Yonghuai L et al. 3D Imaging, Analysis and Applications. Second ed. Switzerland: Springer; 2022. DOI: 10.1007/978-3-030-44,070-1
43.Xiang W et al. A novel reversible image data hiding scheme based on pixel value ordering and dynamic pixel block partition. Information Sciences, Volume. 2015;310(2015):16-35. DOI: 10.1016/j.ins.2015.03.022
44.Wilm, J., Aanæs, H., Larsen, R., & Paulsen, R. R, Real Time Structured Light and Applications. Kgs. Lyngby: Technical University of Denmark (DTU), 2016 (DTU Compute PHD-2015; No. 400). Available from: https://core.ac.uk/download/pdf/43255252.pdf [Accessed: October 16, 2021]
45.A Tool for Exploring Urban Visual Analytics Studies. Available at: https://urban-va-survey.github.io/ [Accessed: June 7, 2022]
46.Li C, Baciu G, Wang Y, Chen J, Wang C. DDLVis: Real-time visual query of spatiotemporal data distribution via density dictionary learning. IEEE Transactions on Visualization & Computer Graphics. 2022, 2022;28(01):1062-1072. DOI: 10.1109/TVCG.2021.3114762
47.Pumain D, Sanders L, Saint-Julien T. Villes et auto-organisation. Paris: Economica; 1989
Written By
Igor Agbossou
Submitted: 29 June 2023Reviewed: 11 July 2023Published: 07 August 2023
 Open access peer-reviewed chapter