Open Access is an initiative that aims to make scientific research freely available to all. To date our community has made over 100 million downloads. It’s based on principles of collaboration, unobstructed discovery, and, most importantly, scientific progression. As PhD students, we found it difficult to access the research we needed, so we decided to create a new Open Access publisher that levels the playing field for scientists across the world. How? By making research easy to access, and puts the academic needs of the researchers before the business interests of publishers.
We are a community of more than 103,000 authors and editors from 3,291 institutions spanning 160 countries, including Nobel Prize winners and some of the world’s most-cited researchers. Publishing on IntechOpen allows authors to earn citations and find new collaborators, meaning more people see your work not only from your own field of study, but from other related fields too.
Perspective Chapter: Responses of the Water Balance Components under Land Use/Land Cover and Climate Change Using Geospatial and Hydrologic Modeling in the Dhidhessa Sub-Basin, Ethiopia
Written By
Damtew Degefe Merga
Submitted: 06 April 2023Reviewed: 24 April 2023Published: 13 July 2023
To purchase hard copies of this book, please contact the representative in India:
CBS Publishers & Distributors Pvt. Ltd.
www.cbspd.com
|
customercare@cbspd.com
The future water balance estimates are based on climatology and LULC reference period, as well as two future periods, 2030–2059 and 2070–2099, with monthly time-steps determined by bias modifications for both rainfall and temperature for every RCP. As depend on simulated results, the quantity of water stability element as in study area sub-basin would than decline in the coming centuries, with an annual mean river basin decrease of 10% throughout 2044 and 6.3% throughout 2084. Potential evaporation and evapotranspiration risen by 15.9 and 6.5, including both by percent, in the immediate term (2044), while rainfall, percolation of water, surface runoff, transmission losses, lateral runoff, groundwater flow, and water production declined by 5.6, 42.6, 44, 2.1, 30.8, 47.8, and 9.2, in all by percent. Long-term 2084 rainfall, percolation of water, surface runoff, transmission losses, lateral runoff, groundwater flow, and water production decreased by percent 1.6, 42.7, 43.1, 3.4, 29.1, 47.3, and 5.7 while evaporation increased by 11.6 and potential evapotranspiration increased by 22.4. Overall, the above research found that any impact on the watershed that causes a reduction through water balance has a major impact also on area continued efficient water management as well as improvement of living standards.
Research and Technology Park, Wollega University, Nekemte, Ethiopia
*Address all correspondence to: hwre2020@gmail.com
1. Introduction
The multiple key causes of the hydrological cycle are LULC variability and climate change. The issues of LULC effect on water balances like soil water, evapotranspiration, percolation, base flow, discharge, and water yield through changing land environmental factors and altering soil as well as atmospheric limitations [1, 2, 3]. Climate change, and the other, can direct effect rainfall as well as temperature, causing shifts in watersheds and water resource distribution [4, 5]. Changes of intensity, amplitude, and duration of rainfall influence the amount and variation of river flow [6], which often exacerbates floods and droughts while also having a negative impact on local and regional water resources [7]. As a result, evaluating the effects of water balance may be vital for water policy and administration [8, 9]. The scientific community and policymakers have paid close attention to LULC research and evaluating the climate impacts [10].
Several studies have been conducted across the world to discuss a consequences of climate warming as well as LULC impact on water balance element [8, 11, 12, 13, 14, 15]. Moreover, several research findings claim that climate change is really the primary cause of hydrological fluctuation [16, 17, 18, 19], whereas others claim that LULC change is the primary driving factor [3, 20, 21].Others, however, argue that hydrology directly impacts are caused by both climate cause and variations throughout the LULC [22, 23, 24, 25, 26]. Outcome, of the consequences of climate effect and LULC on hydrologic processes have been unknown and necessitate additional research.
Undoubtedly, some Ethiopian River Basins are now undergoing water scarcity as a result of hydrological changes [27]. Human-induced LULC changes inside the river basin, like illegal logging, rural expansion, and urban development, have impacted the hydrological cycle components [28, 29]. The expected rise in temperature [30] will cause more forceful issue in regional rain fall and ET rates [16, 17], as well as affecting water source and surface run, among other issue [16, 31, 32]. Ethiopia is ranked as the second-most densely populated nation due to unknown future sources of food and water. Water scarcity is undoubtedly occurring in some Ethiopian river basins as a result of hydrological changes [27]. Human-induced changes in LULC within the river basin, such as deforestation, cultivation, and urban development, have impacted hydrological cycle components [28, 29]. Temperature rises [30] are expected to cause significant changes in local rainfall and ET rates [16, 31], as well as affect water accessibility and surface runoff, among other issues [16, 31, 32]. Dhidhessa Basin in Ethiopia’s Abbay Basin was chosen for the study due to its security vulnerability to climate challenge due to variation in rainfall distribution as well as a warmer climate [31]. Increased agricultural land, uncontrolled LULC changes, and growing populations all have an impact on the water environment [33]. Furthermore, the Dhidhessa basin is one of the basin’s productive areas [33]. Despite their importance, Ethiopian government officials have paid less attention to the climate issue as well as LULC cause on watershed hydrological components. With these concerns in mind, the aim of this research is to determine the effects of climate impacts, LULC & combined LULC and climate impact on water balance element. These scientific papers include (1) investigating climate change and future LULC; (2) examining the various climate issue plus LULC issue on different hydrological elements; (3) measuring the composite climate with LULC trends on various hydrological elements. SWAT, the cellular simulation prediction model, and local climate concepts were used in this research to achieve the above objectives.
Dhidhessa sub-basin is among Ethiopian most productive areas. The Dhidhessa Sub-basin in western Ethiopia is formed by southwestern region of the Abay Basin, as depicts in Figure 1. Research area is located between 08.0001 and 09.0002 north and 35.345 and 37.653 east [2]. The total covers of study area 1,962,983 ha. Evaluation has included a vital development of water resources research programs and locations of involvement, in addition to circulation through the Dhidhessa River’s main stream and significant rivers [2]: Agaroo, Dabana, Wama, and Dhidhessa River.
Figure 1.
Study area map.
The altitude of the area of research varies from 818 meters above sea level to 3146 meters above sea level, as indicated by Figure 2 [2].
Figure 2.
Topography map.
2.2 Data used and sources
From 1991 to 2020, the ENMSA was measured climate required on rainfall and max and min temperature for monitoring stations (Table 1).To complete the gap rainfall and temperature values, by normal ratio technique was used. In Dhidhessa basin, the duration of solar radiation, wind speed, and relative humidity statistics are restricted, or otherwise these data are not available for many stations. The Arc-SWAT CSFR World Weather Generator for restricted data as a result. The WGEN CFSR World Weather dataset, created with the assistance of the National Centers for Environmental Prediction Climate Reanalysis System, incorporates SWAT inputs (Arc-SWAT CSFR World Weather Generator) that fully cover long-term weather survey data for the entire world [34].
Station Name
Zone
Station
Latitude
Longitude
Data
% of
% of
Elevation
coverage
missing
missing
Agaroo
Jimma
1666
7.85
36.6
1991–2020
22
22.5
Arjoo
East Wollega
2565
8.75
36.5
1991–2020
21
37.5
Bedele
Illuabba bor
2011
8.45
36.33
1991–2020
21
17.5
Dhidhessa
East Wollega
1310
9.38
36.1
1991–2020
20
46
Nekemte
East Wollega
2080
9.08
36.46
1991–2020
21
20.5
Table 1.
Records of weather stations.
The CORDEX Africa data set contains climate data for the period 2010–2099. The CORDEX models (http://www.ccafs-climate.com/data-spatial-down-scaling/) have daily rainfall, minimum temperature, and maximum temperature, so we used this website for this study. For the surface water analysis, flow data were collected from MoWIEE GIS database (See Table 2).
2.3 Methodology
The method entails predicting future LULC changes, defining climate change impacts, compiling a watershed analysis model (SWAT) with calibration and validation, analyzing effects of LULC impact on water balance elements, examine climate impact variability on water balance elements, as well as evaluating the composite for LULC as well as climate impact variability on water balance elements, as demonstrated by simulation (see Figure 3).
Figure 3.
Flow chart of the study.
2.4 Climate change background and model selection
Most every model may have benefits and drawbacks [35, 36]. This model used during research was linked with observations to achieve this specific goal. In addition, the models’ ensemble performance was calculated relative to the observed models achievement. In this data analysis, climate source by high-resolution RCM from the CORDEX-Africa data model were used [37, 38]. Previous Dhidhessa Sub-basin research papers [36, 39] are used to select the driving model, or GCM. As a result, the driving models chosen were those from the Danish Hydrologic Institute (DMI-HIRHAM5), the Regional Atmospheric Climate Model Version 2.2 (KNMI-RACMO22T), and the Swedish Meteorological and Hydrological Institute (SMHI-RCA4), with the most recent regional climate model (RCM/RCP) gridded at 0.5° to 0.5° spatial resolution. Most previous research on the UBN has used coarse-resolution GCMs rather than regional climate models (RCMs). GCMs have been usually run at horizontal resolutions that tend to range from 250 to 600 km, which are inadequate for analyzing impacts on the environment. Furthermore, previous research depended on SRES climates, applying newly developed RCP. RCP lead the analysis by temperature and precipitation feedbacks to anthropogenic an activity, which includes data on a wide range of GHGs, including radioactive gases and vapor emission levels, land use, and socioeconomic conditions. In addition, commonly used statistical indicators from the World Meteorological Organization (WMO) were used to compare model and observational results. Bias, root mean square error, and coefficient of variation are examples of these survey results [40].
P and Obs are the modeled and estimated values, and i and N are the modeled and estimated pairs.
2.4.1 Bias correction
RCM models frequently [41] have large bias during compared to estimated data, actually after segmentation to high resolution. Because these precipitation and temperature biases were found to be spatially variable [42], bias adjustment was done separately for every sub-basin. To bias-correct [43] linear transformation concepts and min and max-temperature scales (Eq. (4)) were used.
where: Tcorrected denotes the adjusted per day temperature, Tmean Obs denotes the average mean temperature, and Tmean RCM denotes the avg. modeled temperature. TRCM is the RCM model’s uncorrected per day temperature. TObs represent daily observed temperatures; Tmean Obs represents the observed aveg temperature; and Tmean RCM represents the modeled avg. temperature. This refinement was carried out on data for every 12-month period separately [43]. Coefficient of variation and the mean were both adjusted using a power transformation [44]. The following nonlinear correction is used to convert all daily rainfall quantities P to corrected P* (Eq. (5)):
P∗=apbE5
Where; the adjusted variable value (rainfall), the scaling exponent “b” appears repeatedly, and the CV by the RCM rainfall during correspond to that of the observed rainfall. Then, to ensure t the average of the interpreted rainfall results equals the estimated mean, a constant “a” is determined [2].
b=δPobsdayμPobsday−δPRCMdayμPRCMday,P+=PRCMdayb,
a=μPobsdayμP+RCMday,andP∗=aP+bE6
2.5 SWAT model in hydrological characteristics
The SWAT model in the hydrological element is dependent on the water balance. SWAT’s hydrological model only takes into account flow rates from the unsaturated zone [2]. Since water entering the shallow wells is presumed to make a contribution to the watershed through area outside the basin, groundwater from the shallow aquifer is not considered. Surface seepage, lateral seepage from the soil layer, and return seepage or base seepage from the deep ground water all make a contribution to the water in the flow, as per [2, 45]. Water discharged to shallow ground waters is regarded as lost from the drainage basin system and is not considered for that in water analysis [2, 46]. A basin soil moisture level (Eq. (7)) is calculated as follows:
SWt=SWo+∑i=1tRday−QSurf−Ea−WSeep−QgwiE7
SWs denote the final soil moisture content i(mm), SWo is the initial soil moisture content (mm), and t is time (days), Rday i(mm) the quantity of rainfall on day, Qsurf i(mm) the amount of surface runoff on day, the amount of evaporation per day is denoted by Ea i(mm). Wseep is the quantity of water approaching the vadose zone from the soil layer per day i (mm), and Qgw is the quantity of return flow on per day i (mm). The water balance element in the SWAT modeled intended using temporal and spatial data from the hydrological cycle as well as the SWAT input time series, as shown above Eq. (7).
2.5.1 Surface runoff
SWAT-model generates storm water quantities and peak flow using per day or sub-daily rainfall quantities for every HRU. SWAT techniques for determining storm water volumes include the SCS-curve counting technique and the Green and Ampt infiltration technique. Although the latter technique is much more precise in estimating flow quantity, it requires sub-daily interval data, is not available. The SCS-curve totaling technique remained employed. SCS-curve numbering method is generalized (Eq. (8)):
QSurf=Rday−Ia2Rday−Ia+SE8
where Qsurf is rainfall excess (mm), R-day is the rainfall depth for the day (mm of water), Ia is the initial abstraction (mm of water), and S is the retention parameter (mm of water). S, the retention parameter, can be computed using Eq. (9).
S=25.41000CN−10E9
where CN is the in-day curve number as well as its value is affected by land cover, soil permeability, and soil hydrological group. The initial abstraction, Ia, is commonly estimated at 0.2 S, resulting in (Eq. (10)):
QSurf=Rday−0.2S2Rday+0.8SE10
2.5.2 Peak flow
A maximum volume discharge velocity beyond to a point during a rainfall incident is referred to as peak rainfall or surface maximum flow rate. Maximum flow rate is a measure of storm discharge power and is recycled toward determining soil injury and water excellence. SWAT computes peak flow rates using an obtainable rational method (see Eq. (11)) [47].
Qpeak=CiAtotal3.6E11
where:
Qpeak is peak flow rate (m3/s),
C is the runoff coefficient,
i is the rainfall intensity (mm/hr.),
Sub-basin area (km2) and 3.6 is conversion factor.
2.5.3 Water yield
The residual total volume of water gives every HRU for sub-basin and needs to enter the main line flow rate once the water balance scheme is filled. SWAT uses the following equation to calculate how much total water yield adds to flow circulation as freshwater through the HRU:
WYID=SURQ+LATQ+GWQ−TLOSSE12
2.6 SWAT model performance appraisal
Performance data were used in different concepts to determine if calibration and validation times, spatial and temporal restrictions, and particular performance evaluations were mandatory criteria [47]. Calibration is a composite of manual and automated processes that analyze model limits that cannot be easily observed. The validation determines whether the model is functioning properly and serves as a foundation for systematic model calibration and validation. A prior report’s author describes how to calibrate model [47].The SWAT was used for 30 years, from 1991 to 2020, and watershed measurements were recorded from 1994 to 2011 for calibration. The validation of watersheds was also completed for the years 2012–2020. To be considered for the chosen group, a model must meet all three of the requirements [47, 48]. In this research, three conditions using: the coefficient of determination (R2), the Nash-Sutcliff Index (NSE), and the percent bias (PBIAS).
2.6.1 Coefficient of determination
The determination coefficient attempts to quantify a level of variability in the obtained data encountered by model. As shown in Eq. (13), the coefficient of decision (R2) is a parameter that is widely used to evaluate the quality of a model.
Omean is an abbreviation for mean estimated flow discharge.
Pi represents the modeled flow at time i.
Pmean denotes mean modeled flow, and n is the amount of flow data documented. The R2 quality performance criteria identified by [48] calibration and validation. The strength of the connection between measured and simulated attributes is indicated by R2. It has a significance range of 0 to 1. A value near 0 indicates a very weak correlation, while a value near 1 indicates a higher connection among measured and modeled flow.
2.6.2 NSE stands for Nash Sutcliffe simulation coefficient
Nash-Sutcliffe modeling coefficient (NES) is indeed a plot of the measured data that shows how well the modeled data matches a1:1 line. The NSE calculation equation is shown in Eq. (14).
NSE=1−∑i=1nOi−Pi2∑i=1nOi−Omean2E14
This classification causes the NSE performance level of such a model to be assessed on a variety of scales as indicated by [47, 48]. The NSE calculates the amplitude of the remaining variables in relation to observed value. Its values range start −∞ to 1, with 1 representing a great model and principle and lower than 0 implying the time series average value would be a good indicator than that of the concept (Table 2).
Data type
description
Data source
Climate/meteorological data
Daily estimated Data: Rainfall, Max and Min Temperature from 1991 to 2020
Generate a data input description for the Dhidhessa watershed SWAT model.
2.6.3 PBIAS
The PBIAS calculates if the estimated model is greater or less than the measured data [47, 48]. The PBIAS outcomes model simulation is within acceptable bounds. Positive numbers indicate that the simulation measures the bias, even though lower value/negative numbers imply that the model tends to overestimate the bias [49, 50]. Eq. (15) shows the method for calculating the PBIAS:
PBIAS=∑i=1nOi−Pi∑i=1nOi100E15
Ref. [51] ENS, PBIAS, and R2 values were assigned to the models for assessment. It calculates the gap between the modeled and estimated amounts, with a best value of 0. A high value signifies that the modeled value is lower value, while a negative value indicates that the model is exceeded.
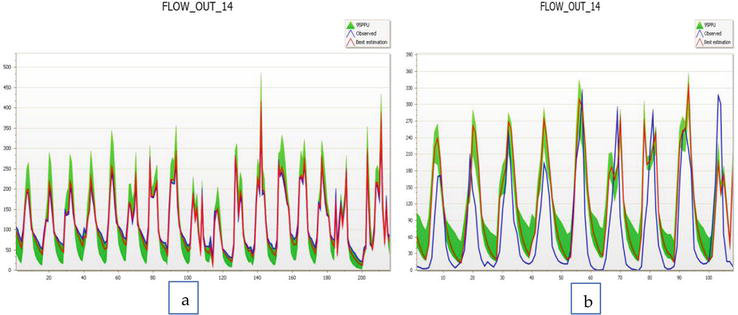
Using river flow data from Dhidhessa watershed gauge sites, model calibrated and validated. In past studies, around 18 most sensitive parameters affecting surface flow, lateral flow, groundwater flow, and evapotranspiration in the survey sub-basin were assessed [2]. The accurate values of the 18 stressed parameters shown in Table 3. During calibration and validation, hydrologic observations of recorded as well as simulated monthly river outflows at the Dhidhessa watershed sites are depict in Figure 4.
Parameter Name
Fitted Value
Min_value
Max_value
1:A__CN2.mgt
−0.2
−0.3
0.3
2:V__ALPHA_BF.gw
0.1
0.0
1.0
3:V__GW_DELAY.gw
6.3
1.0
150.0
4:V__GWQMN.gw
135.7
0.0
200.0
5:V__ESCO.hru
0.8
0.0
1.0
6:V__GW_REVAP.gw
0.1
0.0
0.2
7:V__OV_N.hru
0.2
0.1
0.3
8:V__SFTMP.bsn
2.5
−5.0
5.0
9:A__SLSUBBSN.hru
19.8
10.0
35.0
10:A__SOL_AWC(..).sol
0.0
0.0
0.0
11:A__SOL_K(..).sol
0.0
0.0
0.0
12:V__SURLAG.bsn
3.8
1.0
12.0
13:V__RCHRG_DP.gw
0.3
0.0
1.0
14:R__LAT_TTIME.hru
1.8
0.0
10.0
15:R__CH_N2.rte
0.0
0.0
0.1
16:R__CANMX.hru
1.0
0.0
1.0
17:R__RFINC(..).sub
0.5
0.1
0.5
18:R__CNCOEF.bsn
1.2
1.0
2.0
Table 3.
Parameters that are sensitive.
Figure 4.
(a) and (b) calibration and validation of sub-basin.
We used Dhidhessa River data (1994 to 2011) for model calibration and validation (2012 to 2020). For model warming, 3 years of data (1991 to 1993) have been used. The model’s status was assessed using R2, NES, and PBIAS approaches together manual and automated calibration. The numerical results obtained throughout quantification had an influence of 0.80 for R2, 0.76 for NES, and 2.41 for PBIAS. The measured and simulated concentrations agree well in terms of measurements. Validity is critical for increasing user confidence in advanced analytics models. Monthly observations from 2012 to 2020 are also used for model validation, yielding values of 0.80 for R2, 0.77 for ENS, and 9.2% PBias for no correction to the fitted value that occurred during the measurement period.
3.2 Climate impact on water balance
Impact climate is expected to reduce impact of water balance element such as discharge, base flow, water yield, percolation, and evapotranspiration by 12.31% as in medium-term and 18.43% as in long term. Rising temperatures, on the other hand, may rise of the rate of water loss shown in Table 4.
LULC Class
LULC 2005
LULC 2044
LULC 2084
AGRL
34.46
38.23
38.52
URBN
3.86
5.52
6.97
AGRR
33.64
34.8
36.62
BANA
2.8
1.56
1.33
COFF
5.75
4.08
4.67
FRSE
2.43
2.72
2.64
FRSD
10.23
7.25
5.33
FRST
1.21
1.94
2.02
PAST
1.68
1.43
1.29
RNGE
2.25
1.42
2.51
WETF
0.17
0.19
2.06
WETL
1.2
0.75
0.61
WETN
1.32
1.11
0.89
Table 4.
LULC as in the Dhidhessa basin in 2005, 2044, and 2084.
3.3 Potential water balance elements
Composite percentage impact for every water balance element modeled from a selected-climate model at annual mean time steps (i.e., 2044 (2030 to 2059) and 2084 (2070 to 2099) in study area from the projected future climate. The aveg yearly water balance such as evapotranspiration and potential evapotranspiration rise marginally by 15.9 and 6.5, respectively in percent, whereas rainfall, runoff, surface runoff, transmission, lateral flow, groundwater flow, and water production dropped substantially by 5.6, 42.6, 44, 2.1, 30.8, 47.8, and 9.2, respectively in percent, over the short period (2044). The other side, the adjustment in flow back and reduction in water flow are largely caused by a reduction in the percent change in water flow and an overdose of the basic system. Through lateral and return flows, this water seepage returned the total water output from the Dhidhessa to the flow of the main stream (groundwater). This decrease in the percentage of total water yield over the sub-basin is issue concern for farm growth as well as aquifer growth in this watershed (Figure 5). Apart from potential evapotranspiration and evapotranspiration, which rose by insignificant volumes of 22.4 percent and 11.6 percent from the reference era, respectively, all water balance elements showed an insignificant reduction in future percent change in the long term 2084, which is identical to the short term 2044, percent change in mean annual water balance during the long-term period (2084) was significantly reduced, with 1.6, 42.7, 43.1, 3.4, 29.1, 47.3, and 5.7, respectively in percent, compared to the reference era (2084).
Figure 5.
Water balance element.
It’s significantly reduced per variation throughout available water will jeopardize crop yields, and household tap water will be limited throughout this period, directly affecting welfare in study area. Figure 5 depicts that potential evapotranspiration increased as a outcome of knowingly complex trends in average yearly temperature (2070 to 2099). All water balance elements, with the exception of potential evapotranspiration and evapotranspiration, showed a lower variance in 2044 in the RCP4.5. In the longer term of 2084, the study area suffered significantly, through all significantly changing upcoming water balance elements reducing since the reference point except potential evapotranspiration and evapotranspiration, which both decreased firmly with percent change. The reduced percent change in all elements over the long run (2084) in this scenario was caused by an increase in potential evapotranspiration and evapotranspiration. Rainfall was reduced by 5.6 and 1.6, respectively in percent, in both era (i.e., short and long), as a percent shifts of the reference era in this scenario Figure 6. Under the high-emission scenario (RCP8.5), potential evapotranspiration rose by 15.9 and evapotranspiration continued to increase by 22.4 from reference era (Figure 6).
Figure 6.
Mean yearly water balance element under two RCP: (i) 2044 & (ii) 2084.
3.4 LULC and climate influence combined on water balance
The consolidated effects of climate and LULC remain then measured against the impact of climate as well as LULC separately. It looked at the 2005 LULC map, projected 2044 and 2084 LULC maps see Figure 7, climate data from 1991 to 2020, and short-term (2044) (2030–2059) and long-term (2084) (2070 to 2099) future climate projections. The selected models influence the goodness of fit of the CORDEX-AFRICA RCP simulation results in the Dhidhessa basin (Figures 7–10) (Table 5).
Figure 7.
Monthly mean rainfall short term with estimated data (1991–2020).
Figure 8.
Monthly mean rainfall long term with estimated data (1991–2020).
Figure 9.
Monthly mean temperature (max & min) short term.
Figure 10.
Monthly mean temperature (max & min) long term.
Statistical criteria
Deriving RCP
R2
PBias
Selection
DMI-HIRHAM5-RCP4.5
0.88
−15.62
✓
DMI-HIRHAM5-RCP8.5
0.84
−17.82
✓
KNMI-RACMO22T-RCP4.5
0.79
−10.55
✓
KNMI-RACMO22T-RCP8.5
0.74
−8.72
✓
SMHI-RCA4-RCP4.5
0.69
−22.94
✗
SMHI-RCA4-RCP8.5
0.71
−13.71
✓
Table 5.
Summary of goodness of fit of the CORDEX-AFRICA RCP modeled outputs in the Dhidhessa watershed.
Figure 11 depicts the significant amount of hydrological unpredictability in the Dhidhessa watershed future generated water balance characteristics. The cumulative discharge is a part of the total generated water balance; therefore, it is set for a short period of time (2030–2059) among the dual limits, since January through June as well as September through November, implying the impact of climate plus LULC is negligible throughout this period (flux changes are the cause of confirmation for other prevalent losses). Hydrological variation was not predicted for the long-term (2070–1999) scenario flow from September to December since the outflow occurred outside the boundary, implying that flow changes were caused by climate change, as implied by LULC. As a result, changes in climate and LULC were significant. In summary, the generated frequency was placed outside both boundaries; climate change and the impact of LULC in this sub-basin are causing more uncertainty about future flow.
Figure 11.
Limitations with reference era and future flow rate.
The impact of separation, climate as well as future LULC on various hydrological components of the Dhidhessa sub-basin is investigated in this study. The SWAT simulated the elements of the future period water balance under three different scenarios (climate, LULC, and climate plus LULC). The results of each scenario type were compared to the base periods of 1991–2020 climate data and the 2005 LULC. Discussion point: Climate models predict reduce in rainfall and a rise in mean temperature in the mid-term (2030–2059) and long-term (2070–1999) era in RCP. The study of LULC changes predicted increases in AGRL, AGRR, and urban areas from 2005 to 2099 using this model, at the expense of evergreen forests and grasslands. Changes in LULC plus climate change scenarios revealed that in the short term (2044), evapotranspiration and potential evapotranspiration rise marginally by 15.9 and 6.5, respectively in percent, while rainfall, runoff, surface runoff, transmission losses, lateral flow, groundwater flow, and water production declined substantially by 5.6, 42.6, 44, 2.1, 30.8, 47.8, and 9.2, correspondingly in percent. The rate changes in mean annual water balances output declined effectively over time (2084) as a shown Figure 10, except for PET and ET, which rise marginally by 22.4 percent and 11.6 percent, respectively, from the reference period. In all cases, the composite impacts of climate and LULC result in decreases in discharge, base flow, water yield, percolation, and evapotranspiration. The decrease rates for discharge and water yield are lower in the composite influence analysis of climate change and LULC with single of climate change because by comparison effects of LULC. Even so, when compared to the specific issue of climate or LULC changes, the collective effects of BF, PC, as well as ET contribute to significant reductions. As a result, climate impacts and LULC are two important concurrent and constant impacts on a region’s hydrological cycle that require an understanding of the components of their effects. Finally, the study’s findings may be applied to develop water security and options for adaptation (such as water harvesting and ability) as well as water reuse methodologies to remedial action of climate change and LULC on source, farming, and other areas.
According to the study, the Dhidhessa water balance component will decline in the coming hundred years, with an average annual river flow decline of 10 percent through 2044 and a 6.3 percent decline through 2084. Evapotranspiration and potential evapotranspiration increased by 15.9 percent and 6.5 percent, respectively, while precipitation, runoff, surface runoff, transmission losses, lateral runoff, groundwater runoff, and water production significantly decreased. Potential Evapotranspiration and evapotranspiration increased by 22.4 percent and 11.6 percent in the long term, respectively. The water balance element distribution is even across years but uneven across years, indicating a high chances of water shortages. This has significant implications for the area’s water security as well as ongoing social progress.
The authors would like to thank the University of Rostock for their willingness to fund this publication under the Open Access Publication funding program.
Conceptualization, D.D; methodology, D.D.; software, D.D.; validation, D.D., M.S., M.K and M.C.; formal analysis, D.D.; investigation, D.D.; resources, D.D.; Data curation, D.D.; writing—original draft preparation, D.D.; writing—review and editing, D.D. M.S., M.K, and M.C; visualization, D.D.; supervision, D.D.; project administration, D.D.; funding acquisition, M.K. All authors have read and agreed to the published version of the manuscript.
The data used in this study can be obtained from the authors upon reasonable request.
References
1.Woldesenbet TA, Elagib NA, Ribbe L, Heinrich J. Hydrological responses to land use/cover changes in the source region of the upper Blue Nile Basin, Ethiopia. Science of the Total Environment. 2017;575:724-741. DOI: 10.1016/j.scitotenv.2016.09.124
2.Merga DD, Adeba D, Regasa MS, Leta MK. Evaluation of surface water resource availability under the impact of climate Change in the Dhidhessa Sub-Basin, Ethiopia. Atmosphere (Basel). 2022;13(8):1296. DOI: 10.3390/atmos13081296
3.Gashaw T, Tulu T, Argaw M, Worqlul AW. Modeling the hydrological impacts of land use/land cover changes in the Andassa watershed, Blue Nile Basin, Ethiopia. Science of The Total Environment. 2018;619–620:1394-1408. DOI: 10.1016/j.scitotenv.2017.11.191
4.Kim BS, Kim BK, Kwon HH. Assessment of the impact of climate change on the flow regime of the Han River basin using indicators of hydrologic alteration. Hydrological Processes. 2011;25(5):691-704. DOI: 10.1002/hyp.7856
5.Kis A, Pongrácz R, Bartholy J, Szabó JA. Projection of runoff characteristics as a response to regional climate change in a central/eastern European catchment. Hydrological Sciences Journal. 2020;65(13):2256-2273. DOI: 10.1080/02626667.2020.1798008
6.Musie M, Sen S, Srivastava P. Application of CORDEX-AFRICA and NEX-GDDP datasets for hydrologic projections under climate change in Lake Ziway sub-basin, Ethiopia. Journal of Hydrology: Regional Studies. 2020;31(August):100721. DOI: 10.1016/j.ejrh.2020.100721
7.Abdo KS. Assessment of climate change impacts on the hydrology of Gilgel Abay catchment in Lake tana basin, Ethiopia. 2010;2274:2267-2274. DOI: 10.1002/hyp
8.Babar S, Ramesh H. Streamflow response to land use–land cover Change over the Nethravathi River basin, India. Journal of Hydrologic Engineering. 2015;20(10). Pp. 1, 4, 13. DOI: 10.1061/(asce)he.1943-5584.0001177
9.Liu D et al. Assessing the effects of adaptation measures on optimal water resources allocation under varied water availability conditions. Journal of Hydrology. 2018;556:759-774. DOI: 10.1016/j.jhydrol.2017.12.002
10.Chanapathi T, Thatikonda S, Raghavan S. Analysis of rainfall extremes and water yield of Krishna river basin under future climate scenarios. Journal of Hydrology: Regional Studies. 2018;19:287-306. DOI: 10.1016/j.ejrh.2018.10.004
11.Liu J, Zhang C, Kou L, Zhou Q. Effects of climate and land use changes on water resources in the Taoer River. Advances in Meteorology. 2017;2017. Pp. 2, 6, 7, 11-16. DOI: 10.1155/2017/1031854
12.Prasanchum H, Kangrang A, Hormwichian R, Compliew S. Impact of climate and rapid land use change on runoff quantities in Lower-Lampao river basin an improvement of irrigation planing view project impact of climate and rapid land use change on runoff quantities in Lower-Lampao River Basin, no. May 2014. 2013 [Online]. Available from: https://www.researchgate.net/publication/257942854
13.Prasanchum H. Analyses of climate and land use changes impact on runoff characteristics for multi- purpose reservoir system. 2017
14.Dibaba WT, Miegel K, Demissie TA. Evaluation of the CORDEX regional climate models performance in simulating climate conditions of two catchments in upper Blue Nile Basin. Dynamics of Atmospheres and Oceans. 2019;87:101104. DOI: 10.1016/j.dynatmoce.2019.101104
15.Barnes D. Climate change and water Inter-governmental Panel on Climate Change IPCC Technical Paper VI. 2008;60(8). DOI: 10.1525/9780520943933-008
16.Melesse AM. Nile River Basin Ecohydrological Challenges Climate Change and Hydropolitics. Cham Heidelberg, New York, Dordrecht, London: Springer; 2014. ISBN 978-3-319-02719-7; ISBN 978-3-319-02720-3 (eBook). DOI: 10.1007/978-3-319-02720-3
17.Gizaw MS, Biftu GF, Gan TY, Moges SA. Potential impact of climate change on streamflow of major Ethiopian rivers. August 2017;143(3):371-383. DOI: 10.1007/s10584-017-2021-1
18.Fentaw F, Hailu D, Nigussie A, Melesse AM. Climate change impact on the hydrology of Tekeze Basin, Ethiopia: Projection of rainfall-runoff for future water resources planning. Water Conservation Science and Engineering. 2018;3(4):267-278. DOI: 10.1007/s41101-018-0057-3
19.Musie M, Sen S, Chaubey I. Hydrologic responses to climate variability and human activities in Lake Ziway Basin, Ethiopia. 2020;12(1):164. DOI: 10.3390/w12010164
20.Zhou F, Xu Y, Chen Y, Xu C, Gao Y, Du J. Hydrological response to urbanization at different spatio-temporal scales simulated by coupling of CLUE-S and the SWAT model in the Yangtze River Delta region. 2013;485:113-125. DOI: 10.1016/j.jhydrol.2012.12.040
21.Shawul AA, Chakma S, Melesse AM. The response of water balance components to land cover change based on hydrologic modeling and partial least squares regression (PLSR) analysis in the upper Awash Basin. Journal of Hydrology: Regional Studies. 2019;26:100640. DOI: 10.1016/j.ejrh.2019.100640
22.Chawla I, Mujumdar PP. Isolating the impacts of land use and climate change on streamflow. 2015. pp. 3633–3651. DOI: 10.5194/hess-19-3633-2015.
23.Kundu S, Khare D, Mondal A. Individual and combined impacts of future climate and land use changes on the water balance. Ecological Engineering. 2017;105:42-57. DOI: 10.1016/j.ecoleng.2017.04.061
24.Tirupathi C, Shashidhar T. Investigating the impact of climate and land-use land cover changes on hydrological predictions over the Krishna river basin under present and future scenarios. Science of the Total Environment. 2020;721(10):137736. DOI: 10.1016/j.scitotenv.2020.137736
25.Wang Q et al. Individual and combined impacts of future land-use and climate conditions on extreme hydrological events in a representative basin of the Yangtze River Delta , China. 2020;236(163). Pp. 1-3, 4, 6-8. DOI: 10.1016/j.atmosres.2019.104805
26.Dibaba WT, Demissie TA, Miegel K. Watershed Hydrological Response to Combined Land Use/Land Cover and Climate Change in Highland Ethiopia: Finchaa Catchment. Water. 2020;12(6):2073-4441
27.Melesse AM. Nile River Basin Ecohydrological Challenges, Climate Change and Hydropolitics. NewYork Dordrecht London: Springer Cham Heidelberg; 2014
28.Gebremicael TG, Mohamed YA, Van Der Zaag P. Science of the Total environment attributing the hydrological impact of different land use types and their long-term dynamics through combining parsimonious hydrological modelling , alteration analysis and PLSR analysis. Science of The Total Environment. 2019;660:1155-1167. DOI: 10.1016/j.scitotenv.2019.01.085
29.Regasa MS. A Review on Land Use and Land Cover Change in Ethiopian Basins. 2021;10(6):585. DOI: 10.3390/land10060585
30.Pirani A, Chen Y, Lonnoy E, Leitzell K, Connors SL, Berger S, et al. In: Proceedings of 2021 IPCC, The Physical Science Basis. Contribution of Working Group I to the Sixth Assessment Report of the Intergovernmental Panel on Climate Change. 2021. DOI: 10.1017/9781009157896
31.Belihu M, Abate B, Tekleab S, Bewket W. Hydro-meteorological trends in the Gidabo catchment of the Rift Valley Lakes Basin of Ethiopia. Physics and Chemistry of the Earth. 2017;104. DOI: 10.1016/j.pce.2017.10.002. Available from: https://scholar.google.com/scholar?hl=en&as_sdt=0%2C5&q=+Hydro-meteorologi-cal+trends++in+the+Gidabo+catchment+of+the+Rift++Valley+Lakes+Basin+of+Ethiopia.+Physics++and+Chemistry+of+the+Earth&btnG=
32.Hussen B, Mekonnen A, Murlidhar S. Integrated water resources management under climate change scenarios in the sub-basin of Abaya-Chamo, Ethiopia, model. Modeling Earth Systems and Environment. 2018;4(1):221-240. DOI: 10.1007/s40808-018-0438-9
33.Aragaw HM, Goel MK, Kumar S. Hydrological responses to human-induced land use / land cover changes in the Gidabo River basin. Hydrological Sciences Journal. 2021;66(4):640-655. DOI: 10.1080/02626667.2021.1890328
34.Odusanya AE, Mehdi B, Schürz C, Oke AO, Awokola OS. Multi-site calibration and validation of SWAT with satellite-based evapotranspiration in a data-sparse catchment in southwestern Nigeria. 4 February, 2019;23(2). pp. 1113–1144
35.Endris HS et al. Assessment of the performance of CORDEX regional climate models in simulating east African rainfall. Journal of Climate. 2013;26(21):8453-8475. DOI: 10.1175/JCLI-D-12-00708.1
36.Edamo ML, Bushira KM, Ukumo TY, Ayele MA, Alaro MA, Borko HB. Effect of climate change on water availability in Bilate catchment, southern Ethiopia. Water Cycle. 2022;3:86-99. DOI: 10.1016/j.watcyc.2022.06.001
37.Kanoma MS, Abdulkadir M. The impact of future climate change on water availability in Gusau, Zamfara state, Nigeria. Dutse Journal of Pure and Applied Sciences. 2022;7(4a):144-154. DOI: 10.4314/dujopas.v7i4a.15
38.Hailemariam K. Impact of climate change on the water resources of Awash River basin, Ethiopia. Climate Research. 1999;12(2–3 SPEC. ISS. 6):91-96. DOI: 10.3354/cr012091
39.Bekele WT. Implication of Representative Concentration Pathway’s on Arjo-Didessa Catchment, Upper Blue Nile Basin, Using Multiple Climate Models. Arba Minch University; 2017. Available from: https://scholar.google.com/scholar?hl=en&as_sdt=0%2C5&q=Implication+of+Representa-tive+Concentration+Pathway%E2%80%99s+on+Arjo-Didessa+Catchment%2C&btnG=
40.Daba MH. Modelling the impacts of climate Change on surface runoff in Finchaa sub-basin, Ethiopia. International Journal of Food Science and Agriculture. 2018;2(1):14-29. DOI: 10.26855/jsfa.2018.01.002
41.Kefeni K, Mokonnen B, Roba N. Evaluation the performance of regional climate models in simulating rainfall characteristics over upper awash Sub-Basin, Ethiopia. 2020;5(1):134-138
42.Leander R, Buishand TA. Resampling of regional climate model output for the simulation of extreme river flows. Journal of Hydrology. 2007;332(3–4):487-496. DOI: 10.1016/j.jhydrol.2006.08.006
43.Bourqui M, Mathevet T, Gailhard J, Hendrickx F. Hydrological validation of statistical downscaling methods applied to climate model projections. IAHS-AISH Publication. 2011;344:32-38
44.Terink W, Hurkmans RTWL, Torfs PJJF, Uijlenhoet R. Evaluation of a bias correction method applied to downscaled precipitation and temperature reanalysis data for the Rhine basin. Hydrology and Earth System Sciences. 2010;14(4):687-703. DOI: 10.5194/hess-14-687-2010
45.Setegn SG, Rayner D, Melesse AM, Dargahi B, Srinivasan R. Impact of climate change on the hydroclimatology of Lake Tana Basin, Ethiopia. Water Resources Research. 2011;47(4):1-13. DOI: 10.1029/2010WR009248
46.Neitsch S, Arnold J, Kiniry J, Williams J. Soil & water assessment tool theoretical documentation version 2009, Texas water resources institute. 7 July, 2015;5(3):1-647. DOI: 10.1016/j.scitotenv.2015.11.063
47.Moriasi DN, Gitau MW, Pai N, Daggupati P. Hydrologic and water quality models: Performance measures and evaluation criteria. Transactions of the ASABE. 2015;58(6):1763-1785. DOI: 10.13031/trans.58.10715
48.Xue-song Z, Fang-hua HAO, Hong-guang C, Dao-feng LI. Application of Swat model In the upstream watershed of the Luohe River. 2003;13(4):334-339
49.Mazengo M, Kifanyi GE, Mutayoba E, Chilagane N. Modeling surface water availability for irrigation development in Mbarali River sub-catchment Mbeya, Tanzania. Journal of Geoscience and Environment Protection. 2022;10(04):1-14. DOI: 10.4236/gep.2022.104001
50.Liersch S et al. Are we using the right fuel to drive hydrological models? A climate impact study in the upper Blue Nile. Hydrology and Earth System Sciences. 2018;22(4):2163-2185. DOI: 10.5194/hess-22-2163-2018b
51.Gupta HV, Sorooshian S, Yapo PO. Status of automatic calibration for hydrologic models: Comparison with multilevel expert calibration. Journal of Hydrologic Engineering. 1999;4(2):135-143. DOI: 10.1061/(asce)1084-0699(1999)4:2(135)
Written By
Damtew Degefe Merga
Submitted: 06 April 2023Reviewed: 24 April 2023Published: 13 July 2023
 Open access peer-reviewed chapter