Open Access is an initiative that aims to make scientific research freely available to all. To date our community has made over 100 million downloads. It’s based on principles of collaboration, unobstructed discovery, and, most importantly, scientific progression. As PhD students, we found it difficult to access the research we needed, so we decided to create a new Open Access publisher that levels the playing field for scientists across the world. How? By making research easy to access, and puts the academic needs of the researchers before the business interests of publishers.
We are a community of more than 103,000 authors and editors from 3,291 institutions spanning 160 countries, including Nobel Prize winners and some of the world’s most-cited researchers. Publishing on IntechOpen allows authors to earn citations and find new collaborators, meaning more people see your work not only from your own field of study, but from other related fields too.
To purchase hard copies of this book, please contact the representative in India:
CBS Publishers & Distributors Pvt. Ltd.
www.cbspd.com
|
customercare@cbspd.com
This paper investigated the trends of precipitation and temperature in two Eco-regions of Ethiopia. The climate trends were examined using MK, Sen’s slope estimator test, and ITAM. The findings of the study revealed that the trends of precipitation showed a significant increasing trend in Gondar and Bahir Dar stations. However, the trend in Sekoru station showed slightly decreasing trend at highland eco-regions concerned. On the other hand, in lowland eco-regions a significant increasing trend was also observed in Gewane and Negele stations. However, the trend in Degahabur station showed a sharp decrease. As far as the trends of temperature are concerned, a statistically significant increasing trend was observed with Z > 4 in Gondar and Bahir Dar stations and a statistically sharp significant decreasing trend in Sekoru station of highland eco-regions. However, all stations of lowland eco-regions Gewane, Degahabur, and Negele show a statistically significant increasing trend with Z > 4. The consistency in precipitation and temperature trends over the two eco-regions confirms the robustness of the change in trends. The results of this study could help researchers, water resources managers, and decision-makers to understand the trends of climatic variables over the study eco-regions and become a base for further studies.
College of Agriculture and Environmental Sciences, University of Gondar, Gondar, Ethiopia
*Address all correspondence to: mohammedgedefaw@gmail.com
1. Introduction
Increasing frequency and intensity of extreme climatic events have got widespread acceptance across the globe and are subject to variations associated with the climate change [1]. Changes in precipitation have a direct impact on floods, droughts, and water resources [2]. Thus, it is essential to study the variations of precipitation and temperature characteristics in the context of climate change. Predicting the trends of climatic variables are a prerequisite for water resources planning and management for sustainable development [3, 4].
Nowadays, the global hydrological cycle has been responding to observed global warming, which includes an increasing atmospheric water vapor content and changing precipitation pattern [5]. The precipitation and temperature vary with latitude, elevation, and physiography especially precipitation decreasing from south to north of the country [6].
The climate of Ethiopia is described by the statistical interpretation of precipitation and temperature data recorded over a long period of time. The regional and global changes in the weather systems and the topographic variation along with the seasonal cycles are responsible for the spatial variability of rainfall in the country [6, 7, 8, 9, 10]. The change in climatic variables such as precipitation and temperature can provide important geographic, environmental, resource, agronomic, economic, and sociological effects in the country [11].
Trend analysis of climatic variables is very essential to understand the climate system of a given area and become a vital research area for many researchers across the world [1, 8, 12, 13, 14, 15, 16]. For example, Mekasha et al. [17] analyzed the temperature and rainfall extremes for 11 stations and found a general tendency of increasing warm and decreasing cold extremes, whereas trends in precipitation extremes were much more variable and increasingly inconsistent among different stations. Bewket and Conway [18] also reported the temporal and spatial variability of precipitation for a relatively small portion of the country and found no consistent pattern in daily rainfall trends. Asfaw et al. [7] investigated the variability and time series trend analysis of rainfall and temperature in the Woleka sub-basin, Northcentral Ethiopia, and found a decreased annual rainfall, belg and kiremt rainfall, and [19] also found a significant increasing trend of annual and seasonal precipitation in Northwest China from 1960 to 2013. Furthermore, Refs. [20, 21, 22, 23] reported the trends of spatial and temporal variability of climatic variables across different stations.
No study has been conducted so far on the trends of precipitation and temperature in two eco-environments of the country. Therefore, the output of this paper will provide insights for concerned body for future sustainable economic development, especially water resources management. The MK, Sen’s slope estimator test, and innovative trend analysis (ITAM) methods were used to detect the trends of precipitation and temperature to confirm whether there is a change in climate.
This study aims to investigate the trends and changes in climatic variables of the two-eco-environments from 1980 to 2016. The objectives of the study are: (i) to analyze climatic trends, (ii) to investigate the temporal variation in precipitation and temperature, and (iii) to assess the correlation between precipitation and temperature.
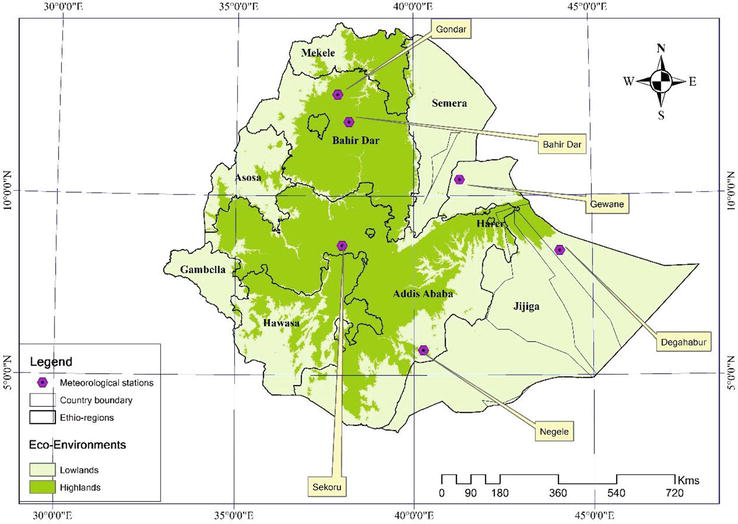
Ethiopia is found in East Central Horn of Africa lying between 3° and 15° North latitude, and 33°–48° East longitude. It has a total area of about 1.12 million km2 and comprises 12 river basins with varying sizes and water resource potential [6] (Figure 1). The country is characterized by diversified climate due to its equatorial positioning and topography. Its climate is controlled by the seasonal migration of the intertropical convergence zone (ITCZ), atmospheric circulations, complex physiography, and the marked contrast in elevation [6]. The country is mainly divided into two eco-environments namely lowlands and highlands ranging from extreme heat at one of the lowest places the Danakil Depression to the highest places (4543 m) above sea level at Ras Dejen [24]. The rainfall also showed seasonal and inter-annual variability [6].
Figure 1.
Location map of the study area.
2.2 Data sources
Daily precipitation and temperature data were collected from 1980 to 2016 from the National Meteorological Services Agency of Ethiopia (NMSA). As the data series from 1980 to 2016 are completed, the observed precipitation and temperature data were selected as the basic analysis data in this study. We have selected six stations from two eco-environments for this study. By extending the individual missing data in this period with the interpolation method commonly used in hydrometeorology, the basic data was further reorganized to obtain the temperature and annual precipitation of each selected station. The stations were selected based on the length of a record period and the relative completeness of the data (Table 1).
Stations
Elevation (m)
Latitude (°N)
Longitude (°E)
Eco-environments
Gondar
1973
37.4319
12.5212
Highland
Bahir Dar
1827
37.322
11.6027
Highland
Sekoru
1928
37.4167
7.9167
Highland
Gewane
568
40.633
10.15
Lowland
Degahabur
1070
43.55
8.2167
Lowland
Negele
1544
39.5667
5.4167
Lowland
Table 1.
Basic information about meteorological stations.
2.3 Methods
The nonparametric Mann-Kendall test is used to detect the trends of hydro-climatic changes [25]. This study used 10%, 5%, and 1% significance levels to evaluate hydro-climatic changes.
2.3.1 Mann: Kendall trend detection (MK)
The Mann–Kendall (MK) test is used to detect the trends of hydro-climatic changes, which do not require the data series to be normally distributed [5, 20, 26]. The test statistic (S) is equated as follows:
S=∑i=1n−1∑j=i+1nsgnXj−XiE1
The trend test is applied to Xi data points (i = 1, 2, …, n−1) and Xj (j = i + 1, 2, …, n).
sgnXj−Xi=+1ifXj−Xi>00ifXj−Xi=0−1ifXj−Xi<0E2
where Xi and Xj are the values in periods i and j.
The variance Var(S) is calculated using the given equation below [27]:
VarS=nn−12n+5−∑k=1mtktk−12tk+518E3
where m is the number of the tied groups in the time series, andtk is the number of data points in the kth tied group. The test statistic Z is as follows:
Z=S−1δifS>00ifS=0S+1δifS<0E4
In time sequence, the statistics are defined independently:
UFk=dk−EdkvardkK=12…nE5
The time series is arranged in reverse order to equate it
UBk=−UFkE6
K=n+1−kE7
Finally, UBk and UFk are drawn as UB and UF curves [28].
2.3.2 Sen’s slope estimator test
Slope estimator test is used to predict the magnitude of the trends as used by many researchers [29, 30, 31]. The slope (Qi) between two data series is equated as follows:
Qi==Xj−Xkj−k,fori=1,2,…,NE8
Then, the median of slope (β) is calculated as:
β=QN+1/2whenNisoddQN/2+QN+2/2/2whenNis evenE9
2.3.3 Innovative trend analysis method (ITAM)
The ITAM has been used by various climate scientists to investigate the trends across the globe [5, 20, 26]. In ITAM, the hydrometeorological observations were classified into two classes and then the data points were arranged independently in increasing order. Then, the two classified classes are placed on a coordinate system (Xi: i = 1, 2, 3, ..., n/2) on X-axis and (Xj: j = n/2 + 1, n/2 + 2, …, n) on Y-axis.
This study also used ITAM to detect the trends using the following formula [5]:
ɸ=1n∑i=1n10Xj−XiμE10
where, ɸ = trend indicator, n = number of observations in the subseries, Xi = data series in the first half subseries class, Xj = data series in the second half subseries class, and μ = mean of data series in the first half subseries class.
From 1980 to 2016, the mean annual precipitation of the study area was found to be 834.97 mm, with a coefficient of variation (CV = 15%) and standard deviation of 122.27 mm. The minimum and maximum-recorded rainfalls were 509.93 and 1015.90 mm per year, respectively. An increase in precipitation was observed in 2000, 2005, 2007, 2010, and 2013 with a coefficient of determination for the trend line (R2 = 0.01) and a sharp decreasing trend in 1992 (Figure 2). The areas with mean annual precipitation of more than 650 mm were located at the highland eco-environments of the country (Gondar, Bahir Dar, and Sekoru), which accounts for about 20.30% of lowland eco-environments (Gewane, Degahabur, and Negele).
Figure 2.
Mean annual precipitation of the study area.
3.2 Analysis of trend of precipitation
The MK curve annual precipitation (UF and UB = Changing Parameters) shows the trends of precipitation in highland and lowland eco-environments of the study area. A significant increasing trend was observed in Gondar from 1999 to 2012 (Z = 1.69), a significant increasing trend in Bahir Dar from 1994 to 2014 (Z = 0.72), and a slightly decreasing trend was observed in Sekoru from 1983 to 2016 (Z = 0.45) stations. On the other hand, in lowland eco-environments, a significant increasing trend was observed from 1994 to 2006 and 2006 to 2015 in Gewane (Z = 0.80) and Negele (Z = 0.72) stations, respectively. However, a sharp decreasing trend was observed in Degahabur station (Z = 0.30) (Figure 3).
Figure 3.
Trends of annual precipitation across stations (note: UB = −UF).
The trend analysis of precipitation in two eco-environments using the MK test, ITAM, and Sen’s slope estimator test results are presented in Table 2. Significance levels at α = 0.05, α = 0.1 were taken to detect the trends in all stations.
Results of MK, ITAM, and Sen’s slope estimator test for precipitation.
Trends at 0.1 level.
Trends at 0.05 level.
3.3 Analysis of mean annual temperature
The maximum and minimum mean annual temperature of the study was found to be 30.35 and 27.92°C, respectively. Whereas, the annual mean temperature was 29.16°C from 1980 to 2016. The temperature showed a dramatic increasing trend in 2010 and 2015 with a coefficient of determination for the trend line (R2 = 0.67) and a decreasing trend in 1989 (Figure 4). The highest temperature was recorded at the lowland eco-environments (Gewane, Degahabur and Negele). Whereas, a slightly lower temperature was observed in highland eco-environments (Gondar, Bahir Dar, and Sekoru).
Figure 4.
Mean annual temperature of the study area.
3.4 Trend analysis of temperature
The statistical test result of this study showed that the trends of temperature in Gondar (Z = 5.68) and Bahir Dar (Z = 7.59) stations showed a statistically significant increasing trend and a statistically sharp significant decreasing trend in Sekoru (Z = 1.37) station of highland eco-environments. However, all stations of lowland eco-environments (Gewane (Z = 5.59), Degahabur (Z = 4.78), and Negele (Z = 8.01)) showed a statistically significant increasing trend (Figure 5). The trend test results are presented in Table 3.
Figure 5.
Trends of annual temperature across stations (note: UB = −UF).
Results of MK, ITAM, and Sen’s slope estimator test for temperature.
Trends at 0.1 level.
Trends at 0.05 level.
3.5 Correlation analysis between precipitation and temperature
The high correlations were expected, as one can reasonably assume a cause-and-effect relationship between precipitation and temperature when considering the average annual values. The correlation between precipitation and temperature was found to be very high (R2 = 0.99) in this study. The correlation between precipitation and temperature is shown in Figure 6.
Figure 6.
Correlation coefficient between precipitation and temperature.
Ethiopia is characterized by inter-annual variability of rainfall and temperature. The rainfall variability affects crop production in most parts of the country. There is also significant spatial variation in the mean range of temperature. This change may express the diurnal variation and demand atmospheric moisture. The findings of this study showed that the frequency and intensity of warm temperature extremes have increased, while cold temperature extremes decreased in most stations.
The mean annual precipitation and temperature of the study eco-regions showed a consistently increasing trend. We have noticed that the correlation between precipitation and temperature was very strong in this study. It was confirmed that precipitation is mainly caused by cold summer, and thus correlates to a large extent with temperature in the study area.
The studies eco-regions are characterized by maximum precipitation in kiremt (June to August) season. There is fluctuation of precipitation and temperature over the stations in each eco-region. The trend detection methods showed that decreasing and increasing trends of precipitation and temperature were observed across the two eco-regions. The results of this study are consistent with [5, 6, 7, 8, 17, 20, 32, 33]. The change of these climatic variables across the stations during the study period (1980–2016) could be associated with human activities and climate change.
The analysis of the correlations between precipitation and temperature shows a coherent pattern of relationship. The precipitation is marked with blue and the temperature with red colors as shown in (Figure 7).
Figure 7.
Long-term relation between precipitation and temperature.
The changes in water vapor divergence for the rainy season (June to September) exhibited a regional increasing drying trend in the country from 1980 to 2016, which was consistent with the variation in consecutive dry days.
This paper investigated the trends of precipitation and temperature in two eco-environments of Ethiopia from 1980 to 2016. The temporal variability of precipitation and temperature was also investigated in all stations. A significant increasing trend of precipitation was observed in highland eco-environments (Gondar and Bahir Dar stations), whereas a slight decreasing trend was detected in Sekoru stations.
As far as temperature trends are concerned, statistically significant increasing trends were detected in two stations of highland eco-environments. Whereas, in lowland eco-environments, all stations show a statistically significant increasing trend from 1980 to 2016.
The increasing and decreasing of both precipitation and temperature across all stations during the study period is probably due to human activities and periodic drought. Further studies should be conducted to confirm the change of climate over the two eco-regions by increasing the sample meteorological stations. Other studies on indices such as rainfall intensity and frequency of wet and hot days are also recommended. This study only provides the trends of precipitation and temperature over the study region. This could be very essential to predict the climate condition of the study area and sustainable development.
The authors would like to thank the National Meteorological Service Agency of Ethiopia for providing the raw meteorological data and the National Key Research and Development Project (Grant No. 2016YFA0601503) for financing this work.
1.Pingale SM, Khare D, Jat MK, Adamowski J. Spatial and temporal trends of mean and extreme rainfall and temperature for the 33 urban centers of the arid and semi-arid state of Rajasthan, India. Atmospheric Research. 2014;138:73-90
2.Wen X, Wu X, Gao M. Spatiotemporal variability of temperature and precipitation in Gansu Province (Northwest China) during 1951–2015. Atmospheric Research. 2017;197:132-149
3.Buchori I et al. A predictive model to assess spatial planning in addressing hydro-meteorological hazards: A case study of Semarang City, Indonesia. International Journal of Disaster Risk Reduction. 2018;27:415-426
4.Wang H et al. Hydro-climatic trends in the last 50 years in the lower reach of the Shiyang River Basin, NW China. Catena. 2012;95:33-41
5.Gedefaw M et al. Trend analysis of climatic and hydrological variables in the awash river basin, Ethiopia. Water. 2018;10(11):1-14. DOI: 10.3390/w10111554
6.Seleshi Y, Zanke U. Recent changes in rainfall and rainy days in Ethiopia. International Journal of Climatology. 2004;24:973-983
7.Asfaw A, Simane B, Hassen A, Bantider A. Variability and time series trend analysis of rainfall and temperature in northcentral Ethiopia: A case study in Woleka sub-basin. Weather and Climate Extremes. 2017;19:29-41. DOI: 10.1016/j.wace.2017.12.002
8.Tsidu GM. High-resolution monthly rainfall database for Ethiopia: Homogenization, reconstruction, and gridding. Journal of Climate. 2012;25:8422-8443
9.Yenehun A, Walraevens K, Batelaan O. Spatial and temporal variability of groundwater recharge in geba basin, Northern Ethiopia. Journal of African Earth Sciences. 2017;134:198-212. DOI: 10.1016/j.jafrearsci.2017.06.006
10.Behailu S, Melesse AM, Bhat MG, Mcclain ME. Catena assessment of water resources availability and demand in the Mara River Basin. Catena. 2014;115:104-114
11.Gong B et al. Variation of hydrothermal conditions under climate change in Naqu Prefecture, Tibet Plateau, China. International Journal of Environmental Research and Public Health. 2018;15:2271
12.Lyon SW, King K, Polpanich O, Lacombe G. Journal of hydrology: Regional studies assessing hydrologic changes across the Lower Mekong Basin. Journal of Hydrology: Regional Studies. 2017;12:303-314
13.Fathian F, Aliyari H. Temporal trends in precipitation using spatial techniques in GIS over Urmia Lake Basin, Iran Farshad Fathian * and Hamed Aliyari Ercan Kahya Zohreh Dehghan. International Journal of Hydrology Science and Technology. 2016;6:62-81
14.Hamisi J. Study of rainfall trends and variability over tanzania a research project submitted in partial fulfilment of the requirements for the postgraduate diploma in meteorology university of nairobi. Research Project. 2013
15.Girma E, Tino J, Wayessa G. Rainfall trend and variability analysis in Setema-Gatira area of Jimma, Southwestern Ethiopia. African Journal of Agricultural Research. 2016;11:3037-3045
16.Panthi J et al. Spatial and temporal variability of rainfall in the gandaki river basin of nepal Himalaya. Climate. 2015;3:210-226
17.Mekasha A, Tesfaye K, Duncan AJ. Trends in daily observed temperature and precipitation extremes over three Ethiopian eco-environments. International Journal of Climatology. 2014;34:1990-1999
18.Bewket W. Soil and water conservation intervention with conventional technologies in northwestern highlands of Ethiopia: Acceptance and adoption by farmers. Land Use Policy. 2007;24:404-416
19.Yang P, Xia J, Zhang Y, Hong S. Temporal and spatial variations of precipitation in Northwest China during 1960–2013. Atmospheric Research. 2017;183:283-295
20.Gedefaw M, Yan D, Wang H, Qin T, Girma A, Abiyu A, et al. Innovative trend analysis of annual and seasonal rainfall variability in amhara regional state, Ethiopia. Atmosphere. 2018;9:326
21.Toride K, Cawthorne DL, Ishida K, Kavvas ML, Anderson ML. Science of the Total Environment Long-term trend analysis on total and extreme precipitation over Shasta Dam watershed. Science of the Total Environment. 2018;626:244-254
22.Theobald A, Mcgowan H, Speirs J. Trends in synoptic circulation and precipitation in the Snowy Mountains region, Australia, in the period 1958–2012. Atmospheric Research. 2016;169:434-448
23.Mbungu W, Ntegeka V, Kahimba FC, Taye M, Willems P. Temporal and spatial variations in hydro-climatic extremes in the Lake Victoria basin. Physics and Chemistry of the Earth. 2012;50–52:24-33
24.Wondie M, Schneider W, Melesse AM, Teketay D. Spatial and temporal land cover changes in the simen mountains national park, a world heritage Site in northwestern Ethiopia. Remote Sensing. 2011;3:752-766
26.Basin LB et al. Observed trends of climate and river discharge in mongolia’ s selenga sub-basin of the lake Baikal basin. Water. 2018;10(10):1-18. DOI: 10.3390/w10101436
27.Ma X, He Y, Xu J, Noordwijk M, Van – Lu X. Catena Spatial an temporal variation in rainfall erosivity in a Himalayan watershed. Catena. 2014;121:248-259
28.Zhang Q, Sun P, Singh VP, Chen X. Spatial-temporal precipitation changes (1956-2000) and their implications for agriculture in China. Global and Planetary Change. 2012;82–83:86-95
29.Martinez CJ, Maleski JJ, Miller MF. Trends in precipitation and temperature in Florida, USA. Journal of Hydrology. 2012;452–453:259-281
30.Gu X, Zhang Q, Singh VP, Shi P. Changes in magnitude and frequency of heavy precipitation across China and its potential links to summer temperature. Journal of Hydrology. 2017;547:718-731
31.Laurent JS, Mazumder A. Influence of seasonal and inter-annual hydro- meteorological variability on surface water fecal coliform concentration under varying land-use composition. Water Research. 2013;48:170-178
32.Nkiaka E, Nawaz NR, Lovett JC. Analysis of rainfall variability in the Logone catchment, Lake Chad basin. International Journal of Climatology. 2017;37:3553-3564. DOI: 10.1002/joc.4936
33.Tekleab S, Mohamed Y, Uhlenbrook S. Hydro-climatic trends in the Abay/Upper Blue Nile basin, Ethiopia. Physics and Chemistry of the Earth. 2013;61–62:32-42
Written By
Mohammed Gedefaw
Submitted: 31 March 2023Reviewed: 05 April 2023Published: 06 July 2023
 Open access peer-reviewed chapter