Open Access is an initiative that aims to make scientific research freely available to all. To date our community has made over 100 million downloads. It’s based on principles of collaboration, unobstructed discovery, and, most importantly, scientific progression. As PhD students, we found it difficult to access the research we needed, so we decided to create a new Open Access publisher that levels the playing field for scientists across the world. How? By making research easy to access, and puts the academic needs of the researchers before the business interests of publishers.
We are a community of more than 103,000 authors and editors from 3,291 institutions spanning 160 countries, including Nobel Prize winners and some of the world’s most-cited researchers. Publishing on IntechOpen allows authors to earn citations and find new collaborators, meaning more people see your work not only from your own field of study, but from other related fields too.
This chapter deals with the comparison of four heat transfer fluids (HTFs) for enhanced performance in heat transfer rates on the Sandia experimental LS-2 collector in Sahelian climate. The tested HTFs are dry air, liquid water, Therminol VP-1™, and Syltherm 800. In the literature, the thermal modeling of the parabolic trough solar collectors (PTSCs) is done by assuming: the steady-state or quasi-steady-state regime, the constant properties of HTFs, and others. These assumptions underestimate the transient heat transfer through the HTF flow. Moreover, the best theoretical performance of PTSCs evaluated in terms of idealized processes has not been developed satisfactorily yet. Subsequently, none effective assessment method of the PTSC has been experienced to investigate its transient thermal and thermodynamic sensitivity to (1) the collector, (2) operational, and (3) meteorological parameters. The implemented numerical approach here follows the transient analysis on the first and second laws of thermodynamics published recently. The physical model of a tubular receiver comprised an outer glass envelop, absorber pipe, and heat transfer fluid. Their respective heat rate balance equations were reliably established, discretized by the finite volume method, and efficiently computed. Then, a transient exergy-degradation analysis is conducted and validated using the available experimental results.
Laboratory of Solar Energy, African Institute of Sustainable Energy Technology, Expertise for Africa, Yaoundé, Cameroon
Etienne Tchoffo Houdji*
Department of Renewable Energy, Advanced School of Mines Processing and Energy Resources, The University of Bertoua, Cameroon
Department of Renewable Energy, National Advanced School of Engineering, The University of Maroua, Cameroon
*Address all correspondence to: tchoffohoudji@yahoo.fr
1. Introduction
Solar concentration technologies have gained considerable attention on design, theoretical and practical views and can be applied to generate cost-effective electricity. Thermal solar electricity is generated by concentrating solar energy using a concentrating solar power (CSP), by heating fluid and producing steam, which is then used to power an electrical generator. The parabolic trough solar collectors (PTSC) are the most proven widespread and commercially tested solar energy technologies available for harnessing solar resources [1, 2, 3, 4, 5, 6].
PTSC is essentially composed by the highly reflective mirrors and a receiver tube—also called the heat collection element (HCE) placed at the focal line of the cylindrical concentrator. The receiver tube consists of an absorber pipe enclosed in a glass envelop. The absorber transfers the incident solar concentrated radiation reflected by the mirrors to a heat transfer fluid (HTF) circulating through the absorber. At normal operating conditions, HTF departs from a collector with a certain outlet temperature. The main task of the HTF is to accumulate the thermal energy from the solar field and to transport it into the storage or power block. In many studies, gases (e.g. dry air, steam), liquid water, thermal oils (e.g. Therminol VP-1™, Dowtherm A), nanofluids (e.g. CuO-Syltherm 800, Ag–MgO with water), molten salts (e.g. Hitec, Hitec XL), liquid metals (e.g. sodium-potassium alloys: NaK, pure Lead-Bismuth Eutectic: LBE) and vegetable oils (e.g. Rapeseed, Jatropha) are various types of HTFs currently used. Heat exchangers are employed to transfer energy to steam in a power plant. A steam turbine is used as the prime mover for power generation.
It is well-known that the type of HTF can enhance the PTSC’s performance by significantly affecting the power cycle efficiency and the system cost. There are some expected properties from HTFs. Also, according to Montes et al. [7], the evaluation of HTFs considered in PTSCs, must include the following parameters: corrosion and durability, control strategies during daily operation with startup, shutdown, and sudden changes in weather conditions, among others. Let consider particularly the handling conditions that constantly act on the collectors from startup to shutdown of a daily operation. Thus, PTSCs always have to operate under transient considerations, especially with HTFs involving thermophysical properties that are strongly responsive to working temperature changes.
Furthermore, analyzing HTFs effects on PTSC implies the consideration of (a) the type of the flow, (b) the inlet temperature of fluid, (c) the mass flow rate [8], and (d) the type of HTF, as the sensitive parameters [9].
The reviewed literature shows that a lot of studies have been carried out to model the performance of parabolic trough collectors. In this regard, Montes et al. [7] compared the performance of the parabolic trough collectors using oil, water/steam, or molten salt as heat transfer fluids. Ouagued et al. [10] developed a one-dimensional model dividing the HCE into several segments for PTCs. The numerical results showed that most of the heat gained was collected in the south of Algeria, and the best thermal oil is Syltherm 800. Sa et al. [11] have proposed a transient modeling of PTSC; they used molten salt as an HTF, which replaces the conventional thermal oil. The maximum temperature achieved was 520°C, and the average minimum temperature was 352°C. Marif et al. [12] presented the optical and thermal performance of a PTSC under the climatic conditions of the Algerian Sahara. Two fluids were considered, liquid water and TherminolVP-1™ synthetic oil. Hussein et al. [13] have compiled a detailed study of recent advances with the application of nanotechnology in different kinds of solar collectors. Ghoneim et al. [14] proposed a numerical model to study the effect of different collector parameters and operating conditions on the parabolic trough solar collector performance in the Kuwait climate. Najjar and Sadeq [15], with parabolic trough collector’s system, have presented the performance of a supercritical organic Rankine cycle in a typical environment of Abu Dhabi, United Arab Emirates. They used R500 as an organic working fluid, and the heat transfer fluid used was the Therminol VP-1. Wang et al. [16] designed, fabricated, and tested on a pony parabolic concentrator, a cost-effective single-pass all-glass PTR, consisting of double glass tubes with different diameters, bellows, and stainless steel connecting tubes on both ends. Kessel et al. [17] have proposed an evaluation of the thermal performances of a PTSC under the climatic conditions of the Cameroon Sahelian zones using dry air, liquid water, and TherminolVP-1™ as HTFs. However, no information concerning the transient thermodynamic behavior of PTSC is provided; also, the effects of mass flow rate and wind flow are not studied. Yılmaz and Mwesigye [18] have proposed a reviewed study to improve the thermal performance of PTSCs by modifying and improving the thermophysical properties of the conventional HTF used. Okonkwo et al. [19] carried out a sensitivity analysis to understand the heat transfer parameters that could enhance the thermal performance of the LS-2 collector. Six working fluids were investigated: pressurized water, supercritical carbon dioxide (CO2), Therminol VP-1™, and the addition of copper oxide (CuO), iron (II, III) oxide or magnetite (Fe3O4), and aluminum oxide (Al2O3) nanoparticles to TherminolVP-1™, and the Al2O3-Oil nanofluid provides the best improvement of 0.22% to thermal efficiency. Bellos et al. [20] investigated six different nanoparticles dissolved in hot oil. Effect of varying concentration ratio, solar intensity, and flow rate were calculated using Engineering Equation Solver. Bhargav et al. [8] presented a detailed review of work done optimizing of geometrical components for various applications of parabolic trough collector. Evangelisti et al. [21] investigated a review of the latest advances on solar thermal collectors. They have presented six heat transfer mediums: water, glycol water, molten salts, hydrocarbon oils, phase change material, and nanofluids. Okonkwo et al. [22] proposed a validated model using the Sandia National Laboratory, AZTRAK, platform results. The absorber tube is modeled for five different geometry configurations: a plain tube (smooth tube), a longitudinal finned tube, a tube with a porous insert, a tube with a twisted tape insert, and a wavy (converging-diverging) tube. Al-Oran et al. [23] conducted a study aiming to improve LS-2 parabolic trough model and compare the enhancement effect using different mono and hybrid nanofluids. Inserting mono nanoparticles of aluminum oxide (Al2O3), cerium oxide (CeO2), copper oxide (CuO), and hybrid combinations of Al2O3 with CeO2 or CuO nanoparticles in a Syltherm 800 was investigated by five different cases. Abed et al. [24] conducted a parametric comparison between pure fluids, considering the effect of various inlet fluid temperatures and different Reynolds (Re) numbers on thermal performance. They assessed three main types of pure fluids: water, Therminol VP-1™, and molten salt. Zaharil et al. [25] in their research aimed to evaluate and compare the performances of six different HTFs (Pressurized water, Syltherm 800, Therminol VP-1™, Solar salt, Hitec XL, Liquid sodium) under a wide range of climatic conditions by using the Malaysian climatic condition as reference. Mwesigye and Yilmaz [26] investigated numerically the thermal and thermodynamic performance of a PTSC system with a geometrical concentration ratio valuing 113. More recently, El Kouche et al. [27] modeled the thermal behavior of a parabolic trough collector where the heat transfer fluid has temperature-dependent physical properties.
To summarize, it can be noted that a realistic unsteady state heat exchange model of the PTSC, accounting the variable thermophysical properties of the HTF with the temperature has never been completely proposed in the literature. To account the temperature-dependent variable thermophysical properties of the considered HTFs and all thermal mechanisms, which have been neglected in existing models, a more reliably heat-transfer analysis is carried out in the present research. Also, the second law of the thermodynamic unsteady analysis or the transient exergy-destruction analysis has not extensively been applied on the PTSC according to available literature. Furthermore, three main groups of critical parameters were investigated in the analysis of the thermal and thermodynamic behavior of the parabolic trough solar collector:
The first group of parameters (also called the collector parameters) is composed by the type of the HTF, the solar tracking system, type of reflectors, the concentration ratio of the collector, cross section of the glass envelop and absorber pipe, their length and respectively constitutive material, and the presence or not of the annulus flow.
The second group of parameters (also called the operational parameters) is composed by the inlet temperature, the mass rate flow of the fluid, and the type regime of the flow (either hydrodynamic or thermal).
The third group of parameters (also called the meteorological parameters) is composed by the ambient temperature, solar irradiance, and wind flow around the tubular receiver.
None effective assessment approach of the PTSC has been at present experienced, to investigate his transient thermal and thermodynamic sensitivity to the collector, operational and meteorological parameters. The present work follows the transient both energy and exergy analysis of a parabolic trough solar collector using temperature-dependent thermophysical properties of the HTFs previously developed, tested, and validated with available experimental data in [9]. Now, a comparative numerical analysis of the thermal and exergy transfers into the Sandia experimental LS-2 type collector in Sahelian climate for three types of HTFs is proposed: gas (dry air), liquid water, and thermal oils (Therminol VP-1™ and Syltherm 800). Appendix A shows the correlation of the thermophysical properties of the HTFs used.
On the other hand, the PTSCs are usually located in an open land where strong winds may occur and affect the heat exchange between the solar receiver tube and the ambient air. Thus, concerning the wind velocity influence on PTSC, many researchers have tried different shapes of torque tube, such as cylindrical hollow tube box-type structures. They have investigated the thermal effect of wind velocity on the receiver tube of PTSCs. Hachicha [28] investigated the wind speed effect on the flow field and heat transfer around a parabolic trough solar collector. In another work, Paetzold et al. [29] investigated the airflow in a parametric study reduction of wind load and thermal sand losses in the receiver tubes using the commercial CFD program ANSYS CFX 14.5. Fu et al. [30] simulated the wind structure interaction and optimized their new model. They reduced the collector weight about 5.8% in comparison with the previous model. Hassane et al. [31] investigated the effect of wind speed on the thermal performance of the parabolic trough solar collector in quasi-steady regime operation in the climatic conditions of the city of N’Djamena located in a Sahelian region of the Chad Republic.
We also aim to investigate the transient thermal sensitivity of the LS-2 with the following parameters: specific mass flow rate of an HTF and the wind velocity around the tubular receiver of PTSC.
This chapter is organized as follows: Model of PTSC and thermodynamic implementation devoted to a brief presentation of our model of PTSC considered, the development of transient thermodynamic implementation, and the numeric analyses, and results and discussion, here are highlighted the effects of the following sensitive parameters considered on the Sandia experimental LS-2 type, under the Sahel climate: type of the HTFs, the specific mass flow rate, and wind speed around the receiver.
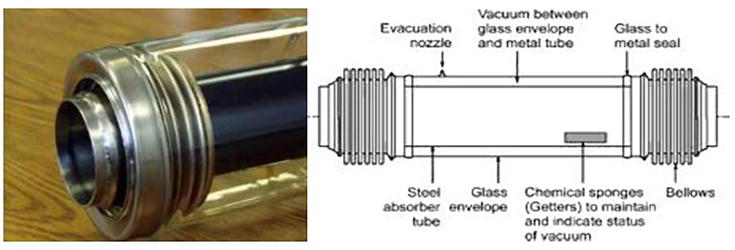
A schematic of the parabolic trough solar collector system under consideration is shown in Figure 1 in which the HCE is a layered system of the glass envelop, the absorber pipe, and HTF. The main energy fluxes appearing in the transient heat transfer equations of the different components of the layered system are known. Mathematically, the system can be described by the transient heat transfer equation for: the glass envelop, the absorber pipe, and HTF. The derivation of these equations is obtained by applying the energy balance principle within each layer element. In other words, the heat transfer model is an energy balance between the heat transfer fluid and its surroundings.
Figure 1.
Heat collection element, adapted from [17]. Useful absorptivity (95%) and useful emissivity (14%) with about 350°C and 400°C supported.
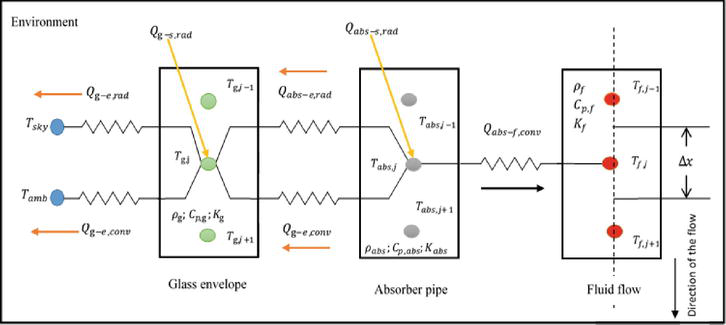
Figure 2 shows the thermal network model in a cross section of the HCE. Readers are encouraged to consult the details, modeling of direct solar radiation and solar radiation availability, assumptions of the heat transfer model, heat transfer balance equations of the heat collector element, and the numerical strategies developed in [9]. It is, therefore, considered that the equations of the mathematical model of the transient heat transfer of glass envelop, absorber pipe, and heat transfer fluid are solved in the cases of the problems considered below, and thus temperatures of these subsystems are simulated. The heat transfer model was compared with other solar receiver models [32]. The obtained temperatures of glass envelop absorber pipe and HTF are then used to build the following energy and exergy analysis.
Figure 2.
The proposed thermal network model of parabolic trough solar collector.
2.2 Unsteady state energetic analysis
By definition, the transient collector thermal efficiency is the ratio of the useful flux delivered to the incident solar irradiance on the concentrator aperture
ηtht=Q̇ufA×IdE1
where the useful flux is given as Q̇uf defined by Eq. (1), by unit of length. Net useful flux or heat gained can be calculated as the total convection heat transfers from the inner surface of the absorber tube to the HTF. The term A×Id is the input irradiance energy, while the quantity A=a is the aperture area of the collector by unit of length. The overall daily average of this efficiency is given as presented in [9, 33] as follows:
In order to be able to compare present results with results obtained in the literature, for installations of different sizes, specific mass flow rates (mass flow rate per the inner absorber pipe cross-sectional area: ṁf) are expressed in kg/s.m.2
The first two terms of the Eq. (3) above represent respectively the exergy gained due to an increase in the HTF temperature due to the solar insolation and the flow friction. The last terms represented in this equation correspond to a reduction of the mechanical energy due to flow friction and the increase of exergy due to kinetic energy, respectively. Considering the Carnot efficiency expression between the local fluid temperature T and the ambient temperature Tamb as formulated by Moran et al. [35]:
ηCarnot=1−Tamb/TE4
Thus, as the authors suggested in a previous published work, Eq. (3) can be rewritten in terms of Carnot efficiency, as follows [9]:
where, Q̇loss,j are the total heat losses on the discretized element j.
Exergy destruction caused by irreversibilities in the solar collector systems is generally due to: (1) friction of viscous fluid and (2) identified heat transfer processes. Therefore, the exergy destruction can numerically be expressed as follows [9]:
∑Ėexdes=∑Ėexdes,∆P+∑Ėexdes,thE8
Exergy destructed due to pressure drop on the discretized element j (∆Pj) during the heat transfer process occurring in the tubular receiver is expressed as in Ref. [34]:
It is well-known that exergy is also destroyed while heat is transferred from hot to cold medium. There are two identified heat transfer processes in the absorber that cause exergy rate destruction: (a) heat transfer of the solar energy absorbed by the surface of the absorber and (b) heat transfer conduction from outer absorber surface to fluid flow due to the temperature difference between the absorber surface and the HTF. Thus, we have the following relation [9]:
∑Ėexdes,th=∑Ėexdes,abs+∑Ėexdes,condE10
The first term corresponds to the process occurring when the heat transfer takes place from the sun to the absorber surface, in this case, the entropy generation (Ėexdes,abs) is defined as in [34]:
Ėexdes,abs=ηoptĖexin,r1+1ψΔxL∑jTambTabs,j−1E11
In this equation, ηopt is the transient optical efficiency of the collector, ψ is the conversion efficiency of a radiation energy, it was derived independently by Petela in 1964 and later at the same year (1976) by Landsberg and Mallinson and Press; thus also call the PLP efficiency and given by [36, 37]:
ψ=1−43TambTs+13TambTs4E12
As a parabolic trough solar collector can only concentrate direct normal radiation, PLP efficiency must take the directional character of this radiation into account. The effect of the sun’s cone angle on the exergy content into the solar radiation was determined by Parrott and expressed as follows:
ψ=1−43TambTs1−cosδs1/4+13TambTs4E13
Tamb is the ambient temperature, Ts≈5800K is the equivalent temperature of the sun as a black body [37], and δs is the half angle of the cone subtended by the sun’s disk δs∼0.005rad on a clear day [38]. The above PLP and Parrott expressions of the conversion efficiency apply just in the case of entirely concentrated solar radiation (concentration ratio about 46,200) and blackbody absorbers.
However, the experimental Sandia LS-2 collector considered in the present analysis has a small concentration ratio C=22.42, and his absorber is not blackbody but selective, characterized by an absorbance (αabs=0.96) and an emittance (εabs=0.14) as in Appendix B. Therefore other, more appropriate, exergy factors can be used as suggested by Badescu [38]. Then, the proposed correlation for the conversion efficiency of a radiation energy converter (operating between a high-temperature radiation reservoir of diluted radiation and a low-temperature heat reservoir) can be given as [38]:
ψ=αabs1−43bl+13bl4E14
where b=TambTs and l the interaction factor is defined by the following expression [38]: l=fsfa×εsεabs×αabs14.
fs is the flux density of the radiation energy incident on the absorber,
fa is the geometric factor, εs is the dilution factor from the radiation reservoir, and εabs is the emittance of the absorber.
The quantity Ėexin,r is defined as exergy related to the theoretical maximum useful work obtainable from solar energy with this device by the following equation [9, 34]:
Ėexin,r=a×L×Id×ψE15
The second heat transfer process is between the absorber and the HTF. The expression of exergy destruction by heat transfer from the absorber to the fluid was proposed by Heugang et al. [9] as follows:
The exergy analysis is concluded by the definition of the transient exergy efficiency, which is the ratio of gain exergy to solar irradiance exergy or the ratio of fluid exergy increment to exergy of solar irradiance normal to the collector aperture [9]:
ηext=Ėexgain,fĖexin,rE17
The overall daily average exergetic efficiency of the PTSC is expressed by [9, 33]:
The Gauss quadrature scheme is used to discretize the thermal and the exergy fluxes, which are deduced from energy and exergy analysis subsections and is also used to numerically evaluate integrals related to all the average quantities considered in the present study. The computational code is written in FORTRAN language compiler.
The Sahelian region of Cameroon is the sample studied location (geographical coordinates: Latitude 5.15°, Longitude 13.58°, and Altitude 718 m). However, it is important to note while this research is using climatic conditions of Sahel, the value of this research extends beyond a Sahel African’s zone itself as it enables the researchers to understand the comparative performances and behaviors of PTSCs under a real world and various climatic conditions. Therefore, the present numerical analysis by providing benchmark numerical results is a considerable theoretical support for further researches and engineering projects.
The Sahelian region of Cameroon is known as a Sudano-Sahelian tropical climate characterized by an irregular rainfall, a low cloudiness of the atmosphere, a hot and dry air, and the permanent aerosols, almost 10 sunniest months of dry seasons and two least sunny months of wet seasons. Then, two seasons are considered: 10 months of hot and dry season with the sunniest months and 2 months of wet season characterized by least sunny months with less sunny days.
3.1 The type of the heat transfer fluids
The HTFs considered in the present work are at temperatures that do not reach the phase change temperature, so that all the time, it is a question of sensible heat instead of latent heat. Any possibility of considering an eventual two-phase flow is excluded from this assumption. It is well-known that the liquid water has high density, high thermal conductivity, and low dynamic viscosity but its specific heat is higher compared to the same respective ones of the Syltherm 800 and the Therminol VP-1™ synthetic oils. Also, as the dry air is a perfect gas, the density, and the dynamic viscosity are almost null. The dry air has poor thermal conductivity, which means that the dry air behaves as a thermal insulator.
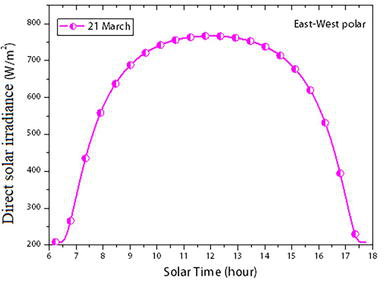
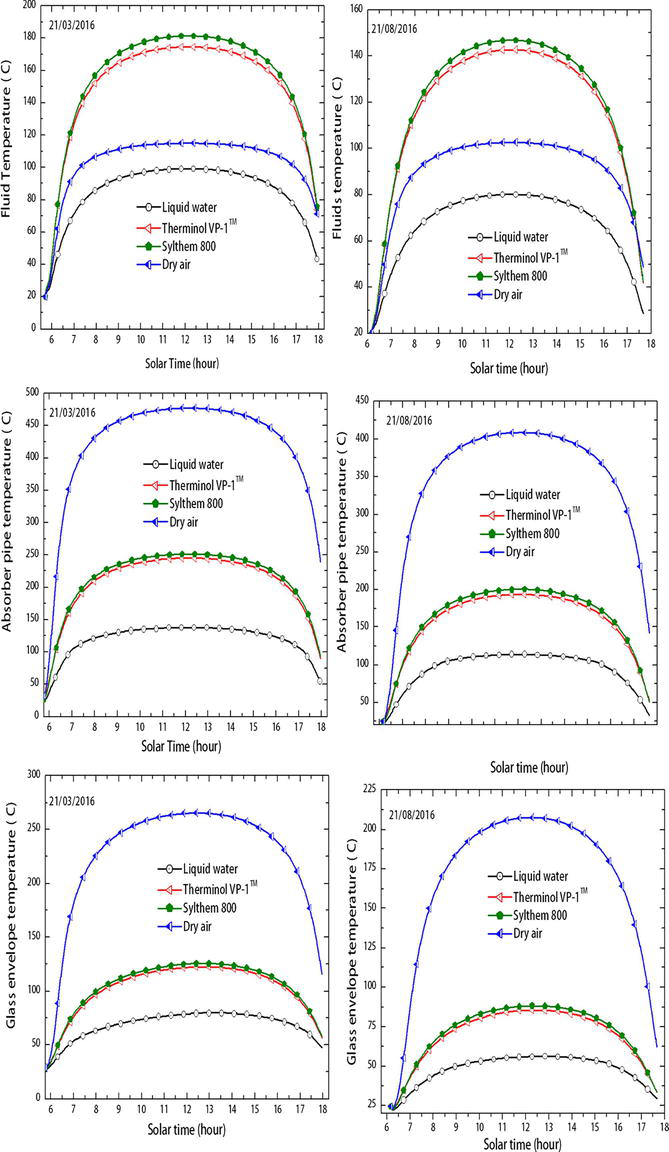
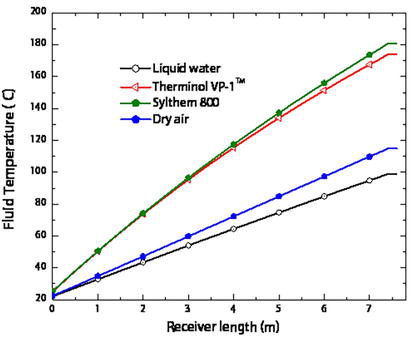
The problem treated in the present subsection is the effect of the HTF’s type on the collector’s behavior to determine the best fluids in the context of Sahelian climatic conditions. The simulation parameters are given as follows: the wind velocity around the collector is 2m/s, the rate flow is 2.7×10⁻⁴kg/s.m2, the fluid inlet temperature is 20°C, and the tracking mode considered is the East-West polar. First of all, let considered Figure 3, which shows the incident direct solar irradiance in the sunny day of the sunniest month at the location where the study was carried. Also, Figure 4 displays the transient temperatures of the ambient and sky at the two typical days considered. Let now consider Figure 5, displaying the transient outlet temperatures of HTFs, absorber pipe, and glass envelop for typical days of the Sahelian climatic conditions (16 and 21 March and 25 August). It is noted that during these two indicated typical days, the exit temperatures of the HTFs, absorber pipe, and glass envelop, all have the same pace in the shape of a bell. This observation is similar to the incident direct solar irradiance depicted in Figure 4a and the transient temperatures of ambient and sky at the considered typical days depicted in Figure 5. It shows the strong influence of the source term linked to direct solar irradiance in the transient thermal response of the glass envelop, the absorber pipe, and the HTFs according to their respective transient heat transfer equations. It also shows that these different subsystems (glass envelop, absorber pipe, and HTFs) are highly interdependent with their thermal behavior closely related. A comparison between the temperature profiles of different fluids used as HTFs is carried out. Figures 5 and 6 show that synthetic oils have the highest temperatures, then follows dry air and finally liquid water; this classification can be observed at the outlet of the collector (temperature variation as a function of time as presented in Figure 5) and along the tubular receiver (see Figure 6).
Figure 3.
Direct solar radiation on a typical sunny day of a sunniest month.
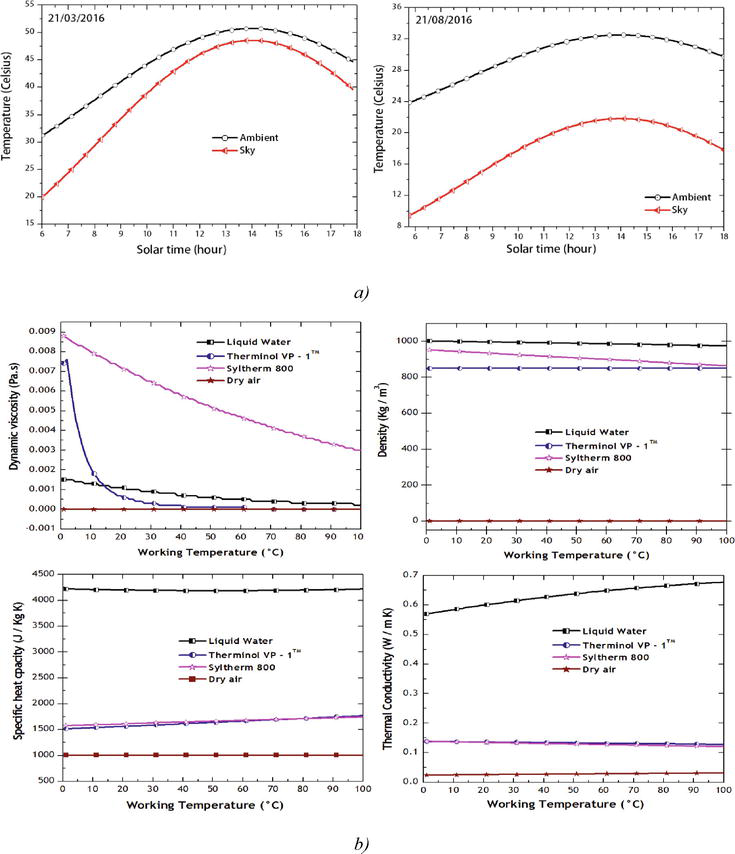
Figure 4.
(a) Transient temperatures of ambient and sky on two typical days of the Sahelian climatic conditions and (b) Thermophysical properties variation of HTFs with temperature.
Figure 5.
Transient temperatures (at outlet of the collector): Fluid, absorber pipe, and glass envelop on two typical days of the Sahelian climatic conditions.
Figure 6.
Temperature distribution of the HTFs along the receiver tube at 13 h.
In an attempt to explain the temperature difference between the HTFs and the temperature differences between the glass envelop and the absorber pipe when the HTFs flow, two reasons seem plausible: the thermal stability of the physical phases of the HTFs and the effects of their thermophysical properties (see Figure 4b). The synthetic oils and water are in liquid phase; they have different phase change temperatures, which predispose them to operate in very different ways, even under the same conditions of thermal stress. The phase changing point of synthetic oils is about 400°C for Syltherm 800 and Therminol VP-1™, while that of water is 100°C. Thus, it is clear that the temperature of water in the physical liquid phase, without the appearance of steam, cannot rise above 100°C. Therefore, its temperature profile is the lowest of all liquids on any given day.
On the other hand, the thermal agitation of the atoms and molecules of dry air, which increases under climatic conditions of the Sahel during the two typical days, explains why, when the entropy production increases the temperature of dry air is both above that of liquid water and below that of synthetic oils. Table 1, reporting the annual thermodynamic performances of PTSC using the different HTFs, summarizes all the quantitative details to better highlight the comparison. It is found that dry air produces the most significant internal heat loss and exergy loss by leakage heat transfer, 16,146.27 and 583,275.21 MWh per year, respectively, expressing too poor thermodynamic behavior of the PTSC, although the exergy destroyed by absorption or conduction is relatively moderate, compared to other HTFs. The argument on the thermophysical properties of fluids can be introduced to explain the higher or lower temperatures of the absorber pipe and of the glass envelop depending on the fluid, which flows in the absorber pipe. It is important to recall that this argument is based on the theory of the heat transfer into the pipe fluid flow. Indeed, the observation made is: the highest temperatures of the glass envelop and absorber pipe occur when the dry air circulates through the absorber pipe, secondly when it comes to synthetic oils, and finally when the liquid water is considered.
Annual values
Dry air
Liquid water
Therminol VP-1™
Syltherm 800
Exergy efficiency (%)
03.18
18.59
26.54
27.83
Thermal efficiency (%)
18.12
67.97
60.73
60.15
Internal geat loss (MWh)
16,146.27
1057.99
3311.62
3515.16
Exergy destructed by absorption (MWh)
443.29
6371.24
2960.36
2882.55
Exergy destructed by conduction (MWh)
4652.02
20,885.09
9068.09
10867.41
Exergy loss by heat leakage loss (MWh)
583,275.21
30,331.51
106,987.04
114246.28
Table 1.
Annual thermodynamic performances of PTSC with different working conditions using dry air, liquid water, Therminol VP-1™, and Syltherm 800 as heat transfer fluids.
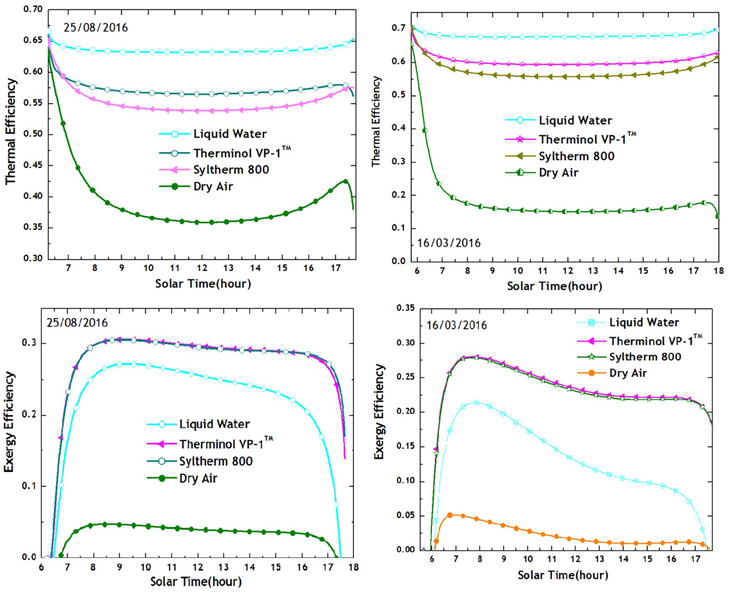
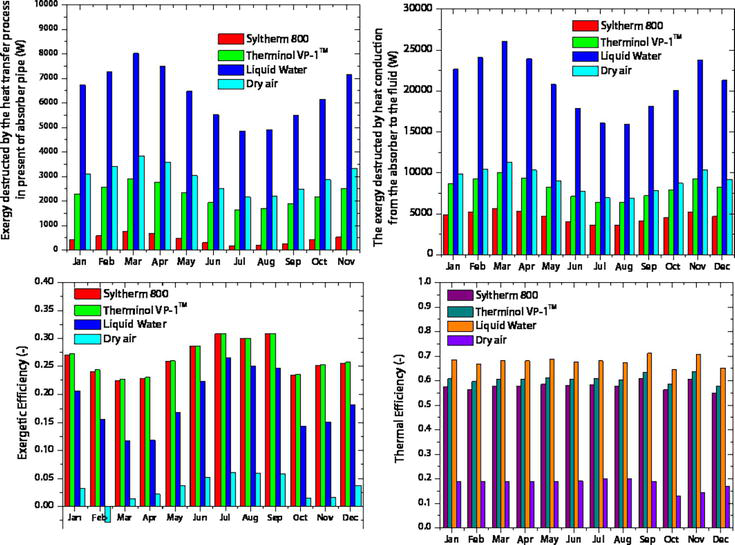
These high values of the temperatures of the glass envelop and absorber pipe are undesirable because they clearly express heat losses. While increasing the temperature of the glass envelop produces a high external heat loss, increasing the absorber tube temperature produces an internal heat loss. The temperatures of the glass envelope and the absorber pipe are all high as the fluid in question generates heat loss. The particular case of dry air can illustrate this. On sunny days, the maximum values of the temperatures of the glass envelop and the absorber pipe are of the order of 400 and 450°C, respectively. On less sunny days, these temperatures are about 200 and 260°C, respectively. It can be concluded that under the same thermal stress conditions, dry air being a gaseous fluid, and therefore atomically less thermally stable than liquids, heats up sufficiently for its temperature to exceed that of the phase change of water (boiling point). But the poor thermophysical properties of dry air, particularly its great inability to store thermal energy (illustrated by a poor specific heat capacity, accentuated with its increasing temperature as depicted by Figure 4b), lead to a considerably heat dissipation through the absorber pipe and the glass envelop. Thus, despite the thermal activities of its atoms and molecules, which are always more important, the temperature of dry air does not exceed those of synthetic oils (examples: absolute errors between the temperatures of dry air and those of Syltherm 800 and Therminol VP-1™ respectively, are for sunny day 62.5 and 58.93% and less sunny day 37.14 and 35.28%). Based on their more excellent thermal stability, synthetic oils can operate at temperatures around 450°C. To show the power of this conclusion, let an analysis based on efficiencies be introduced. For this reason, consider the unsteady thermal and exergy efficiencies at the two typical days (see Figure 7), and the monthly mean thermal and exergetic fluxes and efficiencies under conditions in Sahelian climate over an entire year (see Figure 7). The heat losses, with regard to Figures 7 and 8 and Table 1, are more accentuated in the case of dry air, which has the lowest thermal and exergetic efficiencies during the two typical days and even during all the year. The thermal agitation activities of the excited atoms and molecules of dry air produce a generation of entropy or a destruction of exergy in addition to thermal losses (as described above). In February, for example, the exergy is theoretically wholly destructed. The dry air does not produce any useful work in this month.
Figure 7.
Transient thermal and exergetic efficiencies of the collector for different HTFs on two typical days of the Sahelian climatic conditions.
Figure 8.
Monthly mean daily thermal and exergetic (fluxes and efficiencies) for different HTFs in the Sahelian climatic conditions.
Regarding fluids in liquid phase, synthetic oils, and water, it is noted that water with better thermophysical properties achieves the best thermal efficiency during the two typical days and throughout the year with a monthly mean reaching up to 71.23% in September, and finally liquid water achieves the highest annual thermal efficiency, at about 67.97% (as shown in Table 1), under the numerical experimentation conditions specified at the beginning of this subsection. These results match with those established by Montes et al. [7] and Marif et al. [12], comparing thermal performances of PTSC in the presence of liquid water and Therminol VP-1™. The monthly mean exergy efficiency of water, which is about 26.52% in July, worse than those of synthetic oils, is explained more by a significant accumulation of destruction exergy flows. The first component is the exergy destruction due to the heat transfer from the absorber to the liquid water, caused by the temperature difference between the absorber surface and the agent fluid (with the highest annual value at about 20,885.09 MWh).
The other one is the exergy destruction due to the heat transfer of the solar energy absorbed by the surface of the absorber in the presence of liquid water (with also the highest annual value at about 6371.24 MWh). However, synthetic oils with their temperatures, the highest at the outlet of the collector, achieve the best exergy efficiency during the two typical days and throughout the year, with a maximum monthly mean value during the year equal to 32.3 and 30.87%, in September, respectively for Syltherm 800 and Therminol VP-1™.
Their low monthly mean thermal efficiency of about 63.66% for Syltherm 800 in November and 63.51% for Therminol VP-1™ in September, which are worse than water, is due to the heat losses and the exergy loss by heat leakage loss as reported in Table 1. These heat losses are external (at the level of glass envelop) and internal (at the level of absorber pipe). From these results, liquid water with its high thermal efficiency seems to be a good HTF. However, under the climatic conditions of the Sahel, its precarious thermal stability does not durably guarantee a single-phase flow necessary for the optimal functioning of the PTSC. The risk of the appearance of water vapor mixing with liquid water is almost permanent and can lead to the development of two-phases flows. Synthetic oils, on the other hand, which are much more thermally stable under harsh conditions of the Sahel, are more apt to work at very high temperatures and achieve attractive exergy efficiency. These results confirmed those published previously by Ouagued et al. [10] and Marif et al. [12] in the context of Sahara (Algeria), Kessel et al. [17] in the context of Cameroon Sahelian zones, and Zaharil et al. [25] in the Malaysian climatic condition under the steady-state regime. Ouagued et al. [10] compared various synthetic oils using as HTFs. They concluded that the best thermal oil is Syltherm 800; the Syltherm 800 can reach a temperature between 700 K and 800 K. Marif et al. [12] considered two fluids, liquid water, and TherminolVP-1™ synthetic oil. In the case of synthetic oil, they found that high absorber pipe, glass envelop and output fluid temperatures compared with liquid water case. Nevertheless, the thermal efficiency of the PTSC with water was enhanced by 2% in all seasons to reach a maximum of 72.24% in summer. Kessel et al. [17] came to the conclusion that the maximum of outlet temperature of heat transfer fluid obtained at the right end of the absorber tube is about 140, 138, and 80°C during a typical day of the least sunny months and 180, 180, and 90°C during a typical day of the sunniest month respectively for water, air, and TherminolVP-1™ synthetic oil used as heat transfer fluid.
However, all these researchers have closely restricted their analyses to thermal modeling, and no information in relation to the thermodynamic behavior (or unsteady state exergetic modeling) of PTSC is provided.
On the contrary, Montes et al. [7] pointed out that direct steam generation using water is more efficient than oil and molten salt systems. They conclude that the annual performance seems to be also better for the case of direct steam generation technology as it has a slightly higher nominal overall efficiency than oil or salts. Zaharil et al. [25], proposing a steady-state energetic and exergetic analysis of Pressurized water, Therminol VP-1, Syltherm 800, Solar salt, Hitec XL, and liquid sodium under the Malaysian climate conditions found that liquid sodium outperformed all other HTFs considered at all temperature levels, except for the temperature level of 300 K with a maximum energetic and exergetic efficiency, respectively of 80 and 45.52%. They concluded that liquid sodium outperformed other HTFs between the range of 0.036–0.99% in energetic efficiency and 0.438–0.85% in exergetic efficiency.
3.2 The specific mass flow rate of the heat transfer fluid
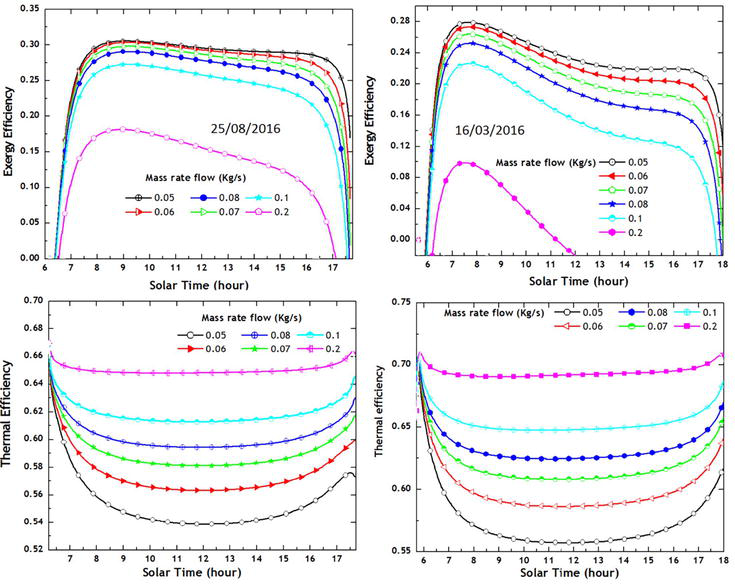
The problem considered in this subsection is to examine how the specific mass flow rate of the HTF affects the thermodynamic behavior of the concentrator. The simulation parameters are: the wind velocity around the collector is 2m/s, the inlet temperature of the HTF is 20°C, the tracking mode considered is the East-West polar, and the HTF considered is the Syltherm 800. The numerical experimentations were made at the two typical days of the Sahelian climatic conditions: the sunny day, 16 March and the less sunny day, 25 August. Figure 8 demonstrates that the transient exergy efficiency decreases with the increase of the specific mass flow rate at the two typical days, but the values of the transient exergy efficiency are lower on the sunny day than its values on the less sunny day. It is also noticed that on the sunny day for ṁfkg/s.m2=6.8×10−4, the transient exergy efficiency runs to midday. After this time, everything else is canceled. So, it seems that for ṁfkg/s.m2>6.8×10−4, at the same date, the transient exergy efficiency will progressively but completely be canceled or will lead to a negative exergetic efficiency.
The meaning of this effect can be explained by the fact that exergy efficiency measures the exergy destruction and/or the exergy loss of the system due to irreversibilities. Yet, the second term of Eq. (5) of the exergy gained, which is negative, represents the decrease of mechanical energy due to flow friction (an irreversible process). This term increases in time with the specific mass flow rate and becomes considerably important, particularly on the sunny day, compared to the increase of other terms, with the increase of specific mass flow rate. To illustrate the dominant influence of mass flow rates on the exergy efficiency, it is considered the daily average based on the same implementation to obtain Figure 8 of the exergy efficiency computed for some indicated values of the specific mass flow rate on these 2 days. For ṁfkg/s.m2=1.72.7and6.8×10−4, for example, on the sunny day the exergy efficiencies are respectively 25.13, 20.26, and −0.81% and on the less sunny day the exergy efficiencies are respectively 30.30, 27.57, and 14.43%. On the contrary, Figure 9 shows that the transient thermal efficiency increases, while the specific mass flow rate increases these 2 days. In this case, the PTSC achieves its best performance on the sunny day with higher thermal efficiency than the one performed on the less sunny day. Indeed, it is established that the tube flow with a high specific mass flow rate induces moderated temperature of both absorber pipe and fluid, resulting in low heat losses. Let note the daily average of transient thermal efficiency, for the same range of the specific mass flow rate on these two typical days, ṁfkg/s.m2=1.72.7and6.8×10−4: on the sunny day the thermal efficiencies are respectively 59.31, 64.80, and 69.88% and on the less sunny day they are respectively 56.65, 61.13, and 65.31%. The effects of specific mass flow rates on the main thermodynamic performances parameters, such as thermal and exergy outputs (fluxes) and thermal and exergetic efficiencies throughout the year are reported in the Table 2. The decrease of the internal heat loss and exergy loss can be observed and the increase of the exergy destructed as a function of the specific masse flow rate too.
Figure 9.
Transient thermal and exergetic efficiencies of the collector for different mass flow rates on two typical days of the Sahelian climatic conditions.
specific mass flow rate 10−5ṁfkg/s.m2
Annual values
Fluxes (MWh)
Efficiency (%)
Internal Heat loss
Exergy loss
Exergy destructed
Thermal
Exergetic
17
1,949.45
62,025.51
10,019.98
32.60
12.89
27
1,104.61
33,085.99
13,956.52
35.08
09.59
68
834.47
24,104.99
16,122.14
35.86
07.32
17.1
113.25
2,539.32
36,368.29
37.70
—
680
167.59
3,624.77
54,566.68
37.34
—
Table 2.
Annual thermodynamic performances with different specific mass flow rates.
On one side, the internal heat loss and exergy loss vary respectively from 1,949.45 MW and 62,025.51 MWh for 2.7×10⁻⁴kg/s.m2 to 167.59 MWh and 3,624.77 MWh for 6.8×10⁻³kg/s.m2 by year. On the other side, the exergy destructed increases from 1,0019.98 MWh for 1.7×10⁻⁴kg/s.m2 to 54,566.68 MWh for 6.8×10⁻³kg/s.m2 by year. It can also be experienced that the observations made on the two typical days above remain the same concerning the opposite transient evolution of the thermal and exergetic efficiencies in relation to the specific mass flow rate. While the thermal efficiency increases from 32.60% for 1.7×10⁻⁴kg/s.m2 to 37.34% for 6.8×10⁻³kg/s.m2, the exergetic efficiency decreases from 12.89% for 1.7×10⁻⁴kg/s.m2 to a negative value −35.41% for 6.8×10⁻³kg/s.m2. At this stage, it is not superfluous to precise that for 1.71×10⁻³kg/s.m2 the annual average of thermal and exergetic efficiencies are respectively 37.7% and −16.9%. Thus, with the specific mass flow rates such as 1.71×10⁻³kg/s.m2 and 6.8×10⁻³kg/s.m2, verifying the condition ṁfkg/s.m2>6.8×10−4, the explanations proposed in the second paragraph of this subsection in the case of exergy efficiency are valid here in the case of exergy destructed; it is convenient to underline the similitude of the respective expressions. Moreover, the other irreversible processes in the system responsible of exergy destruction are (a) the heat transfer from the absorber pipe to the HTF at finite temperature difference noted Ėexdes,th; (b) the viscous friction fluid between the collector fluid and the pipe due to pressure drop during this process (Eq. (9)). This last flux is often null in situations involving very low mass flow rate (ṁfkg/s.m2∼2.7×10−4). But for high value of specific mass flow rate, this flux becomes considerable. Computations have shown that the annual values of exergy destructed due to friction between the collector fluid and the pipe is important, especially 4.9×10⁻³ MWh for 1.71×10⁻³kg/s.m2 and 35.87×10⁻²MWh for 6.8×10⁻²kg/s.m2 under the conditions used in the above numerical simulations. These results are in accordance with those outlined previously by two other research groups: Padilla et al. [34] and Kumar and Kumar [39]. The first, that is to say, Padilla et al. [34] investigated the steady-state energy and exergy performance analysis using Syltherm 800 of the SEGS LS-2 parabolic trough solar collector. They concluded that the optimal performance of PTSC is independent of the specific mass flow rate, since the exergy destruction is due to: (1) friction of the heat transfer fluid, and (2) heat transfer between the absorber and the HTF. However, their contribution to the total exergy wasted is less than 0.5%. The group from Kumar and Kumar [39] investigated the steady-state thermal behavior of a PTSC using rather water. They found that collectors’ performance chiefly depends upon the specific mass flow rate, and no considerable change is found when the specific mass flow rate of water is more than 8.21×10⁻⁵kg/s.m2. In the present study, Syltherm 800 is considered; the limit of the specific mass flow rate reached in our case is 6.8×10⁻⁴kg/s.m2, below which the exergy efficiency cancels and thermal efficiency changes very slowly. Also, Marefati et al. [40] concluded (as in the present study) their thermal analysis of the PTSC for four cities of Iran with different weather conditions (Shiraz, Yazd, Tehran and Tabriz) in different months, by stating that efficiency and output useful energy of the collector increase by specific mass flow rate from 3×10⁻²kg/s.m2 to 5×10⁻²kg/s.m2. However, the collector outlet temperature decreases by specific mass flow rate. By contrast, by decreasing the specific mass flow rate from 3×10⁻²kg/s.m2 to 1×10⁻²kg/s.m2, the collector’s efficiency, and useful energy output decrease, but collector output temperature increases.
3.3 Wind velocity effect on the heat transfer around a tubular receiver
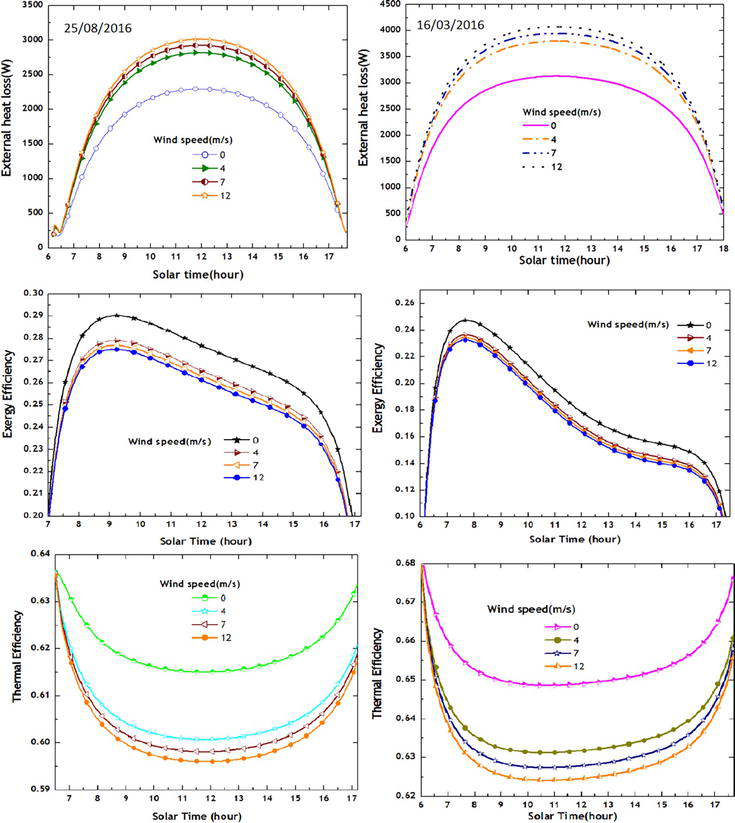
This section investigates the problem of convection heat losses to the ambient as an effect of wind flow on the heat transfer around the PTSC structure. So, the results of numerical simulations of wind velocity effects on the heat transfer close to the HCE are presented and discussed. Since the absorber is enclosed in a glass envelop, the glass cover insulates the absorber surface from convective heat loss due to wind. Therefore, effectiveness of the glass cover can be tested by varying the wind velocity and computing specific parameters of the PTSC for changes. The transient key parameters displayed in this study are the external heat losses, the exergy loss due to heat transfer from absorber to the ambient, the heat loss coefficient, and the thermal and exergy efficiencies. This problem has received the great attention of researchers, such as Hachicha [28]. The simulation parameters are: the specific mass flow rate of 3×10⁻³kg/s.m2, the inlet temperature of the HTF at 20°C, the tracking mode considered at the East-West polar, and the HTF considered is the Syltherm 800. A uniform wind velocity in the inlet velocity profile is assumed, and the different used values of the wind velocity are Vwindm/s=0147and12. The numerical simulations are made on the two typical days of the Sahelian climatic conditions: the sunny day, 16 March and the less sunny day, 25 August; then depending on these days and meteorological conditions, convection around the HCE might be free or forced. Figure 10 shows the transient variation of the heat transfer from a PTSC in crossflow to analyze the influence of wind velocity. It can be noticed that the transient external heat loss increases with the wind velocity on the two typical days. However, the transient thermal and exergetic efficiencies, which have the same time variation, decrease with the increase of the wind velocity. Consider now the overall daily values of these efficiencies the 16 March and the 25 August, the two named typical days, reported in Table 3. It can be seen that for Vwindm/s=0147and12, the thermal efficiency values are respectively 66.81, 66.20, 65.40, 65.11, and 64.88% on the sunny day and 62.85, 62.28, 61.63, 61.42, and 61.24% on the less sunny day; the exergy efficiency values are respectively 18.99, 18.61, 18.08, 17.88, and 17.71% on the sunny day and 27.07, 26.66, 26.13, 25.94, and 25.78% on the less sunny day. Table 3 also shows that the variations remain the same by considering the annual average values of the parameters to the variation of wind velocity.
Figure 10.
Transient external heat loss and exergetic and thermal efficiencies of the collector for different wind velocities on two typical days of the Sahelian climatic conditions.
wind velocity m/s
Annual values
Overall daily average values of Efficiencies (%)
External Heat loss (MWh)
Thermal Efficiency (%)
Exergy Efficiency (%)
Thermal
Exergy
Sunny day
Less sunny day
Sunny day
Less sunny day
0
3,004.07
71.24
25.17
66.81
62.85
18.99
27.07
1
3,304.60
71.19
24.60
66.20
62.28
18.61
26.66
4
3,710.31
71.12
24.18
65.40
61.63
18.08
26.13
7
3,856.33
71.10
23.97
65.11
61.42
17.88
25.94
12
3,977.56
71.08
23.80
64.88
61.24
17.71
25.78
Table 3.
Wind velocity effects on the heat transfer around a PTSC in Sahelian climatic conditions.
Let illustrate these observations by presenting the increase of the annual values of the external heat loss in the same range of the wind velocity. The annual values of the external heat loss are: 3,004.07, 3,304.60, 3,710.31, 3,856.33, and 3,977.56 MWh by year, respectively for Vwindm/s=0147and12; thus, it can be concluded that the variation described above, that is. external heat loss vs. wind velocity, leads to an increment of 24.47%. In the cases of thermal and exergetic efficiencies, the decrement, following the same rhythm for the given wind velocity: Vwindm/s=0147and12, are respectively 0.22 and 5.44%. It can be concluded that the annual values of the efficiencies do not vary significantly in the range of the wind velocity considered.
For Figure 9, the specific mass flow rate considered is 1.03×10⁻¹kg/s.m2 on the least sunny month. The considered values of the wind velocity for this numerical experimentations, in these cases, are Vwindm/s=0,0.5124710and12. It can be seen from Figure 10 that the transient thermal efficiency globally decreases with the increase of the ambient wind speed, while the transient heat loss coefficient increases with ambient wind speed. However, beyond Vwindm/s≥2, the variation of the exergy loss is slow and tends to be insignificant with the increase of the ambient wind velocity. This observation confirms the other one made before, concerning the slow evolution of the overall daily and annual average values of the thermal and exergetic efficiencies reported in Table 3. This result obtained in the case of vacuum in the annulus receiver tube is in agreement with those published by Padilla et al. [34] and Zaharil et al. [25]. Padilla et al. [34] found that vacuum in annulus mitigates the effect of wind speed. However, its absence increases the thermal losses to the surroundings, which reduces both thermal and exergy efficiencies, and they concluded that the effect of wind speed is negligible. Zaharil et al. [25] concluded that wind speed increment has a negligible impact on PTSC’s performance for all HTFs, with liquid sodium being the most resistant to any wind increment with reduction of only 0.0482 and 0.0482276% for energetic and exergetic efficiency, respectively, when wind velocity increases from 2 m/s to 18 m/s.
In the present study, the effective approach recently developed in [9], based on transient both thermal and exergetic performances of the Sandia National Laboratory, is applied with the view to examine the sensitivity of the thermal behavior of a PTSC to the following parameters in the Sahelian climatic conditions: the collector parameters, including the type of the HTF, the operational parameters, related to specific mass flow rate of the HTF, and the wind velocity around the collector. The energetic and exergetic analysis provided the following results:
Concerning the working fluids selection, the Syltherm 800, which is more thermally stable, among Therminol VP-1™, liquid water, and dry air, is more apt to work at very high temperature at about 450°C and achieves overall annual daily average of thermal and exergy efficiencies, respectively 60.15 and 27.83%. However, it must be taken into account that these values have been calculated according to very specific assumptions, such as the solar-only plant without power cycle and thermal storage.
Concerning the effects of specific mass flow rate, the exergy destructed increases from 10,019.98MWh for 1.7×10⁻⁴kg/s.m2 to 54,566.68MWh for 6.8×10⁻³kg/s.m2 by year; the internal heat loss and the exergy loss vary respectively from 1,949.45 and 62,025.51MWh for 1.7×10⁻⁴kg/s.m2 to 167.59 and 3,624.77MWh for 6.8×10⁻³kg/s.m2 per year. Exergy and thermal efficiency have an opposite transient evolution. In addition, for specific mass flow rate ṁkg/s.m2>6.8×10−4, the exergy efficiency decreases progressively, and completely cancels or leads to negative value. However, these values have been calculated according to a specific assumption: the solar-only plant without power cycle and thermal storage, is considered. Thus, other engineering issues such as control, materials, and the economic analysis must account in the HTF technology evaluation.
About the impacts of the wind velocity on the collector heat transfer, the annual values of the external heat loss are: 3,004.07, 3,304.60, 3,710.31, 3,856.33, and 3,977.56 MWh per year, respectively for Vwindm/s=0147and12; thus, the variation described above i.e., external heat loss vs. wind velocity, leads to an increment of 24.47%. In the cases of thermal and exergetic efficiencies, and following the same rhythm for the given wind velocity: Vwindm/s=0147and12, the decrement is respectively 0.22 and 5.44%. It can be concluded that the annual values of the efficiencies do not vary significantly in the range of the wind velocity considered.
The authors thank the editor and reviewers for useful comments and suggestions. The authors would like to convey thanks to R. Tchitnga, Department of Physics, University of Dschang, Cameroon, for his valuable proofreading of the manuscript.
Direct; the overall daily value of optical, thermal, and exergetic efficiency
Dest
Destructed
Ex
Exergy
F
Fluid or Heat transfer fluid (HTF)
G
Glass
In
Inlet, input
L
Loss
Opt
Optical
Out
Outlet, output
P
Pressure
R
Irradiance
Th
Thermal
wind
Wind
Superscripts
T
Previous time step
t+∆t
Present time step
References
1.Kalogirou AS. Solar thermal collectors and applications. Progress in Energy and Combustion Science. 2004;30:231-295. DOI: 10.1016/j.pecs.2004.02.001
2.Nixon JD, Dey PK, Davies PA. Which is the best solar thermal collection technology for electricity generation in north-West India? Evaluation of options using the analytical hierarchy process. Energy. 2010;35:5230-5240. DOI: 10.1016/j.energy.2010.07.042
3.Ehtiwesh ASI, Neto DSF, Sousa CMA. Deployment of parabolic trough concentrated solar power plants in North Africa—A case study for Libya. International Journal of Green Energy. 2019;16(1):72-85. DOI: 10.1080/15435075.2018.1533474
4.Sueyoshi T, Goto M. Comparison among three groups of solar thermal power stations by data envelopment analysis. Energies. 2019;12(2454):1-20. DOI: 10.3390/en12132454
5.Yudong L, Fangqin L, Jianxing R, Guizhou R, Honghong S, Gang L. Solar thermal power generation technology research. E3S Web of Conferences. 2019;136:02016. DOI: 10.1051/e3sconf/201913602016
6.Taylor N. Solar Thermal Electricity: Technology Development Report. Luxembourg: EUR 29913 EN, Publications Office of the European Union; 2019. DOI: 10.2760/67261 ISBN 978-92-76-12535-8. JRC118040
7.Montes JM, Abandas A, Martinez-Val MJ. Thermofluidynamic model and comparative analysis of parabolic trough collectors using oil, water/steam, or molten salt as heat transfer fluids. Journal of Solar Energy Engineering. 2010;132:1-7. DOI: /10.1115/1.4001399
8.Bhargav HU, Amitkumar JP, Ramana PV. A detailed review on solar parabolic trough collector. International Journal of Ambient Energy. 2019;43:176-196. DOI: 10.1080/01430750.2019.1636869
9.Heugang NAS, Kamdem THT, Tchoffo HE, Pelap FB. Transient energy and exergy analysis of parabolic trough solar collector with an application to Sahel climate. International Journal of Sustainable Energy. 2020;40(6):557-583. DOI: 10.1080/14786451.2020.1828418
10.Ouagued M, Abdallah K, Larbi L. Estimation of the temperature, heat gain and heat loss by solar parabolic trough collector under Algerian climate using different thermal oils. Energy Conversion and Management. 2013;75:191-201. DOI: 10.1016/j.enconman.2013.06.011
11.Sa M, Zaversky F, Medina R, Garcı J, Astrain D. Object-oriented modelling for the transient performance simulation of parabolic trough collectors using molten salt as heat transfer fluid. Solar Energy. 2013;95:192-215. DOI: 10.1016/j.solener.2013.05.015
12.Marif Y, Hocine B, Hamza B, Mohamed MB, Moussa Z. Numerical simulation of solar parabolic trough collector performance in the Algeria Saharan region. Energy Conversion and Management. 2014;85:521-529. DOI: 10.1016/j.enconman.2014.06.002
13.Hussein AK. Applications of nanotechnology to improve the performance of solar collectors – Recent advances and overview. Renewable and Sustainable Energy Reviews. 2016;62:767-792. DOI: 10.1016/j.rser.2016.04.050
14.Ghoneim AA, Mohammedein AM. Parabolic trough collector performance in a hot climate. Journal of Energy Engineering. 2016;142(1):1-11. DOI: 10.1061/(ASCE)EY.1943-7897.000026
15.Najjar YSH, Sadeq J. Modeling and simulation of solar thermal power system using parabolic trough collector. Journal of Energy Engineering. 2017;143(2):1-9. DOI: 10.1061/(ASCE)EY.1943-7897.0000404
16.Wan Y, Zhu Y, Chen H, Yang L, Yang M. Thermal performance of a single-pass all-glass parabolic trough receiver. Journal of Energy Engineering. 2016;143(1):1-7. DOI: 10.1061/(asce)ey.1943-7897.0000381
17.Kessel JP, Haman-Djalo BT, Tchoffo EH, Heugang SN. Optical and thermal performances of a solar parabolic trough collector under climate conditions of the Cameroon Sahelian regions. International Journal of Innovative Science and Research. 2017;29(2):149-165
18.Mwesigye A, Yılmaz İH. Thermal and thermodynamic benchmarking of liquid heat transfer fluids in a high concentration ratio parabolic trough solar collector system. Journal of Molecular Liquids. 2020;319(1):114151. DOI: 10.1016/j.molliq.2020.114151
19.Okonkwo EC, Essien EA, Abid M, Kavaz D, Ratlamwala TA. Thermal performance analysis of a parabolic trough collector using water-based green-synthesized nanofluids. Solar Energy. 2018;170:658-670. DOI: 10.1016/j.solener.2018.06.012
20.Bellos E, Tzivanidis C. Thermal efficiency enhancement of nanofluid based parabolic trough solar collectors. Journal of Thermal Analysis and Calorimetry. 2019;135:597-608. DOI: 10.1007/s10973-018-7056-7
21.Evangelisti L, De Lieto RV, Asdrubali F. Latest advances on solar thermal collectors: A comprehensive review. Renewable and Sustainable Energy Reviews. 2019;114:1-20. DOI: 10.1016/j.rser.2019.109318
22.Okonkwo EC, Abid M, Ratlamwala TAH. Comparative study of heat transfer enhancement in parabolic trough collector based on modified absorber geometry. Journal of Energy Engineering. 2019;145(3):1-16. DOI: 10.1061/(ASCE)EY.1943-7897.0000602
23.Al-Oran O, Lezsovits F, Aljawabrah A. Exergy and energy amelioration for parabolic trough collector using mono and hybrid nanofluids. Journal of Thermal Analysis and Calorimetry. 2020;140:1579-1596. DOI: 10.1007/s10973-020-09371-x
24.Abed N, Afgan I, Cioncolini A, Iacovides H, Nasser A. Assessment and evaluation of the thermal performance of various working fluids in parabolic trough collectors of solar thermal power plants under non-uniform heat flux distribution conditions. Energies. 2020;13:1-27. DOI: 10.3390/en13153776
25.Zaharil HA, Hasanuzzaman M. Modelling and performance analysis of parabolic trough solar concentrator for different heat transfer fluids under Malaysian condition. Renewable Energy. 2020;149:22-41. DOI: 10.1016/j.renene.2019.12.032
26.Yılmaz HI, Mwesigye A. Modeling, simulation and performance analysis of parabolic trough solar collectors: A comprehensive review. Applied Energy. 2018;225:135-174. DOI: 10.1016/j.apenergy.2018.05.014
27.El Mghouchi Y, El Bouardi A, Choulli Z, Ajzoul T. Models for obtaining the daily direct, diffuse and global solar radiations. Renewable and Sustainable Energy Reviews. 2016;56:87-99. DOI: 10.1016/j.rser.2015.11.044
28.Hachicha AA. Numerical Modelling of a Parabolic Trough Solar Collector. Doctorate thesis in physics,. Spain: Universitat Politècnica de Catalunya; 2013. pp. 1-177. DOI: 10.5821/dissertation-2117-95129
29.Paetzold J, Cochard S, Vassallo A, Fletcher DF. Wind engineering analysis of parabolic trough solar collectors: The effects of varying the trough depth. Journal of Wind Engineering and Industrial Aerodynamics. 2014;135:118-128. DOI: 10.1016/j.jweia.2014.10.017
30.Fu W, Yang MC, Zhu YZ, Yang L. The wind-structure interaction analysis and optimization of parabolic trough collector. Energy Procedia. 2015;69:77-83. DOI: 10.1016/j.egypro.2015.03.010
31.Hassane MB, Njomo D, Barka M, Youssouf MK, Goron D, Chara-Dackou VS, et al. Modeling the incident solar radiation of the City of N’Djamena (Chad) by the Capderou method. International Journal of Photoenergy. 2020;6292147:1-10. DOI: 10.1155/2020/6292147
32.Eskin N. Transient performance analysis of cylindrical parabolic concentrating collectors and comparison with experimental results. Energy Conversion and Management. 1999;40:175-191. DOI: 10.1016/S0196-8904(98)00035-1
33.Goswami DY. Principles of Solar Engineering. 3rd ed. Group LLC: Taylor & Francis; 2015
34.Padilla RV, Fontalvo A, Demirkaya G, Martinez AQ, Arturo G. Exergy analysis of parabolic trough solar receiver. Applied Thermal Engineering. 2014;67:1-8. DOI: 10.1016/j.applthermaleng.2014.03.053
35.Moran JM, Shapiro NH, Boettner DD, Bailey B. Fundamentals of Engineering Thermodynamics. 7th ed. USA: John Wiley and Sons; 2011
36.Fujiwara M. Exergy analysis for the performance of solar collectors. Journal of Solar Energy Engineering. 1983;105:163-167. DOI: 10.1115/1.3266360
37.Petela R. Exergy of undiluted thermal radiation. Solar Energy. 2003;74:469-488. DOI: 10.1016/S0038-092X(03)00226-3
38.Badescu V. How much work can be extracted from diluted solar radiation? Solar Energy. 2018;170:1095-1100. DOI: 10.1016/j.solener.2018.05.094
39.Kumar D, Kumar S. Thermal performance of solar parabolic trough collector at variable flow rates: An experimental investigation. International Journal of Ambient Energy. 2018;39(1):93-102. DOI: 10.1080/01430750.2016.1269673
40.Marefati M, Mehrpooya M, Shafii MB. Optical and thermal analysis of a parabolic trough solar collector for production of thermal energy in different climates in Iran with comparison between the conventional nanofluids. Journal of Cleaner Production. 2018;175:294-313. DOI: 10.1016/j.jclepro.2017.12.080
41.Liang H, You S, Zhang H. Comparison of different heat transfer models for parabolic trough solar collectors. Applied Energy. 2015;148:105-114. DOI: 10.1016/j.apenergy.2015.03.059
Written By
Steven Audrey Heugang Ndjanda and Etienne Tchoffo Houdji
Submitted: 19 January 2024Reviewed: 01 February 2024Published: 26 March 2024