Open Access is an initiative that aims to make scientific research freely available to all. To date our community has made over 100 million downloads. It’s based on principles of collaboration, unobstructed discovery, and, most importantly, scientific progression. As PhD students, we found it difficult to access the research we needed, so we decided to create a new Open Access publisher that levels the playing field for scientists across the world. How? By making research easy to access, and puts the academic needs of the researchers before the business interests of publishers.
We are a community of more than 103,000 authors and editors from 3,291 institutions spanning 160 countries, including Nobel Prize winners and some of the world’s most-cited researchers. Publishing on IntechOpen allows authors to earn citations and find new collaborators, meaning more people see your work not only from your own field of study, but from other related fields too.
To purchase hard copies of this book, please contact the representative in India:
CBS Publishers & Distributors Pvt. Ltd.
www.cbspd.com
|
customercare@cbspd.com
This chapter considers the use of different capacitated clustering problems and models that fits better in real-life applications such as household waste collection, IT teams layout in software factories, wholesales distribution, and staff’s home collection or delivery to/from workplace. Each application is explored in its regular form as it is being developed by contractors and/or users. We consider for each application the aspects of solving the problem by the appropriate mathematical programming model and decision support methodology (using aggregated Geographical Information System and mobile technology) to hold correctly and most precisely the problems and difficulties related to instances in evaluation. The experience on these fields is here revealed in detailed form as the results obtained by using the techniques here explained.
*Address all correspondence to: marcos.negreiros@uece.br
1. Introduction
Clustering is a problem related to the process of assigning individuals to several disjoint partitions. Clustering problems can be classified in several ways. The methodology related to this study borns with the min-sum of squares clustering problem (MSSCP), [1, 2]. Its objective is to minimize the function of the least-squares distance between individuals to the geometric center of their partitions, such that the number of clusters to be built is known. This nonlinear binary problem is NP-Hard and can fit to several analytic applications such as classification, machine learning, partitioning, covering, location, and it is fully used by researchers to follow solutions to diverse type of important optimization problems linked with artificial intelligence (AI), [3, 4, 5, 6, 7, 8].
To better understand the problem mathematically, suppose we have,
I: the set of individuals/items (∣I∣=n).
J: be the set of centers (∣J∣=m).
∣J∣=p: is the fixed number of clusters.
p: can also be the number of clusters.
L: is the set of the dimensions of the Euclidean space. L=12 and l=∣L∣.
In the MSSCP model, the objective function (1) minimizes the total Euclidean distance from the items to their centers. The constraint (2) indicates the unique assignment of each item to a center of the cluster. Finally, constraints (3) and (4) refer to the decision variables. The MSSCP problem is NP-Hard, as indicated by Hansen & Jummar [3].
The continuous relaxation for MSSCP whose objective function is neither convex nor differentiable can be modified to be differentiable and convex.
The following mathematical development is in the work of [9], and it is a new formulation for the MSSC problem.
Let aik≥0,k=1,2,…,l be the coordinates of the given point ai∈Rl,i∈I. It is not difficult to consider a hyper-cube in Rl, whose edge length is M, in which all points ai,∀i∈I are included (M is the maximum dispersion between any two points of P).
We know that xij∈01,i∈I,j∈J, so we can write the following,
Quadratic constraints (6) form a convex set. This MSSC model can be implemented with success using XPRESS, CPLEX, and GUROBI optimization software because they already consider these constraints, then they can solve instances up to 1480 items, [10].
From location problems, the generalized p-median problem (gpMP) was introduced by Negreiros et al. [11] to be a kind of problem defining clusters by the individuals assigned to p-centers (items that are medians of the groups) that are closest to the sum-of-distances from the others of the same group. This new problem is linear and binary, and it is also NP-Hard. It is equally important in many analytic applications as the ones here developed.
For the Generalized p-Median Problem (gpMP) consider:
I: is the set of individuals.
J: is the set of possible medians (all individuals), J⊆I.
K: is the set of groups;
dij: is the shortest distance from individual i to its median j.
In the gpMP model, the objective function (11) minimizes the total distance from the items to their median centers that are items from the set of items. The constraint (12) indicates the unique assignment of each item to a median of the cluster. Constraint (13) refers to the existence of a median if there is an assignment to it. Constraints (14) and (15) refer to a generalized assignment between items and their related median. In the constraints (16)–(18), we have the decision variables. The gpMP problem is also NP-Hard, [11].
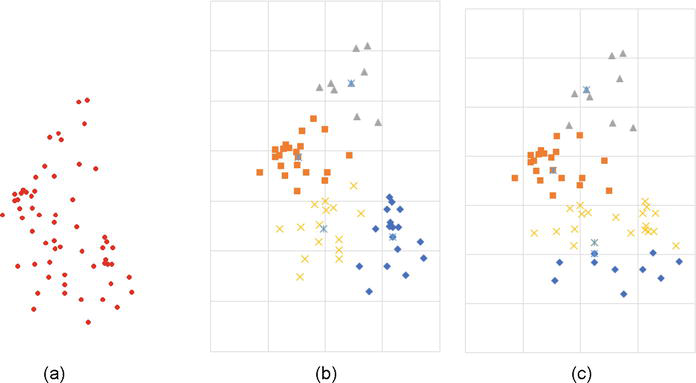
A solution for both MSSCP and gpMP of a classical 50-item instance German Towns (Figure 1a) and four centers can be seen in Figure 1b and c. In both problems, we find the same structure of partitioning for clustering, but with different objectives and final solution representation. In the MSSCP, the final centers of the clusters are not part of the instance but with gpMP the centers are all part of the instance and the solution, Figure 1(c).
Figure 1.
Different clustering solutions of the same instance for distinct models and objectives. (a) Instance German Towns. (b) MSSC instance solution. (c) gpMP instance solution.
The introduction of knapsack constraints to clustering problems was done by Mulvey & Beck [12] when they proposed the capacitated p-median problem CpMP. In this step, the clustering problems find a new research development segment in real applications. It is also a linear binary NP-Hard problem, because of this it became widely studied by many authors. In this problem, the capacity of each median can be distinct. The problem can be represented as follows:
I: is the set of individuals/items (∣I∣=n).
J: is the set of medians (∣J∣=m). ∣J∣=p is the fixed number of clusters.
p: is the given number of clusters/medians.
dij is the distance from individual i to its median j.
The objective function (19) minimizes the distance between medians and items assigned to each median. The constraint (20) defines that every item is to be assigned to exactly one median. The constraint (21) complements constraint (20) to indicate each item may be assigned to some other item that is used as a median. The constraint (22) considers the items demand may not overpass the limited capacity of the median they are assigned to. The constraint (23) limits the number of medians used from the set of medians. The constraints (24) and (25) refer to the decision variables of the problem.
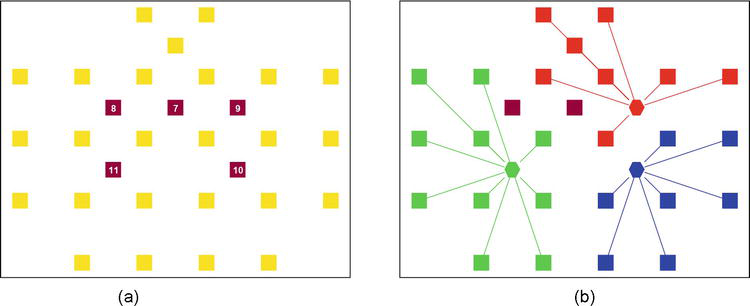
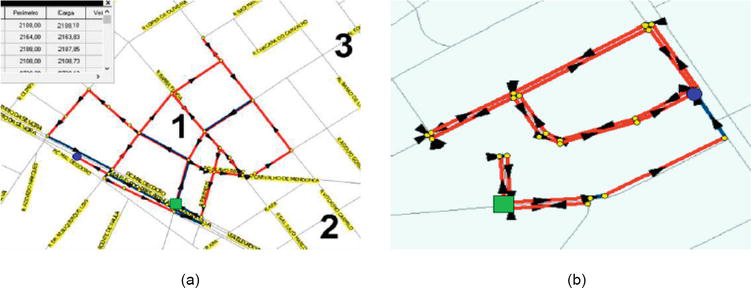
At first it is considered that the set of medians are disjoint from the set of items, and as can be observed each median has its own maximum capacity, [12]. Figure 2a shows an instance of the CpMP where the set of items is in yellow squares (qi=1,∀i∈I) and the set of medians appear in brown squares (maximum demand as shown in the label inside the square), Q=8,7,9,11,10 from top left to bottom right corner. In Figure 2b, we have the optimal solution of the model considering the situation proposed, [11].
Figure 2.
CpMP instance and solution. (a) Capacitated p-median instance. (b) CpMP optimal solution of the instance (left).
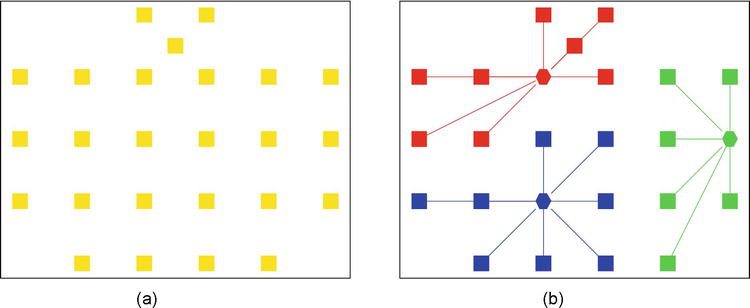
If it is desired to extract medians from all the items by using different capacities, the different values of capacities may be repeated for each item in the set of medians. In this case, it is necessary to include a new set of constraints to avoid the use of more than one median between copies of the same item. The same model may be repeated, with the addition of this new constraint. Figure 3a shows the situation (instance) where there are no vertices previously defined as medians, instead all of them could be a median with capacity in Q=8,7,9,11,10. Figure 3(b) shows the result of the model obtained for this instance, [11].
Figure 3.
gHCMP instance and solution. (a) A generalized heterogeneous capacitated median instance. (b) gHCMP optimal solution.
If one wants to consider a direct model that solves the situation of selecting the best median from the set of items, once all the items can absorb all the capacities, a new model may be formulated, which we call generalized heterogeneous capacitated median problem (gHCMP). In this model, the variable xjj∈01 may represent the item that will be selected as the median from the set I,j∈I, it will use the appropriate assigned capacity. The order of the median is represented by the variable gjk∈01, when it activates the capacity Qk of median j assigned to group k. Now, it is not known a priori what is the assigned capacity for an item that will be chosen as median, the model decides by itself, [11].
For the Generalized Heterogeneous Capacitated Median Problem (gHCMP), consider:
I: is the set of individuals.
J: is the set of possible medians (all individuals).
K: is the set of groups.
dij: is the distance from individual i to its median j.
The objective function (26) minimizes the distance between medians and each item assigned to its median. The constraint (27) defines that every item has to be assigned to exactly one median. The constraint (28) defines that once a median is used an item can be assigned to it. The constraint (29) joins items to medians sets and medians to groups sets. The constraints (30) and (31) warrant that each selected median assigns just one group. The constraint (32) considers the sum of items demand assigned to a median may generate a forward capacity. The constraint (33) indicates the forward capacity for each selected median may not overpass the limited capacity of its assigned group. The constraints (34)–(36) refer to the decision variables of the problem.
The capacitated centered clustering problem (CCCP) was proposed by [13], considering a constrained process of min-sum clustering for a set of demanding individuals on the Euclidean space. Once clustering can be performed in various ways, this problem searches for solutions where limits are present on the capacity of the clusters or even their size (maximum number of individuals per cluster). This problem is also NP-hard and introduces interesting research topics for exploring combinatorial optimization methods for solving it, [14].
Two problems were introduced by [13]: pCCCP and generalized CCCP (gCCCP). In the first type, the capacitated constrained min-sum clustering is bounded by several groups. Meanwhile, in the second generalized type, there is no limit on the number of groups; however, a fixed cost is added to the objective function to open a new cluster. To evaluate these problems, [13] prepared a set of test instances extracted from different sources (wholesale distribution, garbage collection, Euclidean TSP, and capacitated p-median problem).
The literature explores several applications, such as in dry food distribution logistics, designing zones for urban garbage collection, the territorial design of sales, tropical disease control (e.g., dengue, chikungunya, zika, and yellow fever), agro-food supply chain network, vehicle routing, bulk milk collection, routing subscribers of newspapers, integrating commercial and residential pickup and delivery networks, allocating emergency shelters to protect the local population during possible natural disasters, computational biology, facility location, offshore wind farm electrical cable layout, and IT teams placement on the floor of software factories, [11, 13, 14, 15, 16, 17, 18, 19, 20, 21, 22].
In many of these applications, the pCCCP was also adopted as a sub-problem to solve location-routing problems, capacitated clustering problems, districting, substation placement problems, and capacitated and periodic vehicle routing [20, 21, 22, 23, 24, 25, 26].
In the following sections, we consider four applications: factory floors IT-Teams layout in Section 2, logistic (wholesales, staff collection and dispatching) in Section 3, health (EMS and dengue prevention, control, and combat) in Section 4 and waste collection (domiciliar, selective, street sweeping, hill climbing) in Section 5. All these contexts CCP are applied with different forms for each application. It is discussed in detail the models proposed, it is considered the formulation and complexity of the appropriate CCP model used. For some of the approaches we discuss decision support systems (DSS) we developed and we also include forward steps as vehicle routing methodologies to complete the operational level. For the end, we include our experience with these models and DSS technology developed by us revealing the optimization results we achieved in applications such as: IT-Teams, staff collection/dispatching, and waste collection (domiciliary and human street-sweeping).
Following we consider an important organizational problem that is performed weekly in software factories, during the development of software projects by teams in a software factory. The relevance of the CCP in this context was confirmed in two major Brazilian software factories: DATAPREV and SERPRO by [11].
2.1 IT-teams layout in software factories
Just before and during the pandemic of COVID-19, the software factories were managing their production by home office. This intent changed the behavior of development teams and the interactions between their members. The living costs highly dropped for factories but increased to their members (energy, food, etc.) although the quality of life improved for most of them. But it confirmed that some management problems may arise when dealing with dispersed teams: ensuring control in completing critical tasks; supporting a feature that needs to be updated regularly; always have some member of the team when a failure is detected or a new task need to be implemented and others. Actual availability of very high-speed internet and impressive software tools for communication by voice, video (alive and recording) and data transfer interchange, between groups, the concept of agile development used in software factories in Brazil changed most recently as labor regulations to deal with home office.
Home office and in-person office labor mixed structure is now evident in major software factories, maintaining the obligation of regular meetings of teams in the factory floor.
Schedules that alter the contingent of projects, or the opening and closing of projects, can motivate companies to move members between workstations, or even teams between rooms or floors of the factory. When this movement is done without criteria, it consequently disorganizes teams, separating members in dispersed places configuring undesirable circumstances such as those already mentioned. The definition of the layout of the teams can be complex in companies that have a high project turnover rate and a large number of employees.
It is explained here a real problem Information Technology-Teams (IT-Teams) project placement, from Brazilian federal company Dataprev. This IT company operates as a software factory and relies on standardized development teams skilled in different contexts.
Each project team has a number of people previously defined by managers in accordance with the complexity or work effort estimated to the project. This number is usually different between teams due to the different complexities of projects.
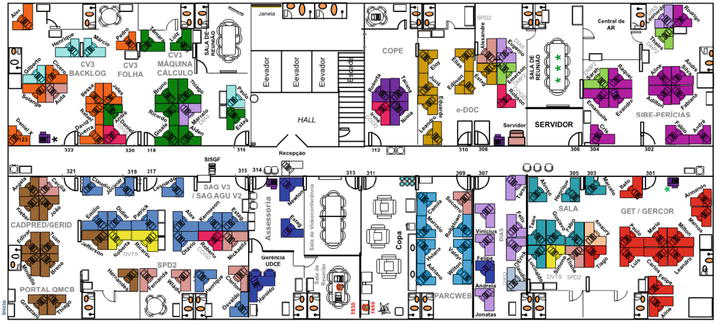
Dataprev’s project teams are located in a large hall of a building, where workstations are arranged in cells composed up to four stations. There were 121 workstations where teams are allotted, see Figure 4.
Figure 4.
Dataprev enterprise IT-Teams layout.
In this context, it is a common problem to structure the layout of the factory workstations in such a way that the distinct groups of the projects may maintain their own members close to each other. There are many ways of building groups with individuals of any kind and characteristic. Although humans are specialized in separating things to perform better decisions when partitions are to be the expected result, this decision process is not possible when the number of individuals is high. When the individual have a demand/offer and a limited capacity is involved while building the groups, the resulting decision problem is more difficult because of its combinatorial counterpart. Also, in this context, there are many ways of doing clusters of IT-Teams.
If one wants to consider a direct model that solves the situation of selecting the best median from the set of items, once all the items can absorb all the capacities, the appropriate model to be used is the generalized heterogeneous capacitated median problem (gHCMP), previously defined.
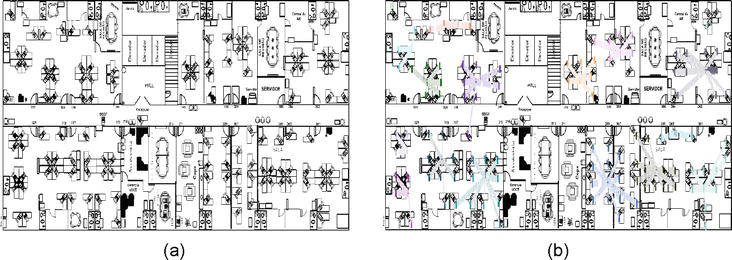
In Figure 5(a), it is presented an instance to layout workstations (points) in Dataprev factory floor at Fortaleza/CE, and in Figure 5(b), it is presented the solution of the model gHCMP, which can be used to solve the factory layout problem.
Figure 5.
Process to layout IT-Teams in Dataprev factory floor. (a) An instance to layout Dataprev IT-Teams. (b) Optimal solution to a Dataprev layout instance.
In fact, the process of layout is more dynamic than what is proposed. Projects end and new projects arise in software factories. The management of this available staff is another important problem that arises in the factory. For the layout, in fact it does not move, because the new instance will run only over the workstations available. In fact, this affect the general layout, and reconfigurations may be needed with minimum change between actual layout.
There are many problems in logistic that consider the use of decision support systems to support strategic, tactical, and operational level of planning. These systems appear most recently with great success in distribution. Most of them were designed by using classical routing algorithms, but the most succeeded went to the area of clustering, once they carry out more information than only distance to join customers. Aspects related to the customers’ attributes (size, type of business, importance, etc) are relevant for many distribution companies to prepare service plans oriented.
Following we discuss two problems related to human force: first in labor (sales force distribution) and the second for the worker (staff collection and dispatching).
3.1 Wholesales distribution
In wholesales distribution, actually practiced in Brazilian major cities, the retailer owns its sales-force that is disperse in major cities boroughs, commercial corridors, or downtown. There are several different types of goods to sell to many stores or groceries. Actually the salesmen are equipped with mobile systems that are used to obtain the requests and/or propose offers to special customers along their area.
The market can be efficiently covered by:
Aggregating customers by their similarity in product consumption, revenues, and distance proximity;
Aggregating by the number of customers per cluster.
The first aggregation process abovementioned is related to the attributes of each customer of the market. Then it can be defined a specialized salesman to cover a market accordingly to the product consumption.
The second is the constraint associated with the capacity to cover the market by a salesman. This division is to define a workload of a day for a salesman or for the sales-force.
It is common in certain markets that the sales-force can cover the market customers’ in a week. Or periodically for some customers. The periodic time associated with a customer depends on its relevance to the revenues or the type of product associated with its market share.
The sales-force can be limited to the number of salesman, and it may be required to be calculated the necessary salesmen to cover the areas considering the proposed workload capacity and attributes requirements.
Bard & Jarrah [19] conducted a research on network design focused in a division that considers commercial and residential customers separately, situation motivated by their respective geographic densities and the size and frequency of their demand. To construct driver work areas, the authors indicated that it is necessary to consider the expected demand, vehicle capacity, time on the road, and aspect ratio of individual territories. This triggers a capacitated clustering problem with side constraints. Based on a previously developed column generation algorithm, a case study was conducted involving several scenarios that integrated two networks, to determine the extent of the resulting benefits. The analysis indicated that a significant reduction in fleet size could be achieved when the two networks were either partially or fully combined. It also demonstrated that small reductions with respect to practice were possible when they were separately maintained, with the added benefit that the geometry of the resultant clusters satisfies certain desirable properties in terms of their contours and aspect ratios.
The appropriate model to solve this type of problem was proposed by Negreiros & Palhano [13] with CCCP. The general version is more appropriate when the sales-force needs to be known, and the single version is appropriate to the case when the sales-force dimension is known in advance.
3.1.1 A novel periodic capacitated clustering problem model
A new and more general model can be proposed to hold the periodic characteristics above mentioned. Let us suppose that the generalized periodic CCCP can be represented using the following set of parameters and variables:
l: dimension of the Euclidean space (l=2, in our case).
L: set of dimensions of the Euclidean space (∣L∣=l, in our case).
I: set of individuals.
J: set of clusters.
H: set of time horizon, H=h1h2…hT.
ai: vector of l dimension with the coordinates of the individual i.
T: period of time horizon.
fi: frequency of an individual i in T.
tbvi: minimum time between visits of an individual i during time horizon.
Qjh: maximum capacity of a cluster j in time horizon h.
qih: demand of an individual i in time horizon h.
njh: number of individuals in the cluster j in time horizon h.
x¯jh: vector of dimension l representing the coordinates of the cluster center j in time horizon h.
We consider the generalized periodic capacitated centerd clustering problem g PCCCP as follows:
gPCCCPMinimize∑i∈I∑j∈J∑h∈H‖ai−x¯jh‖yijh,E37
such that:∑j∈Jyijh=1,i∈I,h∈H,E38
∑i∈Iyijh=njh,j∈J,h∈H,E39
∑i∈Iaiyijh=njhx¯jh,j∈J,h∈H,E40
∑i∈Iqihyijh≤Qjh,j∈J,h∈H,E41
∑j∈J∑h∈Hyijh=fi,i∈I,E42
∑j∈J∑h∈Hhyijh≥fi−1tbvi,i∈I,E43
x¯jh∈Rl,njh∈N,yijh∈01,∀i∈I,∀j∈J,∀h∈H.E44
The objective function (37) minimizes the Euclidean distance among individuals assigned to the same cluster in horizon h. It is also possible to use min-sum-of-square measure (minimize the total variance of the clusters). Constraint (38) assigns each individual to exactly one cluster in time horizon h. Constraint (39) assigns the number of individuals per cluster (njh) in time horizon h. Constraint (40) defines the centers of each cluster (xjn) in time horizon h. For each cluster center j in time horizon h, constraint (41) limits the sum of the demands of its assigned individuals. Constraint (42) refers to state the necessary frequency of the individuals during time horizon T. Constraint (43) guarantees the interval between visits on the intervals for the same customer. Constraint (44) refers to the domain of the decision variables.
The gPCCCP is nonlinear with linear constraints (38), (39) and, (41) and nonlinear constraint (40). Its difficulty (NP-Hardness) can be found in the the center location constraints (39) and (40), knapsack constraint in (41), the periodic component in (42) and (43), and the partitioning process encapsulated in the problem.
The continuous relaxation for gPCCCP, whose objective function is neither convex nor differentiable, can be modified to be differentiable and convex.
For the nonlinear constraint (40), we can linearize them using more 0–1 variables, as follows.
∑i∈Iyijh=njh,j∈J,h∈H,
and
∑i∈Iaiyijh=njhx¯jh,j∈J,h∈H.
implying
∑i∈Iaiyijh=∑i∈Iyijhx¯jh,j∈J,h∈H.
or
∑i∈Iaiyijh=∑i∈Iyijhx¯jh,j∈J,h∈H.
x¯jh=x¯j,1hx¯j,2h…x¯j,lhΤ.
Wehavetocomputeyijhx¯j,rh,r∈L.
Wereplace:
yijhx¯jrhbyzijrh,r∈L.
It is very easy to obtain lower bound LB=−M and upper bound UB=M>0 for each x¯jrh.
Therefore, we can rewrite problem gPCCCP as follows.
gPCCCP′Minimize∑i∈I∑j∈J∑h∈Hwijh,E45
Suchthat,
wijh2≥∑r=1lmijrh2,wijh≥0,i∈I,j∈J,h∈H,E46
−M1−yijh+air−x¯jrh≤mijrh,r∈L,i∈I,j∈J,h∈H,E47
mijrh≤air−x¯jrh+M1−yijh,r∈L,i∈I,j∈J,h∈H,E48
∑j∈Jyijh=1,i∈I,h∈H,E49
∑i∈Iairyijh=∑i∈Izijrh,r∈L,j∈J,h∈H,E50
−Myijh≤zijrh≤Myijh,r∈L,i∈I,j∈J,h∈H,E51
−M1−yijh+x¯jrh≤zijrh,r∈L,i∈I,j∈J,h∈H.E52
zijrh≤x¯jrh+M1−yijh,r∈L,i∈I,j∈J,h∈H,E53
∑i∈Iqihyijh≤Qjh,j∈J,h∈H,E54
∑j∈J∑h∈Hyijh=fi,i∈I,E55
∑j∈J∑h∈Hhyijh=fi−1tbvi,i∈I,E56
x¯jrh=x¯j1hx¯j2h…x¯jlhΤ∈Rl,j∈J,h∈H,E57
yijh∈01,zijrh∈R,ijrh∈R,i∈I,j∈J,h∈H,E58
air=ai1ai2…ailΤ.E59
Constraint (46) is second-order cone, which forms a convex set.
3.1.2 A spatial DSS to gPCCCP
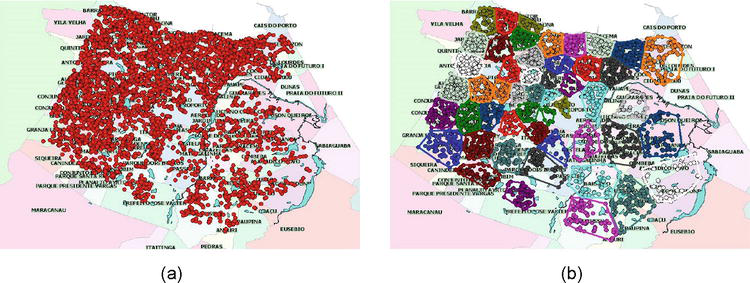
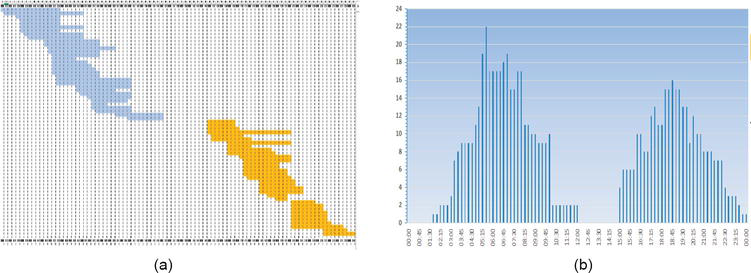
Graphvs™ developed a new software tool that can hold a preliminary version of this problem. In the DSS, SisRot FULL®, the problem solved considers the partition of the customers for salesmen in two steps: first division of the coverage considering the workload for the total time horizon, and second division of the coverage assigned to each salesman along the time horizon. In this approach, the frequency to visit a customer is unitary. The steps of the solution can be followed in Figures 6–8, where in Figure 6a, it is seen all the customers to be visited in an area, in Figure 6a, it is seen the customers assignment to salesmen. In Figure 6b, it is seen the division of the area to be covered along 5 days of a week for two salesmen. In Figure 8a, it is seen the thematic routes (sequence of visiting customers) for each day of the week for salesman 1 and in Figure 8b for salesman 2.
Figure 6.
Process t layout IT-teams in Dataprev factory floor. Step 1 to build a clustering solution to sales force.(a) Customers distributor position spreading in the city of Fortaleza/CE. (b) Covering areas of 50 salesmen.
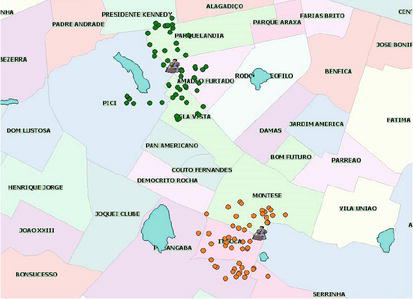
Figure 7.
The customers per week of two salesmen.
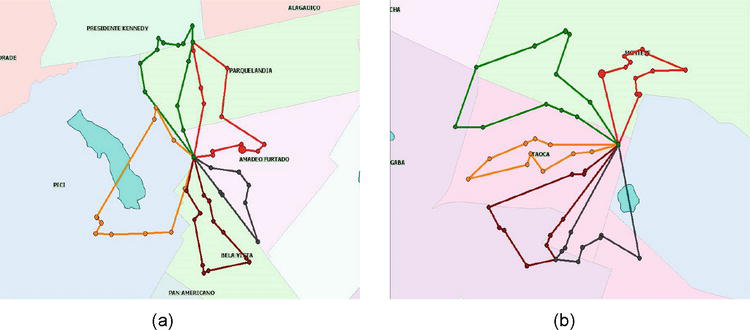
Figure 8.
Step 2 building the routes per week of two salesmen. (a) Week covering routes of salesman 1. (b)Week covering routes of salesman 2.
3.1.3 Structuring solutions in a spatial DSS
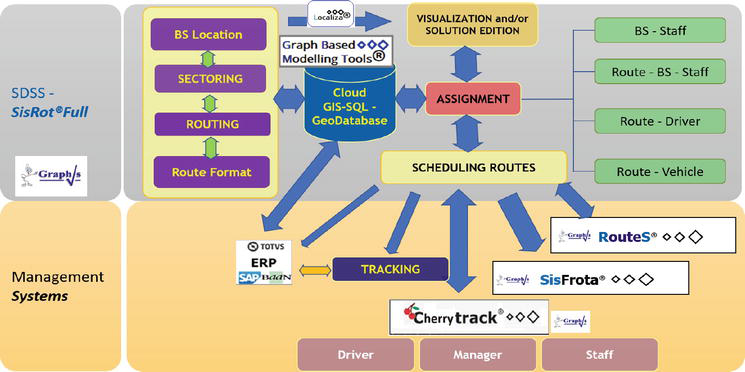
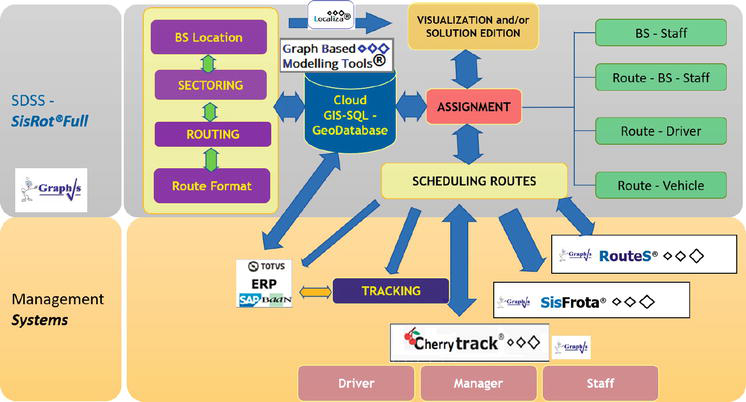
A tool to manage all the information and decisions into a spatial decision support system is described by its architecture in the Figure 9. To better trace the solution and assign to the decision process the solution to the sales-force in the next step. With the solution, the assigned dispatch went to the selling system that deploys the routes of customers’ visits to the salesmen.
Figure 9.
SDSS for Wholesales planning distribution of salesmen force.
In the SDSS exposed in Figure 9, it is presented the contents of a framework of software that work in conjunction to deal with the problem of planning and organizing the salesmen force of a distribution company. The system is implemented in a cloud unity (VPS) where its components can share information of its competence. The major system is composed of two parts, the first is the spatial decision support system (SDSS) SisRot Full®, and the second is a set of tools to manage information from sales, sales force, and vehicles’ tracking and salesmen monitoring.
In the SDSS of the SisRot Full®, it has embedded a GIS and an SQL-Geodatabase enclosed (ESRI™) that include all the necessary geographical information about the place to plan, and the data from sales force and its constraints. The street network can be also manipulated by the graph base modeling tools (GBMS) available that can revise street status, forbidden turns and directions. As an analytical part of the SDSS, it is presented sectoring and routing tools that contains a set of state-of-the-art algorithms from routing and sectoring. These algorithms perform the preliminary solutions that can be edited using productions available to move customers between routes, reassign routes to new depots, create or delete routes, and many other. The final solution can be sent to be viewed in different map tools such as Google Maps™ and Here Maps™ by using the software Routes®, to better evaluate the routes with traffic conditions during their run. The final routes solution can be also assigned to the salesmen (or driver) and can be scheduled accordingly the days of covering the salesman’s set of customers.
External software for managing the maintenance of vehicles can be included such as SisFrota®, and managing sales force such as ERPs from Baan, Totvs, SAP, and many other. Graphvs™ most recently introduced a new tool to follow salesman while in the field, it is called CherryTrack®. In this tool it is possible to follow any salesman simultaneously and its results while they are selling using the manager tool, and it can give to the salesman his route while he/she is walking/driving through the customers assigned to the day of the work, including all the information about his results per customer. The mobile CherryTrack Manager and Driver tools are developed to Android and make great difference in performing and controlling the sales force in the field.
The solution abovementioned does not include a more general frequency and heterogeneous capacity (workload) between salesmen. Although we propose a more general model, our proposition open new research opportunities for this application that can be also fitted to Hospitaller Waste Collection, Inventory Routing, and many other.
3.2 Staff collection and dispatching
In the staff collection and dispatching problem, a company is contracted to pickup and deliver the staff of the firm accordingly their turns using a fleet of special busses, and considering that each trip does not exceed a maximum of time spend on traveling (2 h) and the hour to arrive and leave from the workplace. There is a series of different problems to solve, but location-routing and scheduling are the most common used path to solve the problem.
In fact, the preliminary problem to solve is to locate bus-stops close to the staff’s homes (at least 800 m far, by Brazilian law) and second to perform routes that pass through the stops considering the capacity of the busses available, maximum time, and other possible existing constraints. In fact the location-routing can be developed in just one run. This problem was studied preliminarly by Madsen [27], Laporte et al. [28], Laporte [29, 30], and Borges et al. [31]. It is being studied from the literature mostly for school bus routing and scheduling, when there is a necessity to pickup and delivery students in located bus-stops, [32, 33].
The use of original distance constrained and capacitated p Median Problem DCpMP for the staff collecting and dispatching problem is a new form to understand this problem, it can be defined in two stages for aggregating staffs to bus-stops close to their homes and aggregate bus-stops to vehicles accordingly the staffs’ turns. The CpMP problem was first proposed by Mulvey & Beck [12], here it is modified to be DCpMP to define the placement of the bus-stops as follows:
I: be the set of individuals/items (∣I∣=n).
J: be the set of bus stops - medians (∣J∣=m).
∣J∣: is the fixed number of clusters.
p: can also be the number of clusters/medians.
dij: is the distance from individual i to its median j.
Dmax: is the maximum distance from staff’s home and its median.
The objective function (60) minimizes the distance between medians/bus-stops and staff assigned to each median. The constraint (61) defines that every staff is to be assigned to exactly one median. The constraint (62) complements constraint (61) to indicate each staff may be assigned to some other bus-stop. The constraint (63) considers the number of staff may not overpass the limited capacity of the bus-stop they are assigned to. The constraint (64) considers the staff i can only be assigned to bus-stop j if its distance is less than the maximum distance. The constraint (65) limits the number of bus-stops used from the set of bus-stops. The constraints (66) and (67) refer to the decision variables of the problem.
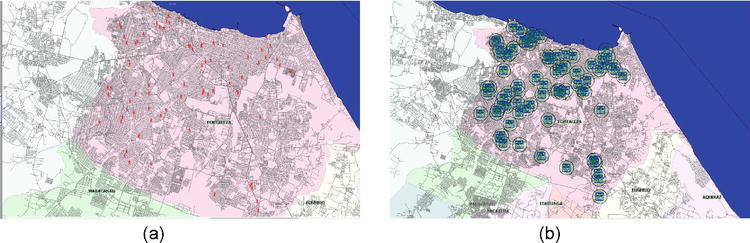
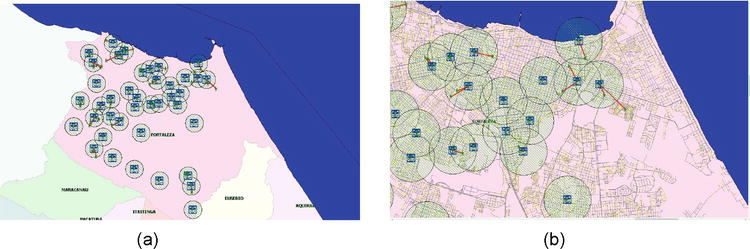
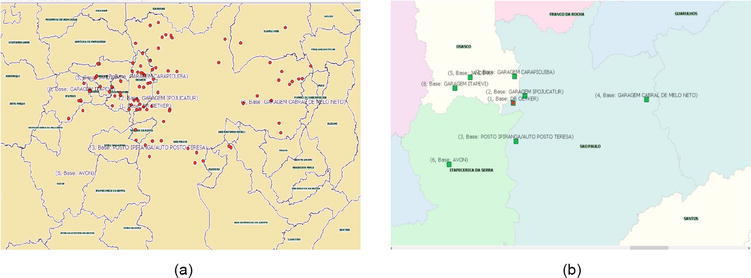
Figure 10a and b present the first step of the problem in the city of Fortaleza/CE, in two situations: The geographical spread of the 79 employees of a local distributor for a given turn and the candidate bus-stops. The solution is the selected bus-stops as can be seen in Figure 11a. In more detail, we have the assignment of the employees to their closest stops in Figure 11b. It is also noted that the final solution can violate or not the constraints of the problem, here it is seen that some employees are out from the 800 m distance. In this case it is to the expert the preference to move to the next bus-stop, or to indicate the worker has to take another way to go/back to work.
Figure 10.
Homes distribution of the staff and candidate bus-stops. (a) Staff position for Staff Collection & Dispatching Problem. (b) Candidate bus-stops for Staff Collection & Dispatching Problem.
Figure 11.
First phase of the staff collection and dispatching problem. (a) Bus-stops selection and assignment to each staff’s home. (b) Detailed assignment of staff to bus stops.
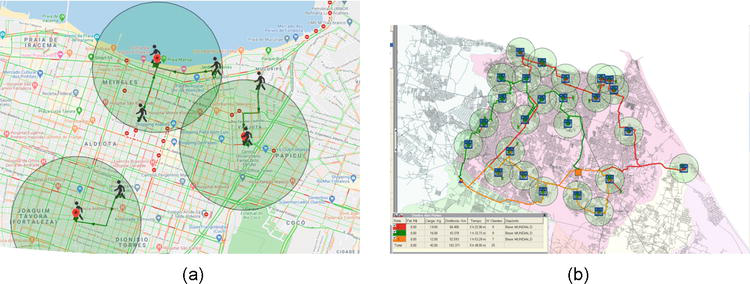
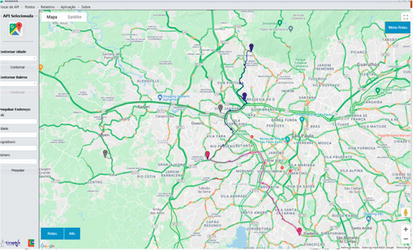
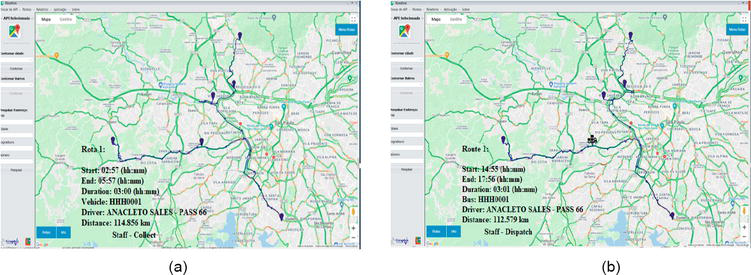
The second problem is to produce aggregated stops to perform the final bus routes. As can be seen, Figure 12a presents the routes of the busses between stops and in more detail the employees moving to their stops in Figure 12b.
Figure 12.
Second and third phase of the staff collection and dispatching problem. (a) Aggregation of bus-stops for the Staff Collection & Dispatching Problem. (b) Final routes to the Staff Collection & Dispatching Problem.
Defining HCCCP as the basic model in this step, it is possible to build high-quality routes. A post-optimization procedure can be performed to achieve time constraints, which are not considered in the clustering steps. Applying an appropriate metaheuristic such as GRASP+PR [34], ILS-VNS/VND [33], and TS-PR [35] the procedure can converge to close to optimal solutions even for very large-scale instances with homogeneous/heterogeneous fleet running with up to 10,000 employees and up to 500 vehicles. These solutions can be obtained in few minutes (Figure 12).
3.3 Spatial DSS to staff collection and dispatching
Graphvs™ developed a spatial DSS solution using its SisRot Full® latest version to help staff collection and dispatching location-routing and scheduling. In Figure 14 we have the description of the architecture of this DSS framework.
The system is also implemented in a cloud unity (VPS) where its components can share information for decision analysis. The major system is composed in two parts, the first is the spatial decision support system (SDSS) SisRot Full where exists a Graph-Based Modeling System (GBMS) that operates with many tools over the street network, and the second is a set of tools to manage information from staff (their address, place of work, shift, etc.), garages and places of work, available fleet and vehicles’ tracking, and staff transportation monitoring.
In (Figure 13), the SDSS of the SisRot Full® has the same previous characteristics available for the wholesales distribution and includes the tools and algorithms necessary to support decision to locate candidate closest bus-stops to staff address, to select the ones of minimum cost of location and edit solutions, to perform routes to collect or dispatch staff. These algorithms perform the preliminary solutions that can be edited using productions available to move customers between bus-stops, routes, reassign routes to new garages or final stops, create or delete routes, and many other. The final solution can be sent to be viewed in different map tools such as Google Maps™ and Here Maps™ by using the software Routes®, to better evaluate the paths to bus-stops selected and routes accordingly to the hour to go from/to bus-stop/work. The final routes solution can be also assigned to the driver and can be scheduled accordingly the shift of the days of covering the staff.
Figure 13.
Spatial decision support system for staff collection and dispatching logistic planning.
External software for managing the maintenance of vehicles can be included such as SisFrota®, and managing staff such as ERPs from Baan, Totvs, SAP, and many other. Graphvs™ most recently introduced a new tool to follow staff while in the field, it is called CherryTrack®. In this tool it is possible to follow any staff while going/back to/from work, and it can give all the information about his/her way to/back work/home as position of the bus and approximate time to be at his bus-stop or to leave.
The use of spatial DSS for health system is still not evident in the health management environment. DSS is in general tool for planning, but at least in Brazil, this concept is avoided managers think like: “the problems are running and have to be solved just with the available resources in the meanwhile.”
After understanding the particularities of the tactical and operational aspects of the organization of each macro problem, it is possible to evaluate adequate techniques to better approach the optimized organization. It is in fact difficult to achieve, but never surrender.
Following we discuss two important problems of main concern worldwide: Arbovirusis prevention, control, and combat using dengue as example; and emergency medical systems, as they are run in Brazil, and as we here propose new developments to them.
4.1 Dengue disease control and combat
Dengue is still a very dangerous tropical disease provoked by arbovirus on infected mosquitoes Aedes aegypti. It hurts millions of people around the world annually. The mosquito is now responsible to carry out virus not only for dengue, but chikungunya, yellow-fever, and zica, other dangerous diseases that hurt and kill in the same tropical areas many human beings. The capture and extermination of the mosquito are the major effort necessary by health municipality secretaries to avoid these diseases in Brazilian urban areas.
Negreiros et al. [16] explain a number of clustering applications to hold the preparation of different kind of problems to define the logistic of dengue disease control and combat in tropical areas. The most important work in this process is made by sanitary agents, actually called endemic agents.
The problem to manage endemic agents for covering restricted areas to control focal and strategic points can be solved by the same generalized capacitated clustering model, even for blocks or unitary real states that are spread in daily urban areas of control.
From the gCCCP problem, it can be only inserted the canalized constraints (68) to define areas of coverage limited to the agents minimum and maximum capacity to visit real states in an epidemiological circle.
Qmin≤∑i∈Iqiyij≤Qmax,j∈J.E68
4.2 A DSS to this problem (Webdengue: manager)
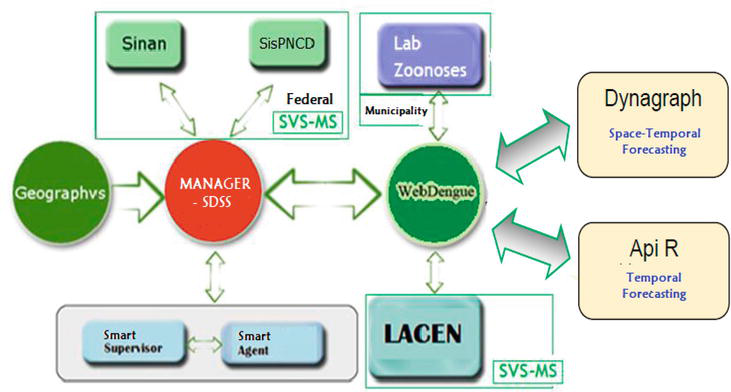
A framework of computational systems Webdengue was designed to treat the problem of endemic agents coverage in its many forms and populate with solutions to better assign and optimize resources. The framework counts with a manager system that is incorporated with the capacitated clustering DSS tool (calculate and edit solutions) and the assignment tool to send to agents’ and supervisors’ mobile systems the routes between real states to cover. In Figure 14 it can be seen the new structure of the framework, since its modification performed in 2021.
Figure 14.
New Webdengue computational framework.
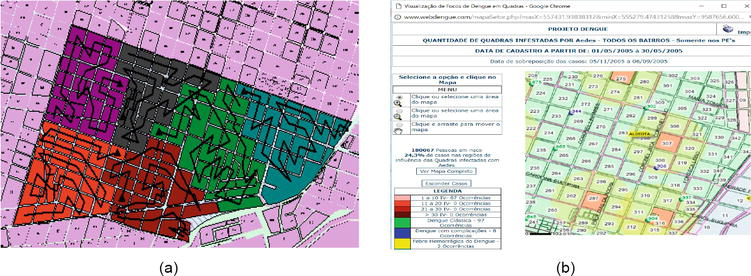
The framework contains a system to process the information from the field that comes from the mobile units and also that could be generated locally by the manager about the status of visits and people affected by the arbovirusis, Figure 15a. Tools to evaluate the territorial spread of the mosquito and the linkages with the human cases were developed to permit planning to better prevent the outcome of the disease, Figure 15b.
Figure 15.
Planning with Manager and visualizing focus and cases in city blocks with Webdengue. (a) Sectoring and routing epidemiological agents between city blocks. (b) Focus X Human cases information cross.
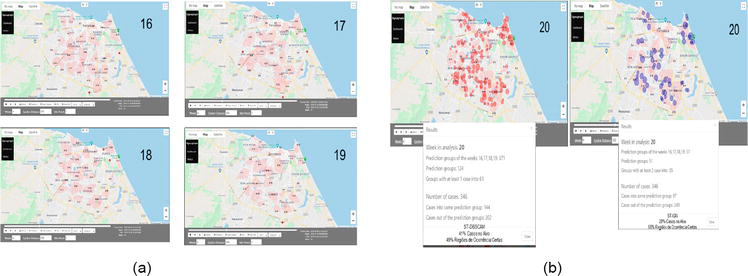
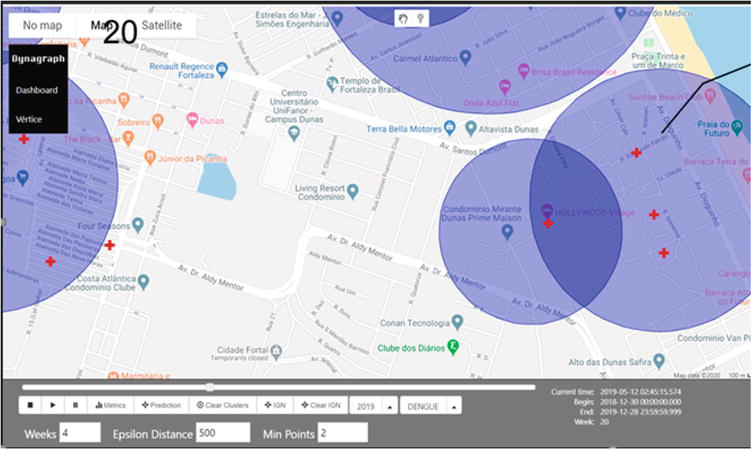
Most recently, Negreiros et al. [36] reported that it was included space-temporal clustering tools to track the disease in the affected territories by using a new dynamic-graph tool called Dynagraph, Figure 16a. Dynagraph is a space-temporal graph editor developed by Calixto [37] and later improved by [38], which works as a data warehouse to be adjusted to as many space-temporal applications as possible such as epidemiological outbreaks of diseases, grid network expansion, aircraft transportation network expansion, crime expansion, and so forth.
Figure 16.
Using Dynagraph for space-temporal human cases prediction. (a) Evolution of cases between sequential epidemiological weeks. (b) Forecasting cases using st-clustering techniques.
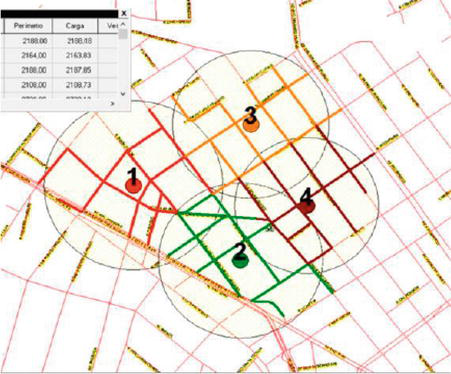
With this tool it is possible to see the changes between epidemiological weeks of the territorial occurrences of the Aedes and human cases, and apply clustering methods to forecast in the territory where will be in the next epidemiological week the places with cases of dengue, i.e., Figure 16a and b. In Figure 17 we can see target circles where in this territory it is predictable to have human cases of dengue in epidemiological week 20.
Figure 17.
Predictable areas of dengue occurrence.
4.3 Urgent ambulance system
SAMU (Serviço de Atendimento Móvel de Urgência, or Emergency Mobile Care Service, the same as EMS – Emergency Medical System) is a gratuity pre-hospitaller system operated by the municipality 24/7 that is available in major Brazilian cities and metropolitan areas, [39, 40, 41]. The logistic system is composed of four structures: calling reception, urgency identification and dispatching, urgent mobile care, and emergency hospital and clinics.
The calling reception and dispatching system (Central of Regulation) is composed by specialized people and doctors that receives urgent calls, filter and dispatch the real urgent cases to be serviced by a specialized unit and assigns the case to an available and appropriate health unity. The urgent mobile care system is composed of a huge structure of specialized ambulances that are equipped with appropriate care materials, instruments, and human resources (doctors, nursers, paramedics, etc.) to deal with the specific levels of urgent treatment needed to maintain the survival ability of the patients. Once the patient injury is confirmed in the field by the local health agents in operation, the calling operating system may renegotiate the better place for the service. The ambulance goes directly to the assigned health unity, and after safety delivery of the patient it is free to attend a new call.
The emergency service is regulated by international standards defined by World Health Organization (WHO). The response time, i.e., the elapsed time between notification of an occurrence and the ambulance arrival at the scene, is about 8 min, Pons & Markovchick [42]. This is the main performance measurement (challenge) of the SAMU system. The Brazilian studies reveal that in medium cities such as Niterói/RJ, Ribeirão Preto/SP, Ouro Preto, and Mariana/MG, and capitals such as Belo Horizonte/MG and Rio de Janeiro/RJ, the response time is far to be achieved in capitals, but it is close to normal in the medium cities evaluated, [40, 43, 44, 45].
The logistic problem here is to define the appropriate fleet and health team to attend people in the diversity of the circumstances that exist in the emergency health context. From other worldwide similar systems and by experience, the players (municipality) already know the different types of infrastructure needed to attend people. In Brazil, there are three types of mobile infrastructures: Basic Support Units (BSU), Intermediate Support Units (ISU), and Advanced Support Units (ASU). These units are composed accordingly the complexity of the emergency it is able to attend, and it is assigned preferable to the one it is prepared for attending.
The problem resides in three major questions to answer:
How many units of each type is necessary?
Where (or how) is the (shape) region or locations they have to be based during their daily service time?
What hospital do they have to be assigned to achieve the international standards?
Once the system works with great uncertainty on where the occurrences will be in the space-time, the logistic problem is solved by adjusting a M/M/m Queueing Hypercube model that considers atomic regions and their probability of emergency occurrence for each type of service, based on historical data, [40, 41, 46, 47]. By using this model with the real dataset, the service units are placed along the atomic regions, and the simulation is performed to first evaluate the equilibrium of the service in a day of work, once the service times are satisfied, it is then observed the effect of removing units from different regions, [41].
For major cities it may be relevant to consider several bases in the infrastructure. These are places where the teams meet and the regulation center is installed, as the inventory of health care material and the ambulances. In less concentrated cities, the bases can be placed in hospitals when they are located in well-separated regions of the city. But there are cities, as shown by Nogueira Jr. et al. [48], that evaluated optimization models in conjunction with simulation, where they verified that their deterministic approach could minimize the time of service by reconfiguring the fleet, reducing active bases and ambulance relocation. This research brought the essence of the new model we are proposing here.
As it can be seen, the models proposed until now do not take care of reconfiguring the coverage areas as the cities grows or as the number of valid calls come. There is no capability of reaction, and no possibility of dynamic infrastructure revision while the service is on the way. The congestion of the system that works on the normal conditions has been evaluated, but the breakthrough of the actual infrastructure is not considered. Dynamic location optimization models may be introduced for this context. These models may concern to the stability of the system even if sporadic congestion occur in the system.
In the CCP context, there are two possible problem approaches to be used: Dynamic Generalized Multi-Capacitated Clustering Problem (DgMCCP) and a Dynamic Generalized Multi-Capacitated Centerd Clustering Problem (DgMCCCP). In the first model the bases are important to be selected for the logistic context, in the second model there is no base in fact needed to be selected, they are the hospitals that operate in the region defined by the cluster at the end. Below we consider the DgMCCP.
Consider that a base can be either a hospital or a place without hospitaller infrastructure but an infrastructure to keep medicine and other medical inventory and garage to maintain the ambulances. Consider each candidate to be a base (median) has a certain capacity for each type of service. Finally consider that a client must have only one type of service. The following notation for the generalized Multi-Capacitated Clustering Problem (gMCPP) can be placed:
I: The set of patients,
J: The set of candidate bases (medians),
K: The set of types of services.
H: The set of hospitals (with emergency units).
n: Cardinality of the set I, i. e., number of patients.
m: Cardinality of the set J, i. e., number of bases (medians).
CIj: cost to install a base j as center.
CAk: cost to allocate an ambulance of type k.
CTPk: transportation cost of an ambulance of type k.
tijhk: Total time to attend the patient i from the (candidate) base j with service k to hospital h.
qik: Demand of patient i with service k (Unitary).
Qjk: The capacity of the (candidate) base j for the type of service k.
QAjk: The maximum number of ambulances based on j of service k.
The gMCCP considers as objective (69) the minimization of the fixed cost to use the structure of a base j and ambulances of types k, and the variable cost to attend all patients to be serviced. In constraint (70) it is warranted the assignment of a base j and than to the hospital h if there is at least one service to it. In constraint (71) it is guaranteed that the service of a patient is assigned to at least a base hospital. In constraint (72) the capacity of a base for any type of service stays at its limits. Constraint (73) reinforces the existence of a base if there is a service to it. In constraint (74) it is guaranteed availability of the number of ambulances to attend the patients. Constraint (75) guarantees the number of ambulances per type is limited. Constraint (76) defines the decision variables.
The dynamic nature of a clustering problem can be modeled as a linear function of time as in the dynamic location problem, [49]. The uncertainty parameters of the model are most often described through scenarios. A scenario is a possible realization of uncertain parameter values, [50, 51, 52]. In our approach, we consider the set of fixed facilities along the planning horizon, with the adaptability to the service (growth or decline) accordingly to the conditions of each scenario. In this approach, the concept of regret function is used, which searches to minimize the impact of bad choices of a set of facilities among the different scenarios of the planning horizon.
Consider that a scenario is composed by the patients of a single shift or workday. A set of scenarios S is composed by a number of shifts or workdays that can be extracted from the data set of services realized during the period of analysis. Consider as a regret function to locate the bases, the function that minimizes the maximum difference of cost to cover all customers per scenario using the best configuration and actual scenario configuration. The new model can be placed as:
S: The set of scenarios.
r: is the final cost of the optimal regret.
z⋆xyNA: is the cost of the optimal solution between scenarios.
zsxsysNAs: is the cost of the solution of scenario s.
The gMCCP considers as objective (77) the minimization of the regret function. Constraint (78) reports the maximum regret. Constraint (80) guarantees the coverage of the optimal solution in the optimal solution of the scenarios. The constraint (81) guarantees the bases (medians) used in the optimal solution can also be used in the optimal solution of the scenario. Constraints (81) and (82) are the decision variables dominion.
This dynamic model (DgMCCP) can be considered as a better and stimulating challenge for the SAMU problem, once it considers the real data as inputs. The simulation step can also be used to evaluate the precision of the model and its response. The model in itself is in NP-Hard complexity, as the versions proposed by [48, 53]. Important to notice that the bases are not known in advance (although there are given candidates), and it is an output of the model between scenarios, as the number of ambulances per type.
Waste collection actually is considered as an activity that develops and operates different logistic systems to give to solid waste management (SWM) that optimized plans that guarantee the best performance and minimal costs involved. SWM is composed by services such as: domiciliar and selective waste collection, container collection, rubble collection, health residues collection, human and mechanical street sweeping, and many others.
We discuss four problems related to waste collection: domiciliar, selective, street sweeping and collection with hill climbing. In these problems, most of them are traditional, and relevant literature considers them. The eye on arc sectoring routing is the most advanced because it changes the way the waste collection is performed in Brazil and worldwide. We used CCP models to obtain solutions to the first step of these problems, the sectoring, but we also show the final step by using our arc routing algorithms.
5.1 Domiciliary
The domiciliary refuse collection is a regular activity worldwide, spending billions of dollars monthly in a reverse logistic system where the garbage is collected on streets of residential and/or mixed with commercial areas and discharged at disposal sites like transfer stations and/or landfills using special type of vehicles (i.e., compactors, load packers).
In Brazil, most collection is held by contractors or concessionaires that do their service to municipalities. They divide cities into zones of collections that are covered regularly in specified periods like (diary, alternately or accordingly to the demand). The zones are divided into sectors, areas that are dimension-ed to be covered by vehicles within local workload per day. Each sector of a zone is also covered in several trips, once the vehicle is fulfilled it goes to discharge and comes back to a new loading trip. This circle repeats until all garbage is collected in the sector.
To guarantee that the fleet of vehicles covers all the sectors in the defined workload per day, it is necessary to generate good estimations of the garbage load behavior along a reasonable period. Once it is possible to have good forecasts for garbage generation for a long period, it can also be drawn regions in the sectors to traverse with one vehicle that will guarantee the coverage of the sector for all trips during the workload. This is called the Arc Sector-Routing problem (ASRP), a recent problem proposed by the Mourão et al. [54], which is being studied by a number of researchers, [55, 56, 57, 58, 59, 60].
Most recently, Negreiros et al. [56] proposed three methodologies based on heterogeneous capacitated centerd clustering problem (HCCP) to produce automatic near-optimal solutions to the heterogeneous arc-sectoring routing problem (HASRP). The first method builds solutions by sectoring-clustering-routing (SCR) where sectoring is the process of defining the great areas to be covered in a workday using different types of vehicles (different capacities) and then internally the coverage of the trips is defined in capacitated clusters limited to the maximum load of the vehicle and then the routing phase calls the rural postman routes to perform the trip over the clusters formed; the second process indicated was sectoring-routing-clustering and routing (SRC&R) where it defines sectors and the routes following that giant routes are build into the sectors, after the route is divided into circuits by using an appropriate method, i.e., as the one proposed by [61]; and finally the sector-routing-clustering-routing (SRCR) where it performs the sectoring using the HCCCP and after it generates a giant rural postman tour that is divided into trips of known capacity by using [61] and rebuilt the rural postman tours for each final trip.
The Heterogeneous Capacitated Centerd Clustering Problem with Fixed Cost (HCCCP-FC) here used for the sectoring/clustering phase can be defined as:
L=12: is the dimension of the Euclidean space.
I: is the set of arcs.
S: the set of sector centers. We consider ∣I∣>∣J∣.
V: the set of different vehicles to be used.
ai∈R∣L∣, i∈I.
qi: the garbage offer of an arc i∈I.
Qsv: the maximum garbage offer of a sector s∈S, using vehicle v.
cv:, v∈V is the cost of using a vehicle of capacity v.
VC: Variable cost.
x¯s∈R∣K∣, s∈S represents the center of sectors∈S.
ns an integer, is the number of arcs in sectors∈S.
yis=1,ifiisanarcinsectorj0,otherwise.
ws=1,ifsectorswithvehicletypevisused0,otherwise.
The HCCCP-FC can be formulated as follows:
HCCCP−FCMinimize∑s∈S∑v∈Vcvwvs+VC,E83
suchthat:∑v∈V∑i∈I∑s∈S‖ai−x¯s‖yisv=VC,E84
∑v∈V∑s∈Syisv=1,i∈I,E85
∑v∈Vwsv=1,s∈S,E86
∑i∈I∑s∈Syisv−wsv≥0,v∈V,E87
∑i∈I∑v∈Vyisv≤ns,s∈S,E88
∑i∈I∑v∈Vaiyisv≤nsx¯s,s∈S,E89
∑i∈Iqiyisv≤Qsvwsv,s∈S,v∈V,E90
x¯s∈R∣K∣,ns∈N∗,s∈S,E91
yijv∈01,wsv∈01,i∈I,s∈S,v∈V.E92
The same transformations that were performed on gPCCCP to transform it into gPCCCP’ can be performed on HCCCP-FC.
The objective function (83) minimizes the total fixed cost of the fleet used and the total Euclidean distance between sector centers and their assigned arcs. Constraint (84) refers to the total variable cost. The constraint (85) assigns one arc to just one sector. The constraint (86) considers the number of arcs per sector. The constraint (87) assigns one vehicle to just one sector. The constraint (88) considers once a vehicle is used to service an arc it is assigned to a sector. The constraint (89) defines the geometric center of the sector. The constraint (90) limits the assigned arcs to the maximum capacity of the sectors. The constraints (91) and (92) refer to the decision variables of the problem.
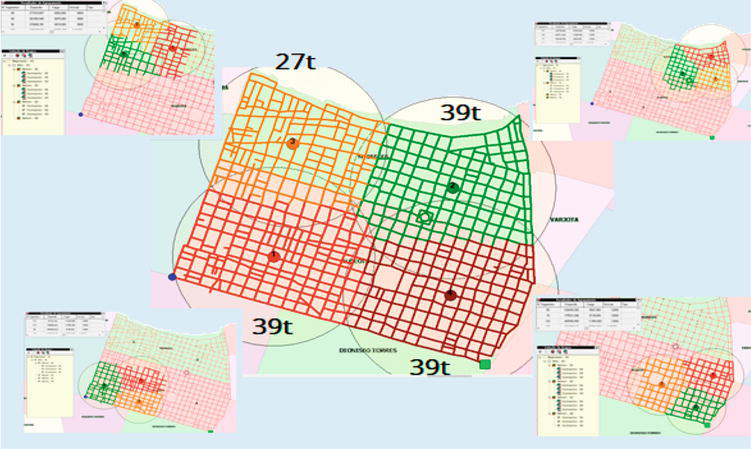
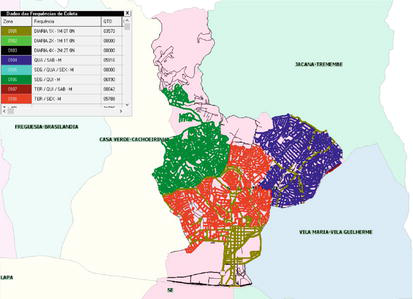
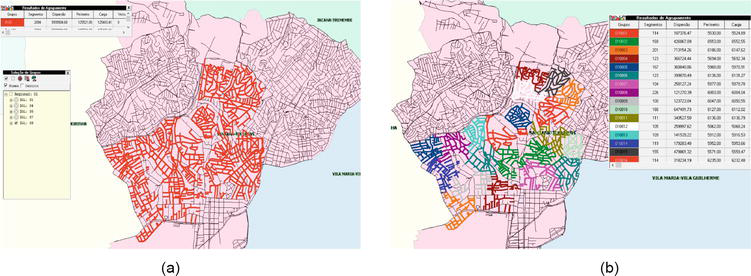
In Figure 18 we can see a sectoring procedure operating to divide a zone of domiciliary waste collection selecting from a set of (19 t, 15 t, and 10 t), the model returns two different vehicles (19 t and 10 t) forming three circuits for 3x39t and 1x27t sectors for the Aldeota and Meireles boroughs in Fortaleza/CE.
Figure 18.
Heterogeneous sectoring and circuiting for domiciliary waste collection in Aldeota and Meireles - Fortaleza/CE.
5.2 Selective
The selective garbage collection is an alternative service of waste collection that is being largely explored in Brazil. More than 5% of the garbage can be recycled to be re-manufactured or to the industry (paper, glass, plastic, aluminum, iron, hazardous materials – batteries, oil, etc.). The residential garbage is most organic as can be seen in the literature about the residential garbage gravimetry, [62, 63]. Actually the cities occupation of commercial and domiciliary unities is mostly fuzzy, opening spaces for different kind of selective waste collection.
There are many types of selective waste collection, but three of them are most used in Brazil and many other countries around the world: selective household collection using compactors, selective household collection using vehicles equipped with “jail” units, and selective collection by agents and big compactors with roll-on-roll of equipment to take big boxes of separated garbage (plastic, cardboard, glass, and metal).
In the selective household collection using compactors, the work is done in a specific day of the week where residents keep their selected dry garbage at door. A compactor with huge volumetric capacity is assigned to the region to collect all the material taking into consideration that the volumes can be stored in the compactor unit for one or two trips during a workload. A driver and two garis compose the team for each vehicle in general. The work is performed by concessionaires and/or municipalities, and it is directly sent to triage centers that are runner or organized by associations of garis, [64, 65, 66].
The selective household collection using vehicles equipped with “jail” does the same work, although it is not possible to compact the garbage. It takes two people to arrange the volumes into smaller ones in the vehicle of 28–31m3 (5 m X 2.9 m X 2 m). It is mostly performed by small associations and cooperatives recognized by the municipalities. It is worth to say that the Brazilian law 12,305/2010 turns the industry responsible for the garbage resulting from the discharge of its final consumer. There are specialized organizations that perform all the preparation of these associations from projects of industrial triage plants to business management, using the resources from industry to obtain the ecological certification (residue free, emission free) in carbon-free credits. The infractors have to pay heavy fines.
The selective household collection using agents is the more sustainable system that guarantees to the “cleaning agent” job placement and a special place in the society. This system is composed by two stages, the first is performed by the collection agent, which does the selective collection using manual vehicles or motorcycles equipped with small “jails” (0.5m3) to store the different type of selective garbage. They collect in small volumes and cover small to medium areas (10–20 blocks). They also do street-sweeping in the days they do not perform selective collection. The garbage goes to special boxes, which are collected by big vehicles equipped with compartments and roll-on-roll-off units that carry the garbage to triage centers. The result of this process pays for the salary of the agents and supports the concessionaires and/or associations, with double return to the municipality.
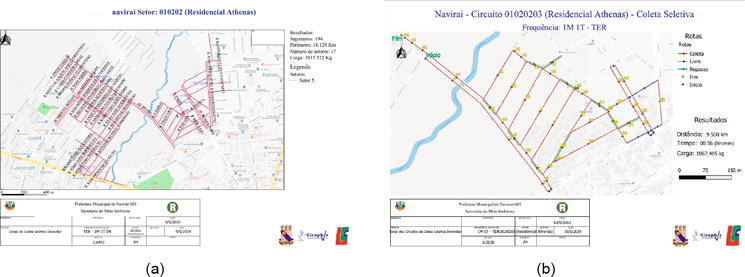
The models used to plan the service of the first two types of processes can be the same as the model proposed for domiciliary waste collection. In Figure 19a it is seen a sector of service projected for the city of Naviraí/MS (Brazil) and the route for a circuit of this sector, Figure 19b. This solution was performed by GRAPHVS for the Brazilian organization Recicleiros to selective waste collection using SisRot LIX®, [67, 68].
Figure 19.
Sectors and a circuit of the selective domiciliary waste collection for Navirai/MS. (a) A sector of the selective domiciliary waste collection for Navirai/MS. (b) A route in a circuit of the selective waste collection for Navirai/MS.
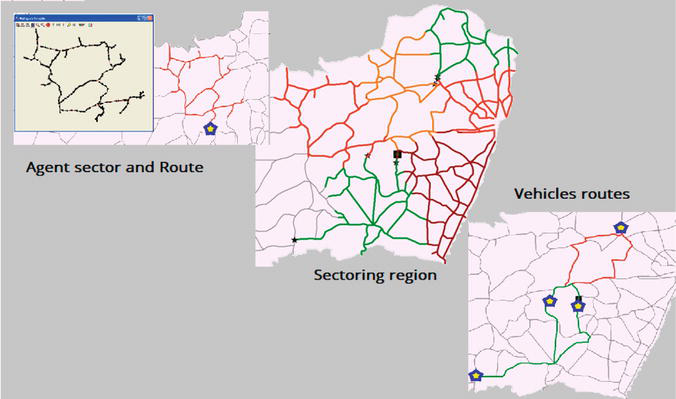
The model to plan service of the third process is composed by two phases of clustering, in the first it is drawn to the areas covered by the agents. It is the gCCCP with homogeneous capacity per agent. The second step is to define the routes of the big vehicles and define the location of the places where the sets of boxes will be in the street network on the intersection of clusters defined for the agents. Figure 20 shows the solution produced by another system SisRot LIX-SELECTIVE® considered for the third form of selective collection, using agents and bigger vehicles. Also, it can be seen the two steps of the logistic system (Figure 20).
Figure 20.
Logistic system for cleaning agent in fixed selective collection sectors.
5.3 Street sweeping
Public sweeping is a very difficult process to organize because its planning depends on the flow of people, vehicles, and afforestation in public places. To meet this demand, the city is divided into regions (or sub-municipalities) with defined sweeping frequencies and sectors for groups of sweepers. Circuits are places where each team of sweepers must perform the sweeping task. This service is inspected in sector groups. This service is costly; it demands over 40% of the total cost related to the non-scaled services of the São Paulo city, approximately 250 million USD/yr., [69].
Sweeping is performed in many manners: manual, mechanized, on sidewalks, in squares, in public installations, etc.; however, this study focus on manual and mechanical sweeping plans. In the manual sweeping of São Paulo/SP the major Brazilian city, two street sweepers work together on the same gutter side (1.2 m within the sidewalk line), using a “lutocar,” typical removal equipment, and appropriate clothing. Each team travels an average of 1.228 km/h sweeping and walking at a speed between 2.5 and 3.0 km/h. At this rate, a route of 3.8–5.6 km per working day (7 h 20 min) can be accomplished.
5.3.1 Manual sweeping
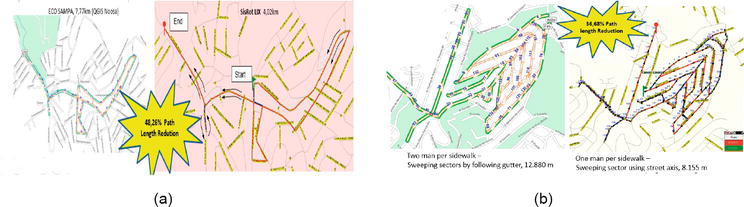
The manual sweeping in the city of São Paulo is paid by considering the street axis perimeter. This approach indicates that a route is taken by a team of two sweepers with a “lutocar” working together that do for the sector perimeter at the half-time distance of the team workload (7 h 20 min). The sweep begins from a designated starting point and goes to an end-point passing through a set of street segments, in the minimal walking path cost, Figure 21a. For the streets that must be swept in the first route passage, the sweepers perform the service in the gutters on one side of the road. Upon returning, they perform the service in the gutters on the other side, Figure 21b.
Figure 21.
Two different ways of human street sweeping. (a) Sweepers following the axis of the street. (b) Sweepers following gutter’s sidewalks.
Another way to perform the same work is by dividing the sweepers to sweep each gutters street side simultaneously, Figure 22a. For this case, there is only one open route passage, and the sweepers can perform the same service by walking much less but each one needs to operate with a “lutocar”. Figure 22b displays two examples where an open sweep route (right) by axis is 48.26% shorter than the path from the same sector coverage (left) and in the second the open route is 36.68% shorter than the path using both sides. This solution was proposed to the municipality of São Paulo to reduce labor fatigue and increase sweeping system coverage, [69].
Figure 22.
Comparison between sweeping ways of human street sweeping. (a) Sector 01. (b) Sector 02.
As seen in Figure 22, the route designed for the sweeper covers the same set of public places. Once it was determined to include a fixed starting point to allow the sweepers could find a unique place to keep the “lutocar,” we observed that the open RPP’s minimum route can be successfully used. The team of sweepers begins from a support point and concludes their task at a specific point, minimizing the overall cost of the sweepers journey, which will then return to the support point.
An alternative sweeping service sector formation was also considered, where each sector exhibited a capacity that was limited by a maximum sweeping perimeter that cannot exceed half the work shift of each team assigned to it. Thus, the problem becomes an open arc sector-routing problem (OASRP) because a street sweeper team work in a sector, and any team may not overcome their workload, making it necessary to know the path of each team.
Sectors are projected for human street sweepers by the length of the cleaning path, that is most commonly approximated by the workload of a day. The sweep distances in meters are references to workload that can vary depending upon the slope and the pavement to be swept. In Figure 23 it is projected a sector for three teams of two man, working at most for 2.8 km per day, in a defined sidewalk area for the sub-municipality of Campo Limpo/São Paulo-SP.
Figure 23.
Sectors for human sweeping in Campo Limpo-São Paulo/SP.
5.3.2 Mechanical sweeping
In mechanical street sweeping, the work is directly performed by the concessionaires on the most important roads, avenues, and marginals. The work is performed by large wash-sweepers equipped 1000–5000 L tanks of water, steel sweepers, and big vacuum cleaners. The sweeping velocity does not exceed 7–10 km/h, and two people work with the machine (driver and auxiliary). Road coverage occurs daily, but some of them are covered three times per week at night. The frequencies are defined for each place according to their importance. In Figure 25 it can be seen the region and the sector’s solution proposed to the sub-municipality Campo Limpo/São Paulo for mechanical street sweeping.
The problem of mechanical sweeping is closely related to that of the human sweeper, although the network is mixed in this case, and the required links become required arcs when the traffic flow must be followed. We can solve the OSARP by using open routes. To design the open routes, we propose the use of the open MRPP (OMRPP), where we adapt SisRot LIX® to perform nearly or optimally for all routes. There are many ways to cross the street from the gutters on both sides, where the cleaning may be performed, but a single graph transformation can be performed to solve the OMRPP as a MRPP, [70, 71, 72].
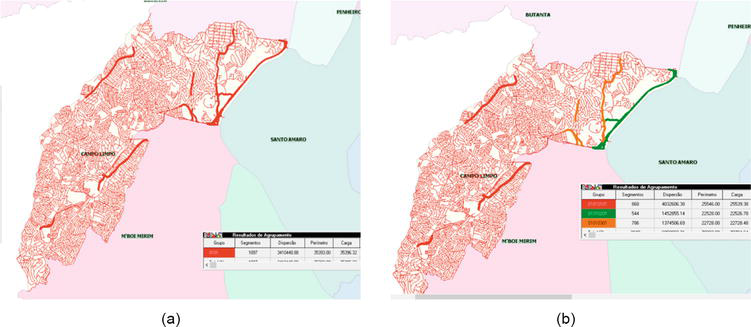
By applying the methods developed for SisRot LIX®, we achieve superior results than those previously obtained by EcoSampa concessionary. The results demonstrate that it is possible to reduce the number of sectors and still reduce the total time spent on working by 49.20% and distance traveled by mechanical sweepers by 10.52% using their own fleet, Figure 24.
Figure 24.
Sectoring mechanical street sweeping for Campo Limpo, São Paulo/SP. (a) Region of mechanical sweeping in Campo Limpo, São Paulo/SP. (b) Sectoring the region accordingly vehicle coverage constraints from Figure 24a.
5.3.3 Domiciliary waste collection with hill climbing
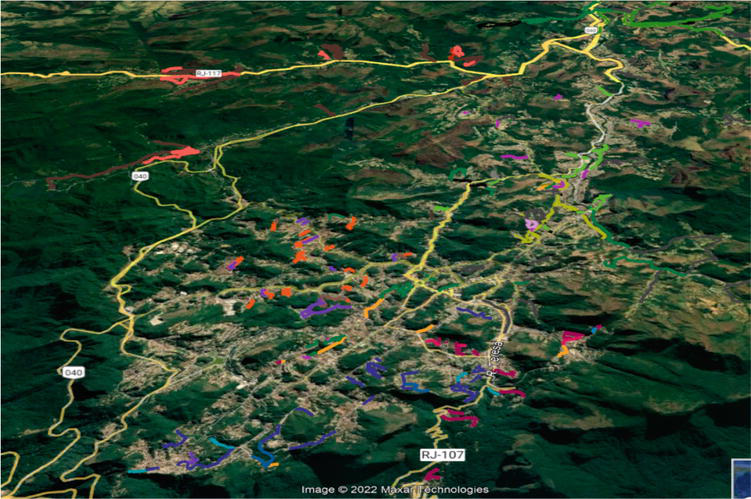
The sectoring problem of domiciliary waste collection with hill climbing appeared during a project in the city of Petropolis/RJ – Brazil, to optimize domiciliary waste collection sectors and routes. The city of Petropolis/RJ is located along the Mantiqueira mounting range, where heights between 400 and 1000 m above the sea level in a bumpy relief are present, narrow and sloping streets are in general along the paving paths; these provoke great difficulty in up, down and collecting when compactors are used, because the weather is humid with frequently rain turning slippery and dangerous the collecting paths in heavy loads. Driving and waste collecting in such places are very difficult and dangerous. It is usual driving in reverse for more than 600 m while cars remain park along sidewalks.
Special compactors are used to do the waste collection, they are called “giricas.” They have 3.5 t of load capacity at maximum, and they are smaller than the compactor used by the local operator. This vehicle is lighter also and faster. But it also suffers in high slopes and slippery paving paths. In Figure 25 it can be seen a satellite photo from the area of Petropolis/RJ, and the places identified that are covered only by “giricas”. In fact the paths with these characteristics are spread out along the city.
Figure 25.
Places where only “giricas” can cover.
The contractor owns two types of vehicles that can cover the city, and only “giricas” are able to cover any path with moderate slopes. Their problem is to design capacitated clusters of sectors that cover a region with special service for required arcs considering the different capacities and quantities of their available vehicles. To make sectors using such heterogeneous and specialized fleet, the sectoring problem can be reduced to the Multi-Capacitated Centerd Clustering Problem (MCCCP), as follows:
L: Is the set of dimensions: L={Latitude, Longitude, Height}.
I: The set of required arcs.
J: The set of sectors.
K: The set of types of services.
∣L∣: Cardinality of the set L, i. e., number of dimensions of the geographical coordinates.
n: Cardinality of the set I, i. e., number of required arcs.
m: Cardinality of the set J, i. e., number of sectors.
∣K∣: Cardinality of the set K, i. e., number of types of service.
CSj: cost to install a sector j.
CVk: cost to allocate a vehicle of type k.
VVk: variable cost per km to use vehicle of type k.
dijk: distance between the center of a required arc i and the center of the sector j with service k.
ail: Coordinate of the center of required arc i in dimension l.
qi: Demand of required arc i.
Qjk: The capacity of sector j for the type of service k.
such that:∑l∈Lailxijk−x¯jl2≤dijk2,dijk≥0,i∈I,j∈J,E94
∑i∈I∑k∈Kxijk≥yj,j∈J,E95
∑j∈J∑k∈Kxijk=1,i∈I,E96
∑j∈J∑k∈Kqixijk=qi,i∈I,E97
∑i∈Iqixijk≤Qjkyj,j∈J,k∈K,E98
∑k∈Kxijk−yj≤0,i∈I,j∈J,E99
∑i∈Iailxijk=x¯jlNSjk,∀j∈J,∀l∈L,E100
∑j∈JNSjk=NVk,k∈K,E101
∑j∈Jyj≤∑k∈KMSk,E102
∑j∈JNSjk≤MSk,k∈K,E103
xijk,yj∈01,i∈I,j∈J,k∈K,E104
x¯jl∈R,J∈J,l∈L,E105
NSjk,NVk∈N,j∈J,k∈K.E106
Costraint (94) is second-order cone, which forms a convex set. The MCCCP considers in (93) the minimization of the fixed cost to use sector j and vehicles of type k, and the variable cost to service all required arcs. Constraint (94) defines the distance from a required arc to its center j for the service k. Constraint (95) warranties the assignment of sector center j to its required arcs with all services involved. In constraint (96) it is guaranteed that the service of a required arc will be assigned to a sector with a service. Constraint (97) guarantees the demand of a required arc is covered for any type of service. In constraint (98) the total waste offer of a sector j with service k does not overpass the capacity of the cluster j with service k. Constraint (99) guarantees the existence of a required arc to a sector if it is opened. Constraint (100) defines the center of the sector j with service k. Constraint (101) guarantees the number of sectors of service k is the number of vehicles of service k. Constraint (102) guarantees the number of opened sectors is at most the sum of number of maximum sectors available per service k. Constraint (103) guarantees the number of sectors of type k is at most the maximum number of sectors to service k. Constraints (104–106) define the decision variables.
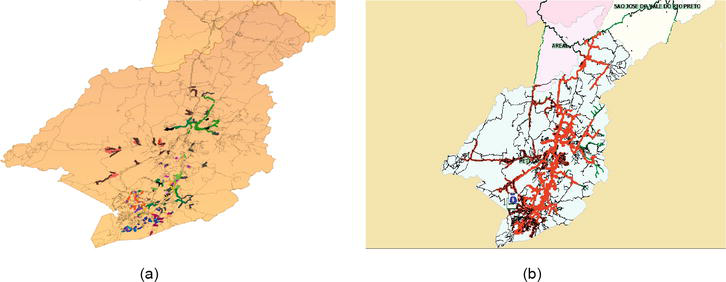
The MCCCP problem is still NP-Hard as its version proposed by [73] and most recently deeply investigated by [74]. In Figure 26a this problem can be seen in a resolution process considering that the required arcs coverage must be considered and in Figure 26b it is seen the places where special required arcs must be covered only by “giricas.”
Figure 26.
Region to be covered by domiciliar waste collection in Petrópolis/RJ. (a) Situation where only “giricas” can cover. (b) Region of coverage in Petrópolis/RJ.
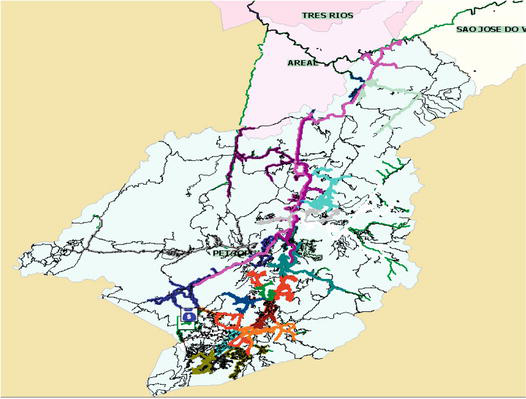
The solution presented in Figure 27 “giricas” may cover both types of required arcs, and they have to be placed in areas that maximize the coverage of the special required arcs, although they have also to cover non specials. The clustering process is supposed to warranty the separation between groups of service, but it does not guarantee that they will be non-overlapping clusters.
Figure 27.
Solution using “giricas” (3.5t) and compactors (8t) for Petrópolis/RJ.
5.4 Spatial DSS to waste collection logistic planning
Graphvs™ developed for more than 30 years a spatial DSS to automatically solve sector-arc-routing problems for many different types of waste collection services. The spatial DSS is called SisRot LIX®, and it is being used with practical impressive results (up to 28% on savings) for applications in domiciliary waste collection (Campo Grande/MS, Petrópolis/RJ, and others), selective waste collection (Naviraí/MS, Casimiro de Abreu/RJ, Xanxerê/SP, Bom Jesus dos Perdões/SP, and others), street sweeping human and mechanical (São Paulo/SP), and most recently to Domiciliary Hill Climbing (Petrópolis/RJ).
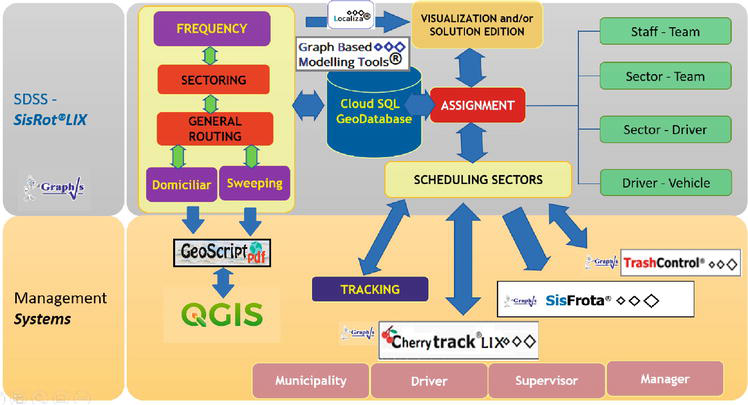
The framework of spatial DSS systems is described by its architecture in the Figure 28. It is divided in two parts, the VPS-based tool and the mobile and management tools. In the VPS-based tool there is a georeferenced database linked to QGIS and an ESRI™-based component to read the maps and transform its information into a graph, by using an extended graph-based modeling system (E-GBMS), specially developed to waste collection. With the E-GBMS it is possible to include and edit the required network to design sectors and routes, and all the necessary tools to manipulate information about street loads and pathways characteristics. The system can solve problems in sectoring and routing for heterogeneous fleet, that is informed in the database.
Figure 28.
Spatial decision support system for waste collection logistic planning.
The software is composed of frequency data management and assignment to zones of collection for any type of service, and it contains actual state-of-the-art solvers for solving routes related to general mixed rural postman problem or even general windy rural postman problem, [56, 72].
SisRot LIX® can be used for the operational level. It contains a database to store vehicles characteristics, supervisors, drivers, garis, and teams of collection to schedule them in the related service to be performed daily.
Special reports can be generated by SisRot LIX® with the tool GeoScript®. This tool uses KML files created by the main software that defines zones, sectors, circuits, and routes of the circuits, and draws them in a GIS-based GPS, using different back map resources (Google MAPs, OSM, Bing, etc). All the maps are presented in PDF formats. The KML files generated can be used also by Google Maps or QGIS, as the XLS files that describe the routes street by street.
Once the sectors and routes are defined, they can be sent to another VPS environment that track mobile units running CherryTrack LIX®. This software is composed of four Android mobile applications: Driver, Manager, Supervisor, and Municipality. In the driver unit it is possible to receive the routes (trips) of a sector projected by the SisRot LIX®, and while performing them the software teaches the path as it was projected, facilitating the identification of the work to be done by any driver. Major information about the load per trip, geographical movements, and reported occurrences while running the execution of collection are kept by the software. These information saved in the manager unity that follows each driver in the field, while they are running sector by sector, circuit by circuit. The supervisor app shows the vehicles related only to the supervisor they are allocated. The municipality unity app shows the movements of the vehicle that will attend the citizen home, giving estimates about when it will pass in front to his/her door.
Other tools such as TrashControl® and SisFrota® can be integrated to the VPS to control the loading production and vehicles maintenance standard controls respectively.
As indicated in the previous sections, all combinatorial models here exposed for different instances of the CCP problem are related to NP-Hard problems. In these approaches the models hold a polynomial number of variables and constraints because there is no need to represent all the partitions related to the clustering process. Although this happens, it is not avoided to solve problem that explodes in exponential complexity with the number of items in the clustering formation.
6.1 IT teams
Here we propose models that are possible to be solved to optimality by state-of-the-art solvers such as Cplex, Xpress, and Gorubi in the case of the IT-Teams Layout, as can be seen in [11].
We presented a solution (Figure 5b) for a software factory layout with 121 workplaces and 17 heterogeneous groups, it was obtained in less than 2 seconds using a 10th generation I7-Intel and the Gurobi solver, while this same layout is normally prepared by two persons during 2–3 working days. This impacts directly in better development of teams because people working together do not need to disturb much the other groups in work, meanwhile the interaction of the ordinary groups is facilitated at maximum.
The model proposed does not consider that specific groups has to be close, or even facilitate the dynamic recalculation of groups when the projects are ended and teams are dissolved. These problems remain open, but they can be solved heuristically by the same model if appropriate considerations are made.
6.2 Staff collection and dispatch
Our experience with staff collection/dispatch in the field was with a staff transporter in the state of São Paulo. The transporter works for an industrial food company that had a very confusing schema to collect/dispatch its staff in the state, between 10 municipalities: São Paulo, Guarulhos, Osasco, Carapicuiba, Jandira, Barueri, Itapevi, Taboão da Serra, São Bernardo, Figure 29a. The transporter had eight garages where busses departs/returns and the destiny/return at the factory, Figure 29b. They had 98 workers, which were scheduled along nine entry times and 10 departure times, Figure 30a. The transporter offered a fleet of busses with 15, 27, and 48 seats and it had to perform the travels from the first collection to destiny or from the factory to the last dispatch in at most 2 h considering the traffic jams, and the workers must be collected or dispatched at most 800 m far from his home. The workers cannot arrive at the factory late or spend more than 15 min waiting to arrive/departure of any bus.
Figure 29.
Territorial context of the problem. (a) Staff’s territorial dispersion. (b) Territorial distribution of contractor’s bases and the factory.
Figure 30.
Staff daily in/out turns and planned fleet to attend them. (a) Staff’s labour time distribution. (b) Distribution of the number of buses along daytime.
The indicated problem was proposed to generate the minimum fleet with set of routes that can cover all the shifts with minimum cost of distance and time spent on the activity, while also maximizing the number of bus-stops along the main avenues and streets.
The case was solved by using the methodology here proposed to locate bus-stops as capacitated medians and after applying the routing process over the selected bus-stops. Unhappily our results were not comparable with the transporter because it will not consider the constraint of time for the worker departure. In Figure 30b the number of busses in operation per hour of the day is illustrated as calculated by our solution.
Taking a shift as an example, Figure 31, we have to perform routes for this shift to pickup and dispatch the staff belonging to it. Figure 32 illustrates these two steps (Figure 32a) of collection and (Figure 32b) dispatch of the same set of workers using routes calculated by SisRot Full and sent to Routes that use Google Maps to propose the best route (with better travel time) considering the traffic conditions from arrival/departure to/from factory for a given calculated sequence of visits.
Figure 31.
One shift routes of the staff.
Figure 32.
Routes of collection and dispatching workers. (a) Route of collecting. (b) Route of dispatching.
6.3 Waste collection
Our experience with CCP models in waste collection is more expressive, because we investigated and developed many cases in Brazil related to the theme using basically SisRot LIX. We divide our main results in domiciliary waste collection and street sweeping.
6.3.1 Results in domiciliary waste collection
For domiciliary waste collection, the sectoring approach returned unexpected and impressive results for CCCP models and solving methodology, even for us. In the city of Campo Grande, the capital of the state of Mato Grosso do Sul (MS) in Brazil, we tested our sectoring models for a region (downtown) covered by five vehicles of 15ton each. The sectors were redefined into four sectors and the routes in total were reduced the distance costs by 28% with the same total time spent for the service, [75].
Most recently, our methodology was tested for the city of Petrópolis in the state of Rio de Janeiro, with a completely different traffic network (many hills and curves) but with the same context. The contractor worked with five vehicles of 8ton in five sectors daily, and after redefining the sectors we achieved for the light days (Tue-Sat) four sectors with 26% of savings in travel distance, and for the heavier days we reduced in 8% the total travel distance performed by the fleet.
In both cases the solution editing tools developed in SisRot LIX were very important and decisive, because the process of sector-routing is performed separately. The manual intervention after the calculation of the sectors is a decision tool related to situations that could be included and are not present at the model’s constraints. Problems such as servicing certain places prior to others, duplicate services in different trips on the same sector, side of the service, etc., are some examples of these situations that had to incorporate local decisions and manual intervention.
6.3.2 Results in human street sweeping
The use of CCP models in street sweeping was conducted in an application in the city of São Paulo, for the project PMI-SP organized by the Municipal Secretary of Partnerships during 2018 [69]. The projects were conducted to attend non-scalable services as human and mechanized sweeping, collection in fairs, old furniture and rubble removal, etc.
The CPP models used were conducted by math-heuristics developed by Negreiros et al. [56] and Batista et al. [59], to design sectors basically for human street sweeping. There were 32 sub-municipalities composed by populations between 150 and 400 thousand inhabitants, and diverse coverage areas of sweeping: hills, roads, avenues, and streets on suburbs or downtown, squares, etc. The teams of human sweepers, as reported in subsection 5.3, were composed by two sweepers with a “lutocar”, and the sectors to be covered by each team were designed accordingly the frequency of coverage of each one stipulated by AMLURB. Our results revealed that we could develop the same activity in comparison to the previously reported executed plans with 27.7% of reductions in the number of teams and 46.38% in distances performed by the workers.
A “Map of Frequency” of the sub-municipality of Santana-Tucuruvi/SP is presented at Figure 33, where among the most evident colors, there are: Light-Green: Daily – Morning; Navy Blue: Wednesday/Saturday – Morning, Green: Monday/Thursday – Morning, Red: Tuesday/Friday corresponding to the days and regions where the team of sweepers must work. Following, Figure 34 consists of two figures considering sectoring human street sweepers, in Figure 34a it is illustrated in more detail the street map of sweeping frequency to be performed on Tuesdays and Fridays, and in Figure 34b it is seen the 21 sectors defined by the HCCCP model to be covered by 21 teams of street sweepers.
Figure 33.
Map of sweeping frequency for the teams of sweepers.
Figure 34.
Human street sweeper sectoring solution for Santana-Tucuruvi (ST) municipality. (a) Street area for sweeping sectors on Tue/Fri - Morning at ST (b) 21 sweeping sectors for Tue/Fri - Morning at ST.
As can be seen in Table 1, it presents the results of applying Open Sector Arc Routing (OSAR) in the city of São Paulo, in comparison with the solution used by the municipality. Table 1 represents as Sub-Mun the sub-municipality of the city of São Paulo: BT – Butantã, CV – Casa Verde, PR – Parelheiros, ST – Santana-Tucuruvi, VG – Vila Maria-Vila Guilherme; the term Sectors means the number of sectors defined; Sweep perimeter (km) is the total perimeter that has to be swept by the sweepers; Manual sweep is the number of km per day that the teams perform for the specific solution; Bidding is what it is projected by the municipality; SLix are the values used or projected by SisRot Lix; and finally Gap% means the difference between considerations or solutions.
Sub-Mun
Sectors
Sweep perimeter (km)
Manual sweep - km/day
Bidding
SLix
Gap%
Bidding
SLix
Gap%
Bidding
SLix
Gap%
BT
131
121
7.63
763.14
760.29
0.37
275.13
197.72
28.14
CV
82
60
26.83
406.52
407.1
−0.14
199.392
156.57
21.48
PR
36
29
19.44
165.62
166.82
−0.72
61.37
39.62
35.44
ST
152
75
50.66
493.95
321.1
34.99
242.765
148.11
38.99
VG
68
54
20.59
395.24
364.24
7.84
395.744
87.75
77.83
Totals
469
339
27.72
2224.47
2019.55
9.21
1174.40
629.77
46.38
Table 1.
Recorded gains and losses between projects from SP-municipality and GRAPHVS with SisRot LIX.
Table 1 presents the expressive reduction on human resources and distances of work between projects. The cause of this was the effect of the HCCCP-related mathematical methods applied in the practical level, [75].
This chapter presents new models for versions of the Capacitated Clustering Problem to IT-Teams layout, logistic distribution, environmental and health applications. Each application needs special constraints that come from basic knapsack and scheduling problems that affect considerable the complexity of the resolution of their instances. We showed the use of the proposed models in real applications and its formal importance to consider solving these very difficult problems.
For MSSC and gPCCCP, we proposed convex linear-quadratic alternative models to solve the problems, turning them tractable at least for medium-scaled instances.
We also reported DSS architectures already implemented that are successful in their applications in Brazil, returning high savings to the end users. The architectures presented much differ between real-life applications considering the information needed to support decision and the effort for monitoring plans as they were conceived.
This chapter also reveals a work of a research & development (R&D) team that develops all these computational framework and decision tools, taking into consideration the state-of-the-art in GIS, web services, map services, database services, graph-based modeling, specialized optimization algorithms and solvers for clustering, location, general routing.
As it is shown in the results section, the CCP can be used with wide success for the mentioned applications and could be further used for many different others from the ones here revealed and investigated.
We thank Intech Open for the invitation to write this manuscript, specially we also thank the Editor Fausto Pedro García Márquez and Iva Ribic for the kind support during the evolution of this work.
We would like to thank the team of programmers and collaborators from GRAPHVS Ltda: Antônio Honorato Guedes, Bruno Chaves, Cícero Elias Guedes, João Amilcar, and Luiz Prudencio.
We also thank Carlos Higashi, Donizete Calil, Eduardo Reis, André Barufi, and Heraldo Neto for their collaboration in the access to staff collection and dispatching, emergency health systems, and waste collection, respectively.
Finally, our thanks to the researchers and readers of this manuscript, who kindly share with our discoveries, ideas, and great effort to turn this work accessible and worth to the humanity.
Autarquia Municipal de Limpeza Urbana de Săo Paulo
ASRP
Arc sector-routing problem
CCP
Capacitated clustering problem
CCCP
Capacitated centerd clustering problem
COVID-19
Disease provoked by SARs-COVID-19 Virus
CpMP
Capacitated p median problem
gCpMP
Generalized capacitated p median problem
gCCCP
Generalized capacitated centerd clustering problem
pCCCP
Capacitated p-centerd clustering problem
gMCCP
Generalized multi-capacitated clustering problem
HCSRP
Heterogeneous capacitated sector-routing problem
DATAPREV
Empresa de tecnologia e informaçõμes da Previdência (Brazil)
DSS
Decision support system
DgMCCP
Dynamic generalized multi-capacitated clustering problem
DgMCCCP
Dynamic generalized multi-capacitated centerd clustering problem
EMS
Emergency medical system
ERP
Enterprise resource planning
GBMS
Graph based modeling system
GRP
General routing problem
HCCCP
Heterogeneous capacitated centerd clustering problem
MCCCP
Multi-capacitated centerd clustering problem
MRPP
Mixed rural postman problem
MSSCP
Minimum sum of squares clustering problem
OMRPP
Open mixed rural postman problem
SAMU
Serviço de Atendimento Móvel de Urgência
SERPRO
Serviço federal de processamento de dados (Brazil)
SWM
Solid waste management
WHO
World Health Organization
References
1.MacQueen J. Some methods for classification and analysis of multivariate observations. In: Fifth Berkeley Symposium on Mathematics. Statistics and Probability. University of California Press; 1967. pp. 281-297
2.Hartigan JA. Clustering Algorithms. John Wiley and Sons; 1975
3.Hansen P, Jaumard B. Cluster analysis and mathematical programming. Mathematical Programming. 1997;79(1):191-215. DOI: 10.1007/BF02614317
5.Jain AK. Data clustering: 50 years beyond K-means. Pattern Recognition Letters. 2010;31:651-666. DOI: 10.1016/j.patrec.2009.09.011
6.Xavier A. The hyperbolic smoothing clustering method. Pattern Recognition. 2010;43(3):731-737. DOI: 10.1016/j.patcog.2009.06.018
7.Xavier A, Xavier V. Solving the min-sum-of-squares clustering problem by hyperbolic smoothing and partition into boundary and gravitational regions. Pattern Recognition. 2011;44:70-77. DOI: 10.1016/j.patcog.2010.07.004
8.Gambella C, Gaddar B, Naoum-Sawaya J. Optimization problems for machine learning: A survey. EJOR. 2021;290(3):807-828. DOI: 10.1016/j.ejor.2020.08.045
9.Pinto R, Ouzia H, Maculan N. New Mixed Integer Non-linear Programming (MINLP) Models for the Euclidean Steiner Tree Problem in Rn. UFRJ-COPPE/ES-Technical Report: ES-769/20; 2020
10.Linhares MBA. DOIS ENFOQUES PARA A RESOLUÇÃO DO PROBLEMA DE AGRUPAMENTO. (in Portuguese) [MSc Dissertation], UFRJ-COPPE-ES; 2021
11.Negreiros M, Maculan N, Batista P, Palhano A, Rodrigues J. Capacitated clustering problems applied to the layout of IT-teams in software factories. Annals of Operations Research. 2020. DOI: 10.1007/s10479-020-0378
12.Mulvey J, Beck M. Solving capacitated clustering problems. European Journal of Operational Research. 1984;18:339-348
13.Negreiros M, Palhano AWC. The capacitated centred clustering problem. Computers & Operations Research. 2006;33(6):1639-1663. DOI: 10.1016/j.cor.2004.11.011
14.Negreiros M, Palhano A, Silva ID. An evaluation of two supply chain models for the newspapers subscribers and bulk milk collection. Revista Produção. 2005;5
15.Liao K, Guo D. A clustering-based approach to the capacitated facility location problem. Transactions in GIS. 2008;12:323-339. DOI: 10.1111/j.1467-9671.2008.01105.x
16.Negreiros M, Xavier AF, Xavier AE, Maculan N, Michelon P, Lima JW and Andrade O. Optimization Models, Statistical and DSS Tools for Prevention and Combat of Dengue Disease. Vol. Chapter 7. London, UK: INTECH; 2011. pp. 115–160. DOI: 10.5772/16857
17.Boudahri F, Bennekrouf M, Belkaid F, Sari Z. Application of a capacitated centered clustering problem for design of Agri-food supply chain network. IJCSI - International Journal of Computer Science Issues. 2012;9(1):300-304. DOI: 10.1016/j.ejor.2005.06.074
18.Chou C-A, Chaovalitwongse WA, Berger-Wolf TY, Dasgupta B, Ashley MV. Capacitated clustering problem in computational biology: Combinatorial and statistical approach for sibling reconstruction. Journal of Advances in Computer Research. 2012;39(3):609-619. DOI: 10.1016/j.cor.2011.04.017
19.Bard J, Jarrah A. Integrating commertial and residential pickup and delivery networks: A case study. Omega. 2013;41(4):706-720. DOI: 10.1016/j.omega.2012.09.001
20.Javadi M, Shahrabi J. New spatial clustering-based models for optimal urban facility location considering geographical obstacles. Journal of Industrial Engineering International. 2014:10-54. DOI: 10.1007/s40092-014-0054-x
21.Pillai A, Chick J, Johanning L, Khorasanchi M, de Laleu V. Off shore wind farm electrical cable layout optimization. Engineering Optimization. 2015;47(12):1689-1708. DOI: 10.1080/0305215X.2014.992892
22.Moreno S, Pereira J, Yushimito W. A hybrid k-means and integer programming method for commercial territory design: A case study in meat distribution. Annals of Operations Research. 2017;286:87-117. DOI: 10.1007/s10479-017-2742-6
23.Barreto S, Ferreira C, Paixão J, Santos BS. Using clustering analysis in a capacitated location-routing problem. European Journal of Operational Research. 2007;179(3):968-977
24.Buhrmann JH. “The Effects of Clustering on the Medium and Large-Scale Capacitated Location-Routing Problem” [PhD Thesis]. Johannesburg: University of the Witwatersrand; 2016
25.Deng Y, Bard J. A reactive GRASP with path relinking for capacitated clustering. Journal of Heuristics. 2011;17:119-152. DOI: 10.1007/s10732-010-9129-z
26.Araújo E, Poldi K, Chaves A. Clustering search applied to the periodic vehicle routing problem: A case study in waste collection. Annals of SBPO - Natal/RN. 2013:1916-1926
27.Madsen OB. A survey of methods for solving combined location-routing problems. In: Jaiswal NK, editor. Scientific Management of Transport Systems. Amsterdam: North-Holland; 1981
28.Laporte G, Nobert Y, Arpin D. An exact algorithm for solving a capacitated location-routing problem. Annals of Operations Research. 1986;6(9):293-310
29.Laporte G. Location-routing problems. In: Golden BL, Assad AA, editors. Vehicle Routing: Methods and Studies. Amsterdam: North-Holland; 1988
30.Nagy G, Salhi S. Location-routing: Issues, models and methods. European Journal of Operational Research. 2007;177(2):649-672
31.Borges Lopes R, Ferreira C, Santos BS, Barreto S. A taxonomical analysis, current methods and objectives on location-routing problems. ITOR. 2013;20(6):795-822. DOI: 10.1111/itor.12032
32.Laporte G. A survey of algorithms for location-routing problems. Investigación Operativa. 1989;1(2):93-123
33.Silva Neto IC, Bulhoes T, Subramanian A. Um algoritmo heurstico para o problema de roteamento de ônibus escolares. Annals of LII SBPO, Joao Pessoa/PB. 2020:12
34.Lopes RB, Barreto S, Ferreira C, Santos BS. A decision-support tool for a capacitated location-routing problem. Decision Support Systems. 2008;46(1):366-375
35.Muritiba A, Negreiros M, Souza M, Oriá H. Tabu-search with path relinking to the capacitated Centred clustering problem. Expert Systems with Applications. 2022;198. DOI: 10.1016/j.eswa.2022.116766
36.Negreiros M, Maculan N, Xavier AE. (in Portuguese)Projeto Webdengue; Evolução e recursos implementados. UFRJ-COPPE/PESC Technical Report: ES-763/20. 2020
37.Calixto AB. Dynagraph: Um modelo de edição e representação de graphvs dinâmicos. MPCOMP-UECE-CEFET; 2013 (in Portuguese) [MSc Dissertation]
38.Chaves B. Uma metodologia de agrupamento e previsão espaço-temporal: Aplicação na Expansão da Dengue e Chikungunya em Fortaleza/CE. MPCOMP-UECE-CEFET; 2019 (in Portuguese) [MSc Dissertation]
39.Costa DM. (in Portuguese)Uma metodologia iterativa para determinação de zonas de atendimento de serviços emergenciais.” [Thesis]. Florianópolis: Eng Produção, Universidade Federal de Santa Catarina; 2004
40.Galvão R, Morabito R. Emergency service systems: The use of the hypercube queueing model in the solution of probabilistic location problems. International Transactions in Operational Research. 2008;15:525-549. DOI: 10.1111/j.1475-3995.2008.00654.x
41.Souza RM, Morabito R, Chiyoshi FY, Iannoni AP. (in Portuguese)Análise da configuração de SAMU utilizando múltiplas alternativas de localização de ambulâncias. Gestão & Produção, São Carlos. 2013;20(2):287-302
42.Pons PT, Markovchick VJ. Eigth minutes or less: Does the ambulance response time guideline impact trauma patient outcome? The Journal of Emergency Medicine. 2002;23:43-48
43.Oliveira MJ, Garcia LC. (in Portuguese)A teoria da simulação a eventos discretos na análise do dimensionamento do serviço de atendimento móvel de urgência (SAMU-192). SPOLM. 2005. https://www.marinha.mil.br/spolm/anais/2005
44.Silva PMS. Análise do serviço de atendimento móvel de urgência (SAMU) de Belo Horizonte via simulação e Otimização.”, (in Portuguese) [MSc Dissertation]. Eng Produção, UFMG. 2010
45.Motta DPS, Lopes RSM, Rodrigues LF. (in Portuguese)Análise de desempenho do SAMU de Ouro Preto e Mariana através de modelos de simulação. Revista de Gestão em Sistemas de Saúde, São Paulo. 2021;10(3):296-319. DOI: 10.5585/rgss.v10i3.18710
46.Larson RC. Hypercube queuing model for facility location and redistricting in urban emergency services. Computers and Operations Research. 1974;1:67-95. DOI: 10.1016/0305-0548(74)90076-8
48.Nogueira Junior LC, Pinto LR, Silva PMS. Reducing emergency medical service response time via the reallocation of ambulance bases. Health Care Management Science. 2014;19(1):31-42
49.Laporte G, Dejax PJ. Dynamic location-routeing problems. Journal of the Operational Research Society. 1989;40(5):471-482
50.Galvão RD, Santibañez-Gonzalez ER. A Lagrangean heuristic for the pk-median dynamic location problem. European Journal of Operational Research. 1992;58:250-262
51.Averbakh I, Berman O, Simchi-Levi D. Probabilistic a priori routing-location problems. Naval Research Logistics. 1994;41(7):973-989
52.Current J, Ratick S, ReVelle C. Dynamic facility location when the total number of facilities is uncertain: A decision analysis approach. European Journal of Operational Research. 1997;110:597-609
53.Rajagopalan HK, Saydam C, Xiao JA. Multiperiod set covering location model for dynamic redeployment of ambulances. Computers and Operations Research. 2008;35:814-826
54.Mourão MC, Nunes AC, Prins C. Heuristic methods for the sectoring arc routing problem. European Journal of Operational Research. 2009;196(7):856-868
55.Cortinhal MJ, Mourão MC, Nunes AC. Local search heuristics for sectoring routing in a household waste collection. European Journal of Operational Research. 2016:1-12. DOI: 10.1016/j.ejor.2016.04.013
56.Negreiros, M, Palhano A, Batista AP, and Maculan N. “The heterogeneous sector routing problem”. Submitted to EJOR. 2022. p. 54
57.Ghiani G, Mourão C, Pinto L, Vigo D. Routing in waste collection applications. In: Corberán A, Laporte G, editors. Arc Routing Methods and Applications. Chapter 15 ed. MOS-SIAM Series on Optimization; 2014
58.Rodrigues AMM, Soeiro J. Waste collection routing—Limited multiple landfills and heterogeneous Fleet. Networks. 2015;65(2):155-165. DOI: 10.1002/net.21597
59.Batista P, Negreiros M, Muritiba A, Palhano A. New framework of metaheuristics for the capacitated Centred clustering problem. Preceedings of XI MIC, Metaheuristic International Congress. 2015
60.Garcıa-Ayala G, González-Velarde JL, Rıos-Mercado RZ, Fernandez E. A novel model for arc territory design: Promoting Eulerian districts. International Transactions in Operational Research. 2016;23:433-458. DOI: 10.1111/itor.12219
61.Ulusoy G. The fleet size and mix problem for capacitated arc routing. European Journal of Operational Research. 1985;22(3):329-337
62.Logística Ambiental de São Paulo S.A - Loga. Caracterização dos resíduos domiciliares do município de São Paulo Agrupamento Nordeste - 39° quadrimestre Julho/Agosto/Setembro/Outubro – 2017, CL-NO-10/17. (in Portuguese)
63.Ecourbis Ambiental Ltda - Ecourbis. Caracterização dos resíduos domiciliares do município de São Paulo Agrupamento Sudeste 3° Quadrimestre 2017 - 39° Quadrimestre do contrato de concessão. (in Portuguese)
64.PMSP. (in Portuguese)PGIRS Plano de Gestão Integrada de Resíduos Sólidos da cidade de São Paulo, Comitê Intersecretarial para a política municipal de resíduos sólidos. Prefeitura Minicipal de São Paulo. 2014
65.SANETAL. (in Portuguese)Plano Municipal de Gestão Integrada de Resíduos Sólidos de Fortaleza. Estado do Ceará”, Relatório IV: ACFOR; 2012
66.PMRJ. Decreto 37.775 - Plano Municipal de Gestão Integrada de Resíduos Sólidos - PMGIRS da Cidade do Rio de Janeiro. 2013. (in Portuguese)
67.Recicleiros. Recicleiros Cidades (Project). https://recicleiros.org.br/cidades/ [Accessed: March 14, 2022]
68.Graphvs. SisRot Lix. http://www.graphvs.com.br/?p=65 [Accessed: March 25, 2022]
69.Graphvs and Barufi. Modelos e Planos de Otimização para a Integração do Sistema Logístico de RSU da Cidade de São Paulo”, PMI/SP-2018. São Paulo Parcerias/PMSP; 2018
70.Corberán A, Sanchis JM. The general routing problem polyhedron: Facets from RPP and GTSP polyhedral. European Journal of Operational Research. 1998;108:538-550
71.Corberán A, Romero A, Sanchis JM. The mixed general routing problem polyhedron. Mathematical Programming. 2003;96:103-137
72.Negreiros M. GTSP based procedures for the mixed rural postman problem. Submmited to Networks. 2022
73.Prata B. The Multi Capacitated Clustering Problem, Technical Report. Universidade Federal do Ceará; 2015
74.Araújo KAG, Guedes JB, Prata BA. Hybrid matheuristics for the multi-capacitated clustering problem. RAIRO Operations Research, forthcomming. 2022
75.Negreiros MJ, Palhano AWC, Reis E. Optimized planning and management of solid waste – Results of application in Brazilian cities (SisRot LIX). In: Solid Waste Management - Recent Advances (ISBN 978–1–80356-327-5). London, UK, forthcomming: InTech Open Books; 2022
Written By
Marcos J. Negreiros, Nelson Maculan, Augusto W.C. Palhano, Albert E.F. Muritiba and Pablo L.F. Batista
Submitted: 25 April 2022Reviewed: 05 May 2022Published: 11 August 2022
 Open access peer-reviewed chapter